

Abstract
Locus control regions (LCRs) alleviate chromatin-mediated transcriptional repression. Incomplete LCRs partially lose this property when integrated in transcriptionally restrictive genomic regions such as centromeres. This frequently results in position effect variegation (PEV), i.e. the suppression of expression in a proportion of the cells. Here we show that this PEV is influenced by the heterochromatic protein SUV39H1 and by the Polycomb group proteins M33 and BMI-1. A concentration variation of these proteins modulates the proportion of cells expressing human globins in a locus-dependent manner. Similarly, the transcription factors Sp1 or erythroid Krüppel-like factor (EKLF) also influence PEV, characterized by a change in the number of expressing cells and the chromatin structure of the locus. However, in contrast to results obtained in a euchromatic locus, EKLF influences the expression of the γ- more than the β-globin genes, suggesting that the relief of silencing is caused by the binding of EKLF to the LCR and that genes at an LCR proximal position are more likely to be in an open chromatin state than genes at a distal position.
Keywords: gene activation/position effects/transcription
Introduction
The observation that the presence of the β globin locus control region (LCR) results in copy number-dependent expression of a globin transgene, independent of its position of integration in the host genome, led to the proposal that LCR function includes the establishment and/or maintenance of an open chromatin structure (Grosveld et al., 1987; Festenstein et al., 1996; Milot et al., 1996). Partial LCRs have lost this property and are very sensitive to position effects, particularly when integrated into transcriptionally repressive regions in the genome of transgenic mice (reviewed in Kioussis and Festenstein, 1997). Such integration leads to expression in only a proportion of the cells, which is similar to classical position effect variegation (PEV) (reviewed in Karpen, 1994) or to a novel cell timing position effect, in which all cells express but for only part of the time (Milot et al., 1996). The PEV expression was found in mice containing a deletion of the hypersensitive site 2 (HS2) of the β globin LCR, but only when the transgene was integrated in transcriptionally repressive regions such as found in centromeres (Milot et al., 1996). The subpopulation of erythroid cells that did not transcribe the human β globin gene was associated with a loss of DNase I hypersensitivity within the human β globin locus. Very similar results were obtained in other studies involving partial LCRs (Robertson et al., 1995; Festenstein et al., 1996; Boyer et al., 1997; Guy et al., 1997).
Many transcription factors bind to the human β globin locus, but their role in transcriptional activation is not yet clear. An exception is the erythroid-specific erythroid Krüppel-like factor (EKLF) (Bieker et al., 1998), which is essential for adult β globin gene expression (Nuez et al., 1995; Perkins et al., 1996; Wijgerde et al., 1996). It binds in vivo to a GT motif within HS3 of the LCR, and to the CACCC box of the β globin promoter. EKLF absence results in a loss of DNase I hypersensitivity of both the HS3 and the β globin promoter (Wijgerde et al., 1996; Gillemans et al., 1998). EKLF forms a complex with members of the SWI/SNF family of proteins (Armstrong et al., 1998). Thus, one of the functions of EKLF in β globin gene regulation appears to be the remodelling of the chromatin of the β globin locus into an active structure. The influence of other members of the Krüppel-like factor family [Sp1 and Sp3 (Marin et al., 1997; S.Philipsen and F.Grosveld, unpublished)] was similarly tested but failed to show any influence on β globin gene expression.
Genetic screenings of mutations influencing PEV in Drosophila and yeast led to the identification of chromatin regulatory proteins such as HP1 or SU(VAR)3-9, collectively referred to as Su(var)s (Eissenberg et al., 1992; Reuter and Spierer, 1992; Tschiersch et al., 1994; Jenuwein et al., 1998). These proteins are thought to be crucial for heterochromatin formation, and changes in their concentration affect PEV in Drosophila (Eissenberg et al., 1992; Reuter and Spierer, 1992; Tschiersch et al., 1994). The newly identified human and mouse homologues of SU(VAR)3-9 (SUV39H1 and suv39h1, respectively) can increase PEV when expressed in Drosophila, but it is unknown whether they have such an effect in vertebrates.
Similarly, mutations of genes coding for the Drosophila Trithorax (Trx-G) and Polycomb group (Pc-G) proteins, which are normally required for the maintenance and memory of specific expression patterns (e.g. the Homeotic genes) (Pirrotta, 1997), can in some cases influence PEV (Cavalli and Paro, 1998; Sinclair et al., 1998). It has been shown that Pc-G proteins are important for transcriptional repression, which is antagonized by the Trx-G proteins. The balance of these two types of factors would competitively fix a particular expression pattern in a heritable fashion (Pirrotta, 1997). The Pc-G proteins are postulated to form complexes that would cluster genomic regions or spread over distances of the genome and restrict accessibility to the genome (Lyko and Paro, 1999).
Similar to what has been observed in Drosophila, mutations in genes coding for different mammalian Pc-G and Trx-G revealed their importance in embryonic development and in some cases, in HOX gene regulation (van Lohuizen, 1998). In a recent study Festenstein et al. (1999) provided the first evidence that mammalian PEV can be influenced by a heterochromatin-related protein, M31 (HP1 homologue). However, it is not known whether any Pc-G and Trx-G, or even Su(var)s, have an effect on mammalian PEV.
In this report we first demonstrate that mammalian PEV is modified by SUV39H1 and the Pc-G proteins BMI-1 and M33. We then show that two well known transcription factors, the ubiquitously expressed factor Sp1 or the erythroid-specific EKLF can modulate mammalian PEV. Sp1 was chosen since its closest homologue in Drosophila, the btd protein, is important for segmental identity (Schock et al., 1999) and a lack of Sp1 is fatal early in mammalian development (Marin et al., 1997), most likely by affecting the chromatin structure in many cell types. EKLF was a natural choice for this study since it is erythroid specific and known to act specifically on the β globin locus (Nuez et al., 1995; Perkins et al., 1996; Wijgerde et al., 1996).
Results
Experiments were performed using four transgenic mouse lines carrying the human β globin locus; the PEV lines Δ2B and Δ2C, which have a pericentromeric integration of the human β globin locus with a deletion of HS2 (Milot et al., 1996) and two ‘wild-type’ or control lines (72 and 2), both of which have integrated a complete 70 kb human β globin locus (Strouboulis et al., 1992) and express the β globin genes normally. In line 2 the transgene has been integrated in a position similar to that of the two ΔHS2 PEV lines, while in line 72 it is positioned much further from the centromere (E.Milot, unpublished data; and see below).
Chromosomal localization of the transgenes of PEV lines Δ2B and Δ2C
The resolution of our earlier crude localization of the transgenic loci was improved by a double detection of the transgene and the centromeric γ satellite repeats on chromatin fibres from interphase nuclei.
The satellite repeat was chosen as a reference since it was known that the Δ2B and Δ2C loci are integrated in pericentromeric regions (Milot et al., 1996). Figure 1A shows the transgene proximity to the γ satellite repeats in ‘fully stretched’ chromatin fibres obtained by Fiber-FISH (Collas et al., 1999). In both lines, Δ2B and Δ2C, the γ satellite centromeric repeats (green signal) were always in close proximity to the β globin locus (red signal). In stretched chromatin fibres (Figure 1A), the proximity of the (control) line 2 transgene and the γ satellite repeats was generally less pronounced than in Δ2B and Δ2C lines. Line 72 was never seen in association with γ satellite sequences. In order to confirm these observations, we tested the proximity of the transgenes from the centromeric foci when the chromatin fibres were only partially stretched (Figure 1B). In agreement with the result above, in lines 72 and 2 the loci were pulled free from centromeric foci (γ satellite probed or DAPI stained) in 92% (not shown) and 84% of the cells, respectively. With this level of detection, the PEV Δ2B and Δ2C lines were pulled out of the centromeric foci in only 50 and 28% of the cells. (Note that the ratio of intensity of green versus red signal is modified in order to compare both signals. This was done using a shorter exposure for the FITC band pass filter than for the Texas Red band pass filter, with the disadvantage that the γ satellite signals outside of the centromeric foci cannot be detected.)

Fig. 1. (A) Representative examples of stretched chromatin fibres obtained by Fibre-FISH. The different lines used in this study have been tested to visualize the proximity of the transgene to the centromeric γ satellite repeats. The human globin transgene is detected in red and the γ satellite repeats in green. (B) Examples of partially stretched chromatin. In these instances centromeric γ satellite repeats remain in tight conformation, which is reminiscent of centromeric conformations (as observed by DAPI staining; data not shown). The γ satellite repeats and human β globin locus double detection reveals the relative position of the locus versus the centromere. The percentage of co-localization of the locus and the γ satellite repeats is indicated for each transgenic line (it should be noted that this is a two-dimensional analysis, i.e. the actual number of co-localizations is smaller).
Thus, we conclude that the loci in lines Δ2B and Δ2C are integrated in potentially heterochromatic regions associated with the centromere. This correlation was not as apparent for the control line 2. In light of the fact that we have never found any locus with a complete β globin LCR closer to the centromere, this result suggests that complete LCR activity is incompatible with centromeric chromatin and that integration in the centromere may result in chromosomal instability and lethality.
In Drosophila and mammals, previous reports have pointed out the potential variation of the position of a locus relative to a centromere when transcriptionally active or inactive (Csink and Henikoff, 1996; Dernburg et al., 1996; Brown et al., 1997; Francastel et al., 1999). Although we have not shown that distant loci are the active ones in the PEV lines, it is tempting to speculate that only the inactive loci are associated with centromeric foci.
Su(var) group protein SUV39H1
The results above suggested that the number of cells expressing the human β globin locus was dependent on the ‘local’ chromatin structure (as in PEV). If this were the case, the number of expressing cells should be dependent on proteins that influence chromatin structures. To verify that the expression pattern observed in the ΔHS2 mouse lines is a genuine dose-dependent PEV as described in yeast and Drosophila, we first tested the effect of a variation of the concentration of a mammalian SU(VAR) group protein, SUV39H1 (Aagaard et al., 1999). SUV39H1 is the human homologue of Drosophila Su(var)3-9, a strong modifier of PEV (Tschiersch et al., 1994). In transgenic flies, expression of human SUV39H1 can increase pericentromeric repression of PEV alleles of the white gene, consistent with centromeric accumulation of low abundance transgenic protein. Immunodetection of endogenous SUV39H1 in mammalian cells revealed that it localizes preferentially to heterochromatic foci and centromeric positions (Aagaard et al., 1999), and associates with M31 (HP1b), a mammalian form of Drosophila HP1. In transgenic mice, expression of the SUV39H1 during embryogenesis is highest in fetal liver, with 35% of cells overexpressing, suggesting a partial penetrance because the SUV39H1 transgene expression may be influenced by a position effect (S.Czvitkovich and T.Jenuwein, unpublished). Forced expression of SUV39H1 leads to abundant association with nuclear chromatin and redistribution of endogenous heterochromatic protein M31 (Melcher et al., 2000), suggesting a possible dominant-negative function for the SUV39H1 transgene. High levels of transgenic SUV39H1 protein should therefore reduce PEV and lead to a larger proportion of human β globin expressing cells in the Δ2 PEV lines. Thus, SUV39H1 overexpressing mice (3-fold greater overexpression when compared with the endogenous mouse Suv39h1) were crossed with ΔHS2 lines and line 72. This resulted in modification of the PEV observed in the Δ2C line, but had no effect on human β globin gene expression in line Δ2B or 72 (Table I; Figure 2A). In line Δ2C, a clear modification of PEV was observed (from 4 to 14%). This is in agreement with a heterochromatin destabilization induced by a destabilization of M31 (Melcher et al., 2000). Reminiscent with the mosaic expression of the SUV39H1 transgene, the PEV modification observed in Δ2C was only found in 33% of the pups analysed. The penetrance variation of SUV39H1 observed in erythroid cells may also take place in precursor haematopoietic cells or other cells during embryogenesis, and leads to a variation of PEV in only 33% of the pups analysed. The same result was obtained with mice from different backgrounds (B10/CBA, FVB, 129, B57/BL10, data not shown). SUV39H1 overexpression had a different degree of PEV modification in Δ2B and Δ2C, which is probably related to the site of integration of the globin locus in each of these lines.
Table I. Number of human β globin expressing cells.
| WT (%) | EKLF tg (%) | EKLF+/– (%) | Sp1 tg (%) | Sp1+/– (%) | M33+/– (%) | BMI-1 tg (%) | BMI-1+/– (%) | SUV39H1tg (%) | |
|---|---|---|---|---|---|---|---|---|---|
| Ln72 | 85.5 ± 1.1 | 91 ± 1.0 | 61.4 ± 0.1 | 85.3 ± 0.9 | 85 ± 0.7 | 84.9 ± 1.2 | 85.2 ± 0.1 | 84.8 ± 1.1 | 84.9 ± 1.2 |
| Ln2 | 83 ± 2.1 | ND | 62.9 ± 1.1 | 83.3 ± 1.8 | 83.1 ± 1.6 | 84 ± 0.9 | ND | 83.9 ± 0.5 | ND |
| Δ2B | 25.2 ± 0.8 | 43.5 ± 1.2 | 0.3 ± 0.5 | 36.7 ± 1.0 | 0.1 ± 0.3 | 59.7 ± 0.9 | 24.9 ± 0.9 | 37.4 ± 1.2 | 25.1 ± 0.5 |
| Δ2C | 4 ± 1.0 | 11.3 ± 1.1 | 0.7 ± 0.1 | 5.9 ± 0.2 | 0.5 ± 0.2 | 12.7 ± 0.6 | 4.2 ± 0.6 | 9.1 ± 0.3 | 14 ± 1.0 |
WT, wild type; tg, transgenic; and +/–, heterozygote knockout. ND, not done (see Materials and methods, RNA-FISH for description).

Fig. 2. (A) Histograms of the S1 nuclease protection assays. The percentage of human β globin RNA was compared with the mouse α globin RNA in 14.5 day fetal livers. For each cross, the S1 nuclease protection was carried out on at least two fetal livers. The level of human β globin transcription was determined for each of the lines 72, Δ2B and Δ2C after crossing to different background mice. WT, wild-type background (B10/CBA); EKLFtg, overexpressed EKLF background; EKLF+/–, EKLF heterozygote knockout background; Sp1tg, overexpressed Sp1 background; Sp1+/–, Sp1 heterozygote knockout background; M33+/–, M33 heterozygote knockout background; BMI-1tg, overexpressed BMI-1 background; BMI-1+/–, BMI-1 heterozygote knockout background; SUV39H1tg, overexpressed SUV39H1 background. (B) S1 nuclease protection assay. The expression of the human γ genes was compared with the human β globin gene in 14.5 day fetal livers where the control transgenic line 72 and the PEV line Δ2B were in wild-type background (WT), in overexpressed EKLF background (EKLFtg), and in EKLF heterozygote knockout background (EKLF+/–). Note that the amount of RNA loaded on the gel has been adjusted to obtain the same β globin signal in each lane. (C) Ratio of human γ globin expression compared with human β globin expression in 14.5 day fetal livers obtained by S1 nuclease protection assay. For each cross, RNA from two different fetal livers was tested.
Polycomb group proteins BMI-1 and M33
In metaphase, a number of proteins implicated in gene repression and/or heterochromatin formation co-localize with centromeric regions (Csink and Henikoff, 1998). Interestingly, a fraction of the mammalian Pc-G proteins BMI-1 and M33 also localizes to centromeric regions in metaphase (Saurin et al., 1998). Mutations of these genes leads to deregulation of HOX gene expression and developmental aberrations (van der Lugt et al., 1994; Core et al., 1997). Thus, these Pc-G proteins are suggested to be directly involved in the repression of certain HOX genes. Their potential role in mammalian PEV has not yet been tested. In Drosophila, the homologues of M33 and BMI-1 (Polycomb and Posterior sex combs, respectively) do not influence PEV, but other Pc-G proteins do influence PEV (Sinclair et al., 1998). The difference in the effects of the different PcG proteins is currently not clear and our data indicate that the mammalian homologues may have different properties.
Since M33 and BMI-1 can localize to centromeric regions, we tested whether they have an effect on pericentromeric PEV in mammals. A change in the concentration of these Pc-G members did not affect the expression of the human β globin gene either in the wild-type (wt) line 72, or in line 2 that has pericentromeric integration (Table I; Figure 2A). In contrast, a decrease of BMI-1 in the BMI-1+/– heterozygote, but not an increase in the BMI-1 transgenic background, affected the PEV in lines Δ2B and Δ2C (Table I; Figure 2A). RNA-FISH showed that the number of erythroid cells transcribing the human β globin gene in a BMI-1+/– background increased from 25.2 to 37.4% in Δ2B and from 4 to 9.1% in Δ2C. Similar changes in PEV were observed when ΔHS2 mice were crossed with heterozygous M33+/– mice (Table I; Figure 2A). The increase of γ globin transcription in a BMI-1+/– or M33+/– background was twice that observed for the β globin gene in the PEV line Δ2B (Figure 2C). These results prove for the first time that Pc-G proteins such as M33 and BMI-1 can influence PEV expression in mammals.
In Drosophila, the homologue of M33 and BMI-1 (Polycomb and Posterior sex combs, respectively) do not influence PEV. However, other Drosophila Pc-G proteins do influence PEV. The reason why some Pc-G proteins influence PEV and others do not is still debated and unclear. The centromeric localization of M33 and BMI-1 and their influence on PEV may indicate that these mammalian Pc-G proteins play a role in the stability of centromeric chromatin.
Transcriptional activators Sp1 and EKLF
It is thought that PEV results in a competition between suppressive chromatin proteins [such as the SU(VAR) or the Pc-G proteins described above] and activating proteins. This competitive ability would be dependent on their relative concentrations and our results showed that a change in the concentration of suppressive proteins does lead to a change in the number of cells that are able to activate the locus. Previous characterizations of enhancing sequences from the human β globin locus revealed that mutations or modifications of these elements can enhance β globin gene silencing (Ellis et al., 1993, 1996; Milot et al., 1996; Gillemans et al., 1998; Guy et al., 1998; Francastel et al., 1999). It was also observed that modification of the LCR integrity or its orientation, and mutation in HS2 when taken out of the LCR context can drastically decrease the expression level of linked genes without modification of the chromatin structure (Milot et al., 1996; Francastel et al., 1999; Alami et al., 2000). Thus, the direct influence of the integrity of enhancing sequences and the indirect influence of transcription factors on chromatin configuration has yet to be verified. We therefore tested directly two activating transcription factors potentially involved in chromatin modification, Sp1 and EKLF.
Mutation of Sp1 homologues in Drosophila (btd) results in a number of developmental defects (Schock et al., 1999), and mice deficient for Sp1 die in utero but show no defect in β globin gene expression (Marin et al., 1997). The latter observation is in agreement with a binding site alteration study that shows that EKLF, but not Sp1 actively binds to the LCR in vivo (Gillemans et al., 1998), leading to an increase in DNase I hypersensitivity of HS3. Those data could only be obtained from early embryos (due to the early lethality) and it remains possible that Sp1 is important for the regulation of the β globin locus at later stages. Alternatively, it is possible that it could play a role when the locus is present in a restrictive chromatin environment different from its normal position, which is at a distance from the centromere.
Sp1–/– and Sp1+/– mice do show a decrease in the expression of MeCP2, a repressive factor that binds to methylated DNA such as that found in centromeric regions (Nan et al., 1997). As a result, a decrease in the concentration of Sp1 could lead to a less repressive chromatin structure, and consequently to an increase in the number of expressing cells in the PEV lines. Alternatively, it is known that Sp1 is able to recruit a chromatin-modifying complex and concomitant activating effect. The lipoprotein receptor gene is only fully activated in vitro when Sp1 acts synergistically with a multiprotein coactivator complex containing the histone acetyl-transferase CBP (Naar et al., 1998). Although this association has not been described in vivo, the interaction of Sp1 with remodelling complexes could result in an increase in the number of cells expressing the β globin transgene when the levels of Sp1 increase in the restrictive chromatin environment of the ΔHS2 mice.
Similar to the experiments described above, the wt line 72, wt line 2 and ΔHS2 lines were crossed with mice that overexpress Sp1 2.3-fold as part of a β globin LCR cassette, or that have a reduced amount of Sp1 through homologous recombination (Sp1+/–) (Marin et al., 1997).
Not surprisingly, crossing wt line 72 with Sp1 transgenic or Sp1+/– mice left the expression of the human β globin transgene practically unchanged (Figure 2A; Table I). Crossing also had no effect on the expression pattern of pericentromerically integrated wt line 2. However, crossing PEV lines Δ2B and Δ2C with Sp1 transgenic mice showed that an increase of the concentration of Sp1 results in a greater number of erythroid cells transcribing the human β globin transgene (25.2–66.7% in Δ2B and 4–5.9% in Δ2C, Table I; Figure 3). Conversely, human β globin gene transcription was detected in <1% of the cells when Δ2B or Δ2C were crossed with Sp1+/– mice. These RNA-FISH results (Table I and Figure 3) were confirmed by S1 nuclease protection analysis (Figure 2A). Variation of Sp1 concentration also modulates γ globin gene expression in the PEV line Δ2B (Figure 2C). Thus, an increase or decrease in the concentration of Sp1 results in an increase or decrease in the number of cells that transcribe the human β globin when the LCR is defective and challenged by heterochromatin conformation in the PEV lines, but not in the control lines 2 and 72, which contain a complete LCR.

Fig. 3. Representative examples of Δ2B RNA-FISH detection. The mouse α globin transcripts are detected by FITC (green fluorescence) and the human β globin gene primary transcripts and mRNA are detected by texas-Red (red fluorescence). Δ2B in wild-type background, EKLF transgenic background, EKLF+/– background, Sp1 transgenic background, and in Sp1+/– background.
We then tested the effect of EKLF, which binds to HS3 of the LCR in vivo, thereby modulating chromatin accessibility (Wijgerde et al., 1996; Gillemans et al., 1998). Lines Δ2B and Δ2C, which contain a complete HS3, and wt line 2 and line 72 were crossed with mice that overexpress EKLF 2- to 3-fold in the erythroid lineage (Tewari et al., 1998), or with heterozygous EKLF knockout mice (EKLF+/–) expressing half the amount of EKLF (Nuez et al., 1995). Erythroid cells from 13.5 and 14.5 day fetal livers were isolated and analysed for the expression of the human β globin gene. RNA-FISH of the human β globin gene was performed to determine the effect of EKLF on variegated expression using mouse α globin RNA as an internal control (Wijgerde et al., 1996). S1 nuclease protection assays were also carried out to determine the levels of human γ- and β-globin gene expression in comparison with mouse α globin gene (Wijgerde et al., 1996).
The effect of variation in the concentration of EKLF on the wt transgenic locus was as observed previously (Wijgerde et al., 1996). An increase or decrease in the concentration of EKLF has very little effect on the number of cells expressing human globin but alters the balance of human γ- and β-globin gene expression due to the different binding affinities of EKLF for the CACCC boxes in the respective promoters (Nuez et al., 1995; Perkins et al., 1996; Bieker et al., 1998). This effect was visualized by an increase in the number of cells with a human β globin gene transcription signal, as determined by RNA-FISH (Table I), and the levels of β globin RNA, as determined by S1 nuclease protection (Figure 2A). As expected, the increase of human β globin gene RNA was accompanied by a decrease in the levels of γ globin gene RNA (Figure 2B and C), but the total output and the number of expressing cells remained constant (Wijgerde et al., 1996). When the PEV lines Δ2B and Δ2C were crossed with the same EKLF mice, a very pronounced effect was observed. An increase in the concentration of EKLF led to an increase in the number of cells expressing the β globin gene (from 25.2 to 43.5% in Δ2B and 4 to 11.3% in Δ2C; Table I; Figure 3), but the expression was almost completely lost when the concentration of EKLF was lowered (25.2–0.3% in Δ2B and 4–0.7% in Δ2C; Table I; Figure 3). The number of cells transcribing the human β globin gene was also reflected by the total amount of human β globin RNA, as shown by S1 nuclease protection assay (Figure 2A). Unlike what was observed in line 72, in the PEV line Δ2B, the expression of human γ globin is increased (rather than decreased) with an increase in the EKLF concentration (Figure 2B) (Δ2C was not tested). The increase in γ gene expression is even greater than the increase in β gene expression (Figure 2C). When the concentration of EKLF was reduced in the EKLF+/– mice, the expression of both γ and β genes was lost, and coincided with a loss of DNase I hypersensitivity and sensitivity (see below). Thus, the number of erythroid cells transcribing the human β globin locus was dependent on the concentration of EKLF. Since the LCR but not the γ globin gene promoter is dependent on EKLF, we conclude that the binding of EKLF directly activates the β globin locus through the LCR and competes with the process of restrictive chromatin formation.
The effect of a variation of the concentration EKLF on PEV is very similar to that observed with Sp1, even though it appears that Sp1, unlike EKLF, has no direct effect on the LCR (Marin et al., 1997; Gillemans et al., 1998). It is therefore not clear whether the effect of Sp1 takes place through binding of this factor to sites inside or outside the locus in the PEV mice. One possibility is that Sp1 would affect the level of EKLF resulting in a similar effect. We therefore re-analysed the Sp1 heterozygous mice, which showed that the level of EKLF RNA had dropped by 20% (Figure 4). This would (at least in part) explain the effect of Sp1 on PEV. However, it would also be expected that the balance of γ over β expression should change to some extent in line 72. Additional S1 analysis showed that there is some increase in the level of γ over β in the Sp1 heterozygous mice, but the difference is too small (∼50%) to be significant. Similar differences can also be observed within the same litter because individual embryos can differ by up to half a day of development.
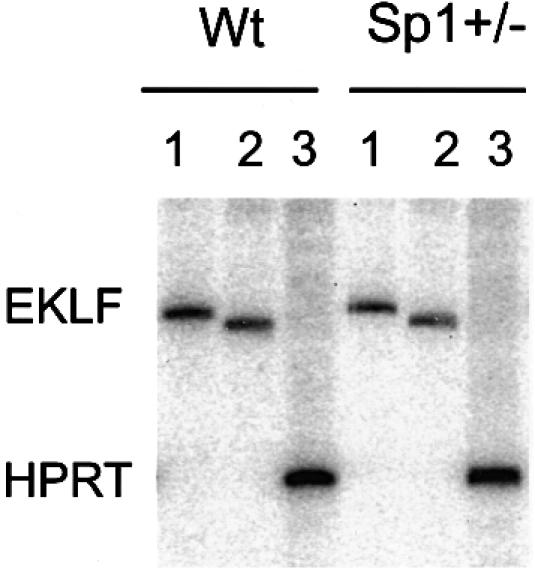
Fig. 4. Semi-quantitative RT–PCR analysis on RNA of wild-type (Wt) and Sp1+/– 14.5 day embyros as described previously (Marin et al., 1997). Primer combinations used are as follows: lane 1 = 5′-EKLF region (forward 5′-CCCTTCCGGAGAGGACGAT-3′; reverse 5′-CCTATGGGCTGCTGTCGGGATAC-3′); lane 2 = 3′-EKLF region (forward 5′-GGCTTGTCCCCGGGAACTGCG-3′; reverse 5′-ACCTAAGAGGCAGGCGGC-3′); and lane 3 = HPRT control (Marin et al., 1997).
Chromatin structure and PEV modulation
To determine whether the variation in PEV reflects a change in chromatin structure, nuclease hypersensitivity and sensitivity assays were carried out on the normal lines 72 and Δ2B and in an EKLF+/– background using a novel PCR-based DNase I method developed for small amounts of tissue, or for the detection of changes when only a small proportion of cells is affected as can be the case in PEV (see Materials and methods). The method was validated by comparing this method to a regular DNase I assay (A.van den Wijngaard, manuscript in preparation) and the EKLF cross was selected for this analysis since EKLF is the only factor tested in this study that is known to bind directly to the locus affecing β globin gene expression.
As the standard we used the Zfp37 (Mazarakis et al., 1996) promoter region, which is mildly sensitive to DNase I in erythroid cells (Figure 5A and B; the Zfp37 sensitivity was used to normalize the accessibility of the globin loci). As a positive control we used the accessibility to DNase I of the mouse β major globin gene promoter (Figure 4B), which contains an EKLF binding site and is hypersensitive to DNase I in erythroid cells. The data show that the sensitivity of the mouse β major gene promoter is greater than that of ZFP and does not change in the different backgrounds. The latter was expected due to the fact that all of the cells express the gene in all of the crosses (Figure 5C) and that the gene does not have fetal competitor genes like the human γ genes (Wijgerde et al., 1996).

Fig. 5. DNase I accessibility verified by DNase I-PCR method. Y-axis: an increase in the relative amount of PCR product (normalized to Zfp37 for each DNase I concentration), reflects a decrease in DNase I sensitivity; X-axis: increasing DNase I concentration (see Materials and methods). For all PCR product sizes see Materials and methods. (A) The limit PCR product series of the human β globin promoter relative to the Zfp37 promoter. The β globin product is 163 bp, the Zfp product is 149 bp. (B) Zfp37 promoter region (note that the Y-axis in this and following plots represents the amount of PCR product relative to the amount of Zfp37 PCR product at the lowest DNase I concentration). (C) Mouse β major promoter region relative to Zfp37, the mouse β globin PCR fragment (see Materials and methods). (D) Human β globin promoter region. (E) Human δ globin gene promoter. (F and G) The ψβ region of the human locus (only the high DNase concentrations are shown). The black lines represent the DNase I sensitivity of the different regions of the mouse or human loci in line 72 wild type; in red are the results for line 72 EKLF+/–; in yellow are the results for Δ2B wild type; in blue are the results for Δ2B EKLF+/–.
Line 72 in a wild-type background is more sensitive than in an EKLF+/– background (Figure 4C, black line versus red line). This result was expected since previous studies have shown that EKLF is important for the formation of the hypersensitive site located in the promoter region of the human β globin gene (Wijgerde et al., 1996). At this stage of development, the human β globin gene is (unlike the mouse β globin gene) in competition with the γ globin gene and its expression decreases in an EKLF+/– background (Wijgerde et al., 1996).
The hypersensitivity of the β globin promoter in the Δ2B locus in a wild-type background was decreased when compared with the line 72 locus, as only 25% of the cells are active (Figure 5D, black line versus yellow). A decrease in the concentration of EKLF (only 0.3% of the cells express) leads to a further decrease in sensitivity (yellow line versus blue). This result was perhaps expected, as the hypersensitive site in the β globin promoter is dependent on the EKLF binding site present in that region and it is required for efficient expression. We also checked the δ globin promoter, which does not contain an EKLF binding site. It showed an increase in DNase I sensitivity for the normal locus (Figure 5E, black line versus red) in the EKLF+/– background. This is explained by the fact that the δ promoter does not have a functional EKLF binding CACCC box and would therefore have a competitive advantage when compared to the β promoter in an EKLF+/– background. The Δ2B δ promoter shows a decrease (Figure 5E, yellow line versus blue) in the EKLF+/– background since fewer cells express. We also analysed the changes in LCR chromatin structure by following one of the hypersensitive sites (HS4). This site shows the same pattern of changes as the β globin promoter (data not shown).
These data and the transcription results which show that a decrease in EKLF results normally in an increase in γ and a decrease in β transcription (due to γ versus β gene competition) (Wijgerde et al., 1996), while both γ and β decrease in Δ2B, strongly suggest that the changes we observed are primarily caused by the effects of EKLF binding to the LCR. This implies that the LCR is not only directly responsible for the activation of the genes, but that it also regulates DNase I sensitivity in the locus. We therefore checked two points of general DNase I sensitivity in the locus, the promoter of the ε globin gene (not shown) and the ψβ region of the locus (Figure 5F). Since general DNase I sensitivity is measured at higher DNase I concentrations, it is normal that these areas show a very similar sensitivity to the ZFP37 standard at low concentrations of DNase I (Figure 4E). However at higher concentrations of DNase I, the accessibility to the nuclease decreases in the Δ2 lines (Figure 5F, yellow and blue lines, and G) with the largest decrease in the EKLF+/– background (Figure 5F, blue line; the ε gene shows the same results). Thus these results confirm that the concentration of EKLF affects the overall accessibility of the locus in the Δ2 loci.
Discussion
As recently reported for M31 by Festenstein et al. (1999), the results presented in this article confirm that mammalian PEV can be modified by heterochromatic protein. Here the Suvar protein SUV39H1, which can delocalize M31 when overexpressed (Melcher et al., 2000), induces a variation of Δ2C PEV. In addition, this study provides the first evidence that a variation in the concentration of certain Pc-G proteins, such as BMI-1 and M33, or transcription factors (EKLF and Sp1) can influence mammalian PEV, and that a change in concentration, at least in the case of EKLF, affects chromatin configuration.
The results of the SUVAR protein SUV39H1 and the Pc-G proteins BMI-1 and M33 clearly indicate that chromatin modifiers can influence mammalian PEV. An increase in the number of cells transcribing in Δ2C-SUV39H1 is contrary to what would be predicted, considering that the overexpression of a PEV suppresser in Drosophila results in a decrease of the number of expressing cells (Aagaard et al., 1999). However, overexpression of SUV39H1 induces a more general chromosomal localization, which is no longer restricted to heterochromatin (Melcher et al., 2000). This suggests that it has a dominant-negative effect by destabilizing and delocalizing other heterochromatin modifier(s) (M31), resulting in activation rather than a suppressing effect. Unlike BMI-1 and M33, overexpression of SUV39H1 affects human β globin gene expression in the line Δ2C but not Δ2B, suggesting a difference in chromatin conformation at the integration site in the two PEV lines.
The Drosophila homologues of M33 and BMI-1 (Polycomb and Posterior sex combs) are not known to influence PEV in this organism, while other Drosophila Pc-G do influence PEV. However, the fact that BMI-1 and M33 localize to the centromere at particular stages of the cell cycle, similar to certain mouse heterochromatin-related proteins (Wreggett et al., 1994; Aagaard et al., 2000), prompted us to test the potential effect of M33 and BMI-1 on mammalian PEV.
As in HOX gene regulation (van der Lugt et al., 1994; Core et al., 1997), a decrease in the concentration of BMI-1 and M33 appears to result in a failure to maintain an established transcriptional repressive state through lack of sufficient protein levels. It is presently not clear why a BMI-1+/– background does affect Δ2B and Δ2C PEV whereas the BMI-1 transgenic background does not. In erythroid cells, the level of expression of the BMI-1 transgene might not be sufficient to modulate the PEV, or there may be an upper threshold to the amount of BMI-I that can be incorporated within a repressive chromatin structure.
Together, the influences of the chromatin modifiers observed in this study indicate that the heterochromatic protein SUV39H1 (and indirectly M31), and the Pc-G proteins BMI-1 and M33 can influence mammalian PEV. Mammalian PEV therefore appears to be the result of a variable degree of invasion of repressive chromatin structure into the locus.
Much like that observed in yeast telomeric silencing (Aparicio and Gottschling, 1994), the variation of transcription factor concentration can modify mammalian PEV. Here we showed that the variation of Sp1 concentration affects β globin transcription in a repressive chromatin context, and in the opposite way to that expected from its effect on MeCP2 expression (Marin et al., 1997), but in agreement with its function as a transactivating transcription factor. However, inactivation of the Sp1 gene indicated that Sp1 does not act on the β locus (Marin et al., 1997), although the mice die too early during development to obtain data for this stage of development. Nevertheless, these data suggest that the effect of Sp1 would be indirect and analysis of the Sp1 mice show that the level of EKLF is affected by Sp1.
EKLF binds to the LCR and the β gene, but not the γ genes (or the promoter of the δ gene). Nevertheless, we observed that in a restrictive chromatin context, a change in EKLF concentration has a greater effect on the γ than the β gene (Figure 2B and C). Thus, in the heterochromatic context, chromatin activation mediated by the binding of EKLF in the β gene promoter region appears to be less important than the effect mediated by EKLF binding in the LCR. This chromatin modulating activity of the LCR is more pronounced on a proximal gene (γ genes) than a distal gene (β gene). The additional change in general DNase I sensitivity associated with a change of EKLF concentration suggests that the EKLF binding to the LCR regulates the accessibility throughout the locus (Figure 5).
In summary, this study shows that mammalian PEV is the result of equilibrium between chromatin activating and suppressing factors that determine local chromatin organization. The combination of factors influencing PEV is different at different sites in the genome. Importantly, these results provide evidence that the human LCR has a dominant role in the local regulation of chromatin structure and it efficiently counteracts the suppressive effects of chromatin-associated proteins. The LCR would establish or maintain an open chromatin conformation set during development prior to the physiological activation of the locus (Vassilopoulos et al., 1999). It is presently not known at which stage during development and differentiation of the erythroid cells the clonally inherited expression pattern in lines Δ2B and Δ2C is set. However, the overexpression of EKLF and Sp1 are driven by a late expressing globin erythroid-specific cassette (Gillemans et al., 1998; Tewari et al., 1998), suggesting that the PEV equilibrium is set or can at least be modified late during haematopoietic differentiation, close to the time that the globin genes are normally activated. These results are in agreement with refined PEV models (Henikoff, 1996; Locke et al., 1988; Grosveld, 1999), which propose that activation and repression is dependent on the number of binding sites in the LCR and the concentration of cognate activating proteins on the one hand and chromatin-bound suppressive proteins on the other.
Materials and methods
Fiber-FISH
For the transgenic lines 2, 72, Δ2B and Δ2C, stretched chromatin fibres were prepared (Collas et al., 1999) and probed with digoxigenin-labelled γ satellite repeat sequence and biotinylated LCRε and Cos28 (Strouboulis et al., 1992).
Mouse γ satellite and cosmid probes, LCRε and Cos28, were used for the double detection of the centromeric satellite repeats and the complete 70 kb region of the β globin locus. The human β globin locus was detected by avidin–Texas red (red signals) and the γ satellite repeats by fluorescein isothiocyanate (FITC) (green signals). Slides were examined using a Leica DM microscope equipped with a single bandpass filter for fluorescein, Texas red and DAPI, a dual bandpass filter for fluorescein and Texas red, and 40× and 100× oil objectives with a 1.3 numerical aperture. Digital images were obtained with a cooled, charged coupled device (CCD) camera and processed using Adobe PhotoShop 4.0. To decrease the green signal intensity, the images of the partially stretch fibres were prepared with a variation of the exposition time between the green and the red signal.
RNA-FISH
The RNA-FISH on 13.5 day fetal liver cells of the human β globin transgenic mice with different backgrounds was performed as described previously (Milot et al., 1996; Dillon et al., 1997; Gribnau et al., 1998). The oligomers used for the detection of the human β globin RNA covered the 3′ end of the first exon, part of intron 1 and the 5′ end of the second exon of the human β gene (Gribnau et al., 1998). This region is not included in the construct used to create both EKLF and Sp1 transgenic mice. The oligomers used for the detection of the mouse α globin RNA were described previously (Gribnau et al., 1998). The percentage of erythroid cells transcribing the human β globin gene was established by double RNA-FISH detection of the human β globin gene transcripts and the mouse α globin gene transcripts. The standard deviations (Table I) are indicated under each percentage. The variation of PEV in Δ2C/SUV39H1 was observed in 33% of fetal livers analysed. The standard deviations correspond to the variation observed in these 33% with a variation of PEV. Line 2, line 72 and Δ 2C have one copy of the transgene, and Δ2B has three copies (Milot et al., 1996). The overexpression of EKLF (EKLF tg) is of 2- to 3-fold (Tewari et al., 1998), of Sp1 (Sp1 tg) is of 2.3-fold (Gillemans et al., 1998), of BMI-1 (BMI-1 tg) is of at least 5-fold (Alkema et al., 1995; M.van Lohuizen, unpublished) and the overexpression of SUV39H1 is 3-fold (compared with the endogenous suv39h1; T.Jenuwein unpublished).
S1 nuclease protection assay
RNA was isolated from 14.5 day fetal livers of human β globin transgenic mice with different backgrounds. S1 nuclease protection analyses were done with 5′ end-labelled probes. The procedure and the probes used were as described previously (Strouboulis et al., 1992).
DNase 1 PCR assay
In order to determine the presence or absence of DNase I (hyper)sensitive sites in the human β globin locus, a PCR-based strategy was employed.
Nuclei were isolated from 13.5 day fetal liver cells. The DNase I digestion was as described previously (Wijgerde et al., 1996). After DNase I treatment, the DNA was extracted and diluted to ∼10 ng/µl. Radioactive PCR was performed on 10 ng of DNA in a final 25 µl reaction mixture containing 1.5 mM MgCl2, 10 mM Tris pH 8.3, 0.2 mM of each dNTPs, 0.5 pmol of each primer, 0.02 µCi [α-32P]Taq polymerase. To verify that each PCR contained an equal amount of DNA template, we included Zfp37 primers in addition to the primers detecting the hypersensitive sites. None of the primer combinations used in the multiplex PCR cross-hybridized or unevenly competed for PCR reagents (data not shown). Each multiplex PCR was checked for linear amplification. Primer sets were: mouse β major promoter (forward 5′-CAGTGAGTGGCACAGCATCC-3′; reverse 5′-CAGTCAGGTGCACCATGATGT-3′), human β promoter (forward 5′-GGCTGTCATCACTTAGACCTC-3′; reverse 5′-GGTTGCTAG TGAACACAGTTG-3′), human δ promoter (forward 5′-GGGCAA GTTAAGGGAATAGTGG-3′; reverse 5′-GTGTCTGTTTGAGGTTGC TAGTGA-3′); Zfp37 promoter (forward 5′-TTACTTAGAAGGAAT GGGAGCAGCT-3′; reverse 5′-ACTTGAGAAAGAAGGGATTG CAGT-3′); ψβ (forward 5′-ACAACCCACCCTTGACCAA-3′; reverse 5′-TCCTGGTGATCACAGATGAGC-3′); ε-globin promoter (forward 5′-TGTCCATCCATCACTGCTGAC-3′; reverse 5′-TGATTGCAGCTG TGTCGGA-3′); HS4 (forward 5′-TGGCATCTAGCGCAATGACTT-3′; reverse 5′-GGGCAAGCCATCTCATAGCTG-3′). Band intensity was quantitated by phosphoimager analysis and normalized to the signal obtained for Zfp37 in each reaction. The ratio (hyper)sensitve/non-sensitive signal was set to one for DNase I untreated DNA. The results were plotted using Microsoft Excel: y-axis, relative amount of PCR product (in the Zfp37 graph absolute quantities), i.e. decreasing DNase I sensitivity; x-axis, increasing DNase I concentration. Each reaction was carried out in triplicate and corrected for fragment length. Fragment sizes were: Zfp, 149 bp; mouse β, 226 bp; human β, 163 bp; human δ, 192 bp; human ψβ, 170 bp; human ε, 180 bp; human γ, 193 bp; human HS4, 197 bp.
Acknowledgments
Acknowledgements
We thank J.Gribnau for helpful discussion, J.Strouboulis, S.Bottardi and W.de Laat for critical review of the manuscript, and our colleagues in the animal facility for animal care. E.M. was a recipient of a Canadian MRC fellowship. This work was supported by grants from the NWO and the EC to F.G.
References
- Aagaard L. et al. (1999) Functional mammalian homologues of the Drosophila PEV-modifier Su(var)3-9 encode centromere-associated proteins which complex with the heterochromatin component M31. EMBO J., 18, 1923–1938. [DOI] [PMC free article] [PubMed] [Google Scholar]
- Aagaard L., Schmid,M., Warburton,P. and Jenuwein,T. (2000) Mitotic phosphorylation of SUV39H1, a novel component of active centromeres, coincides with transient accumulation at mammalian centromeres. J. Cell Sci., 113, 817–829. [DOI] [PubMed] [Google Scholar]
- Alami R., Greally,J.M., Tanimoto,K., Hwang,S., Feng,Y.Q., Engel,J.D., Fiering,S. and Bouhassira,E.E. (2000) β-globin YAC transgenes exhibit uniform expression levels but position effect variegation in mice. Hum. Mol. Genet., 9, 631–636. [DOI] [PubMed] [Google Scholar]
- Alkema M.J., van der Lugt,N.M.T., Bobeldijk,R.C., Berns,A. and van Lohuizen,M. (1995) Transformation of axial skeleton due to overexpression of bmi-1 in transgenic mice. Nature, 374, 724–727. [DOI] [PubMed] [Google Scholar]
- Aparicio O.M. and Gottschling,D.E. (1994) Overcoming telomeric silencing: a trans-activator competes to establish gene expression in a cell cycle-dependent way. Genes Dev., 8, 1133–1146. [DOI] [PubMed] [Google Scholar]
- Armstrong J.A., Bieker,J.J. and Emerson,B.M. (1998) A SWI/SNF-related chromatin remodeling complex, E-RC1, is required for tissue-specific transcriptional regulation by EKLF in vitro. Cell, 95, 93–104. [DOI] [PubMed] [Google Scholar]
- Bieker J.J., Ouyang,L. and Chen,X. (1998) Transcriptional factors for specific globin genes. Ann. N Y Acad. Sci., 850, 64–69. [DOI] [PubMed] [Google Scholar]
- Boyer O., Zhao,J.C., Cohen,J.L., Depetris,D., Yagello,M., Lejeune,L., Bruel,S., Mattei,M.G. and Klatzmann,D. (1997) Position-dependent variegation of a CD4 minigene with targeted expression to mature CD4+ T cells. J. Immunol., 159, 3383–3390. [PubMed] [Google Scholar]
- Brown K.E., Guest,S.S., Smale,S.T., Hahm,K., Merkenschlager,M. and Fisher,A.G. (1997) Association of transcriptionally silent genes with Ikaros complexes at centromeric heterochromatin. Cell, 91, 845–854. [DOI] [PubMed] [Google Scholar]
- Cavalli G. and Paro,R. (1998) The Drosophila Fab-7 chromosomal element conveys epigenetic inheritance during mitosis and meiosis. Cell, 93, 505–518. [DOI] [PubMed] [Google Scholar]
- Collas P., Liang,M.R., Vincent,M. and Alestrom,P. (1999) Active transgenes in zebrafish are enriched in acetylated histone H4 and dynamically associate with RNA Pol II and splicing complexes. J. Cell Sci., 112, 1045–1054. [DOI] [PubMed] [Google Scholar]
- Core N., Bel,S., Gaunt,S.J., Aurrand-Lions,M., Pearce,J., Fisher,A. and Djabali,M. (1997) Altered cellular proliferation and mesoderm patterning in Polycomb-M33-deficient mice. Development, 124, 721–729. [DOI] [PubMed] [Google Scholar]
- Csink A.K. and Henikoff,S. (1996) Genetic modification of heterochromatic association and nuclear organization in Drosophila. Nature, 381, 529–531. [DOI] [PubMed] [Google Scholar]
- Csink A.K. and Henikoff,S. (1998) Something from nothing: the evolution and utility of satellite repeats. Trends Genet., 14, 200–204. [DOI] [PubMed] [Google Scholar]
- Dernburg A.F., Broman,K.W., Fung,J.C., Marshall,W.F., Philips,J., Agard,D.A. and Sedat,J.W. (1996) Perturbation of nuclear architecture by long-distance chromosome interactions. Cell, 85, 745–759. [DOI] [PubMed] [Google Scholar]
- Dillon N., Trimborn,T., Strouboulis,J., Fraser,P. and Grosveld,F. (1997) The effect of distance on long-range chromatin interactions. Mol. Cell, 1, 131–139. [DOI] [PubMed] [Google Scholar]
- Eissenberg J.C., Morris,G.D., Reuter,G. and Hartnett,T. (1992) The heterochromatin-associated protein HP-1 is an essential protein in Drosophila with dosage-dependent effects on position-effect variegation. Genetics, 131, 345–352. [DOI] [PMC free article] [PubMed] [Google Scholar]
- Ellis J., Talbot,D., Dillon,N. and Grosveld,F. (1993) Synthetic human β-globin 5′HS2 constructs function as locus control regions only in multicopy transgene concatamers. EMBO J., 12, 127–134. [DOI] [PMC free article] [PubMed] [Google Scholar]
- Ellis J., Tan-Un,K.C., Harper,A., Michalovich,D., Yannoutsos,N., Philipsen,S. and Grosveld,F. (1996) A dominant chromatin-opening activity in 5′ hypersensitive site 3 of the human β-globin locus control region. EMBO J., 15, 562–568. [PMC free article] [PubMed] [Google Scholar]
- Festenstein R., Tolaini,M., Corbella,P., Mamalaki,C., Parrington,J., Fox,M., Miliou,A., Jones,M. and Kioussis,D. (1996) Locus control region function and heterochromatin-induced position effect variegation. Science, 271, 1123–1125. [DOI] [PubMed] [Google Scholar]
- Festenstein R., Sharghi-Namini,S., Fox,M., Roderick,K., Tolaini,M., Norton,T., Saveliev,A., Kioussis,D. and Singh,P. (1999) Hetero chromatin protein 1 modifies mammalian PEV in a dose- and chromosomal-context-dependent manner. Nature Genet., 23, 457–461. [DOI] [PubMed] [Google Scholar]
- Francastel C., Walters,M.C., Groudine,M. and Martin,D.I. (1999) A functional enhancer suppresses silencing of a transgene and prevents its localization close to centromeric heterochromatin. Cell, 99, 259–269. [DOI] [PubMed] [Google Scholar]
- Gillemans N., Tewari,R., Lindeboom,F., Rottier,R., de Wit,T., Wijgerde,M., Grosveld,F. and Philipsen,S. (1998) Altered DNA-binding specificity mutants of EKLF and Sp1 show that EKLF is an activator of the β-globin locus control region in vivo. Genes Dev., 12, 2863–2873. [DOI] [PMC free article] [PubMed] [Google Scholar]
- Gribnau J., de Boer,E., Trimborn,T., Wijgerde,M., Milot,E., Grosveld,F. and Fraser,P. (1998) Chromatin interaction mechanism of transcrip tional control in vivo. EMBO J., 17, 6020–6027. [DOI] [PMC free article] [PubMed] [Google Scholar]
- Grosveld F. (1999) Activation by locus control regions? Curr. Opin. Genet. Dev., 9, 152–157. [DOI] [PubMed] [Google Scholar]
- Grosveld F., van Assendelft,G.B., Greaves,D.R. and Kollias,G. (1987) Position-independent, high-level expression of the human β-globin gene in transgenic mice. Cell, 51, 975–985. [DOI] [PubMed] [Google Scholar]
- Guy L.G., Kothary,R. and Wall,L. (1997) Position effects in mice carrying a lacZ transgene in cis with the β-globin LCR can be explained by a graded model. Nucleic Acids Res., 25, 4400–4407. [DOI] [PMC free article] [PubMed] [Google Scholar]
- Henikoff S. (1996) Position-effect-variegation in Drosophila: recent progress. In Russo,V.E.A., Martiensen,R.A. and Riggs,A.D. (eds), Epigenetic Mechanisms of Gene Regulation. Cold Spring Harbor Laboratory Press, Cold Spring Harbor, NY, pp. 319–334. [Google Scholar]
- Jenuwein T., Laible,G., Dorn,R. and Reuter,G. (1998) SET domain proteins modulate chromatin domains in eu- and heterochromatin. Cell. Mol. Life Sci., 54, 80–93. [DOI] [PMC free article] [PubMed] [Google Scholar]
- Karpen G.H. (1994) Position-effect variegation and the new biology of heterochromatin. Curr. Opin. Genet. Dev., 4, 281–291. [DOI] [PubMed] [Google Scholar]
- Kioussis D. and Festenstein,R. (1997) Locus control regions: overcoming heterochromatin-induced gene inactivation in mammals. Curr. Opin. Genet. Dev., 7, 614–619. [DOI] [PubMed] [Google Scholar]
- Locke J., Kotarski,M.A. and Tartof,K.D. (1988) Dosage-dependent modifiers of position effect variegation in Drosophila and a mass action model that explains their effect. Genetics, 120, 181–198. [DOI] [PMC free article] [PubMed] [Google Scholar]
- Lyko F. and Paro,R. (1999) Chromosomal elements conferring epigenetic inheritance. BioEssays, 21, 824–832. [DOI] [PubMed] [Google Scholar]
- Marin M., Karis,A., Visser,P., Grosveld,F. and Philipsen,S. (1997) Transcription factor Sp1 is essential for early embryonic development but dispensable for cell growth and differentiation. Cell, 89, 619–628. [DOI] [PubMed] [Google Scholar]
- Mazarakis N., Michalovich,D., Karis,A., Grosveld,F. and Galjart,N. (1996) Zfp-37 is a member of the KRAB zinc finger gene family and is expressed in neurons of the developing and adult CNS. Genomics, 33, 247–257. [DOI] [PubMed] [Google Scholar]
- Melcher M., Schmid,M., Aagaard,L., Selenko,P., Laible,G. and Jenuwein,T. (2000) Structure–function analysis of SUV39H1 reveals a Dominant role in heterochromatin organisation, chromosome segregation and mitotic progression. Mol. Cell. Biol., 20, 3728–3741. [DOI] [PMC free article] [PubMed] [Google Scholar]
- Milot E. et al. (1996) Heterochromatin effects on the frequency and duration of LCR-mediated gene transcription. Cell, 87, 105–114. [DOI] [PubMed] [Google Scholar]
- Naar A.M., Beaurang,P.A., Robinson,K.M., Oliner,J.D., Avizonis,D., Scheek,S., Zwicker,J., Kadonaga,J.T. and Tjian,R. (1998) Chromatin, TAFs and a novel multiprotein coactivator are required for synergistic activation by Sp1 and SREBP-1a in vitro. Genes Dev., 12, 3020–3031. [DOI] [PMC free article] [PubMed] [Google Scholar]
- Nan X., Campoy,F.J. and Bird,A. (1997) MeCP2 is a transcriptional repressor with abundant binding sites in genomic chromatin. Cell, 88, 471–481. [DOI] [PubMed] [Google Scholar]
- Nuez B., Michalovich,D., Bygave,A., Ploemacher,R. and Grosveld,F. (1995) Defective haematopoiesis in fetal liver resulting from the inactivation of the EKLF gene. Nature, 375, 316–318. [DOI] [PubMed] [Google Scholar]
- Perkins A.C., Gaensler,K.M. and Orkin,S.H. (1996) Silencing of human fetal globin expression is impaired in the absence of the adult β-globin gene activator protein EKLF. Proc. Natl Acad. Sci. USA, 93, 12267–12271. [DOI] [PMC free article] [PubMed] [Google Scholar]
- Pirrotta V. (1997) PcG complexes and chromatin silencing. Curr. Opin. Genet. Dev., 7, 249–258. [DOI] [PubMed] [Google Scholar]
- Reuter G. and Spierer,P. (1992) Position effect variegation and chromatin proteins. BioEssays, 14, 605–612. [DOI] [PubMed] [Google Scholar]
- Robertson G., Garrick,D., Wu,W., Kearns,M., Martin,D. and Whitelaw,E. (1995) Position-dependent variegation of globin transgene expression in mice. Proc. Natl Acad. Sci. USA, 92, 5371–5375. [DOI] [PMC free article] [PubMed] [Google Scholar]
- Saurin A.J., Shiels,C., Williamson,J., Satijn,D.P., Otte,A.P., Sheer,D. and Freemont,P.S. (1998) The human polycomb group complex associates with pericentromeric heterochromatin to form a novel nuclear domain. J. Cell Biol., 142, 887–898. [DOI] [PMC free article] [PubMed] [Google Scholar]
- Schock F., Sauer,F., Jackle,H. and Purnell,B.A. (1999) Drosophila head segmentation factor buttonhead interacts with the same TATA box-binding protein-associated factors and in vivo DNA targets as human Sp1 but executes a different biological program. Proc. Natl Acad. Sci. USA, 96, 5061–5065. [DOI] [PMC free article] [PubMed] [Google Scholar]
- Sinclair D.A., Clegg,N.J., Antonchuk,J., Milne,T.A., Stankunas,K., Ruse,C., Grigliatti,T.A., Kassis,J.A. and Brock,H.W. (1998) Enhancer of Polycomb is a suppressor of position-effect- variegation in Drosophila melanogaster. Genetics, 148, 211–220. [DOI] [PMC free article] [PubMed] [Google Scholar]
- Strouboulis J., Dillon,N. and Grosveld,F. (1992) Developmental regulation of a complete 70-kb human β-globin locus in transgenic mice. Genes Dev., 6, 1857–1864. [DOI] [PubMed] [Google Scholar]
- Tewari R., Gillemans,N., Wijgerde,M., Nuez,B., von Lindern,M., Grosveld,F. and Philipsen,S. (1998) Erythroid Krüppel-like factor (EKLF) is active in primitive and definitive erythroid cells and is required for the function of 5′HS3 of the β-globin locus control region. EMBO J., 17, 2334–2341. [DOI] [PMC free article] [PubMed] [Google Scholar]
- Tschiersch B., Hofmann,A., Krauss,V., Dorn,R., Korge,G. and Reuter,G. (1994) The protein encoded by the Drosophila position-effect variegation suppressor gene Su(var)3-9 combines domains of antagonistic regulators of homeotic gene complexes. EMBO J., 13, 3822–3831. [DOI] [PMC free article] [PubMed] [Google Scholar]
- van der Lugt N.M. et al. (1994) Posterior transformation, neurological abnormalities and severe hematopoietic defects in mice with a targeted deletion of the bmi-1 proto-oncogene. Genes Dev., 8, 757–769. [DOI] [PubMed] [Google Scholar]
- van Lohuizen M. (1998) Functional analysis of mouse Polycomb group genes. Cell. Mol. Life Sci., 54, 71–79. [DOI] [PMC free article] [PubMed] [Google Scholar]
- Vassilopoulos G., Navas,P.A., Skarpidi,E., Peterson,K.R., Lowrey,C.H., Papayannopoulou,T. and Stamatoyannopoulos,G. (1999) Correct function of the locus control region may require passage through a nonerythroid cellular environment. Blood, 93, 703–712. [PubMed] [Google Scholar]
- Wijgerde M., Gribnau,J., Trimborn,T., Nuez,B., Philipsen,S., Grosveld,F. and Fraser,P. (1996) The role of EKLF in human β-globin gene competition. Genes Dev., 10, 2894–2902. [DOI] [PubMed] [Google Scholar]
- Wreggett K.A., Hil,F., James,P.S., Hutchings,A., Butcher,G.W. and Singh,P.B. (1994) A mammalian homologue of Drosophila heterochromatin protein 1 (HP1) is a component of constitutive heterochromatin. Cytogenet. Cell Genet., 66, 99–103. [DOI] [PubMed] [Google Scholar]