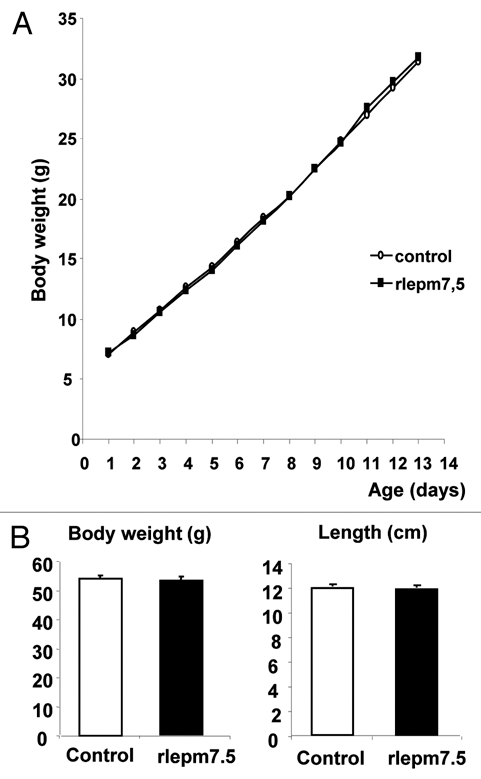
Figure 1.

Effect of neonatal treatment on general growth from birth to day 14 and on day 22. (A) Body weight curves of control and leptin antagonist-treated animals from d1 to d14. (B) The body weight (g) and length (cm) of control and leptin antagonist-treated animals at d22. Values represent the mean ± SEM, n = 8 per group.
