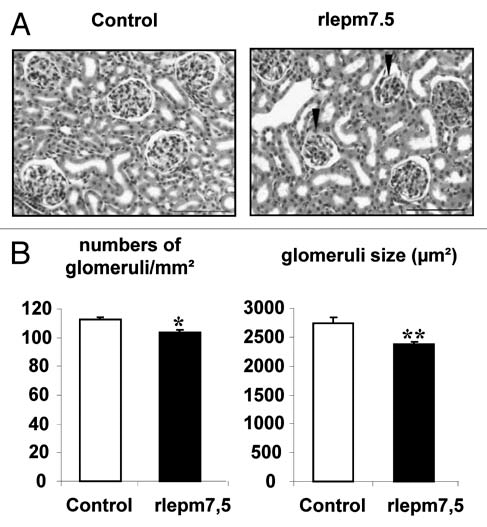
Figure 4.

Effect of neonatal treatment on the histological structure of the kidney. (A) Representative kidney sections from control and leptin antagonist-treated rats. Arrows indicate fetal glomeruli. Bars = 100 µm. (B) Density and size of glomeruli in the renal cortex of control and leptin antagonist-treated animals. Values represent the mean ± SEM, n = 8 per group. *p < 0.05, **p < 0.01 between control and rlepm7.5 animals.
