

Abstract
Predominant components in electro- or magneto-encephalography (EEG/MEG) are scalp projections of synchronized neuronal electrical activity distributed over cortical structures. Reconstruction of cortical sources underlying EEG/MEG can thus be achieved with the use of the cortical current density (CCD) model. We have developed a sparse electromagnetic source imaging method based on the CCD model, named as the variation-based cortical current density (VB-SCCD) algorithm, and have shown that it has much enhanced performance in reconstructing extended cortical sources in simulations (Ding, 2009). The present study aims to evaluate the performance of VB-SCCD, for the first time, using experimental data obtained from six participants. The results indicate that the VB-SCCD algorithm is able to successfully reveal spatially distributed cortical sources behind motor potentials induced by visually cued repetitive finger movements, and their dynamic patterns, with millisecond resolution. These findings of motor sources and cortical systems are supported by the physiological knowledge of motor control and evidence from various neuroimaging studies with similar experiments. Furthermore, our present results indicate the improvement of cortical source resolvability of VB-SCCD, as compared with two other classical algorithms. The proposed solver embedded in VB-SCCD is able to handle large-scale computational problems, which makes the use of high-density CCD models possible and, thus, reduces model misspecifications. The present results suggest that VB-SCCD provides high resolution source reconstruction capability and is a promising tool for studying complicated dynamic systems of brain activity for basic neuroscience and clinical neuropsychiatric research.
Keywords: Sparse electromagnetic source imaging, cortical current density model, EEG, VB-SCCD, motor potential, thresholding, large-scale computation
1. Introduction
Electromagnetic source imaging (ESI) technologies, i.e., moving from the electrode/sensor space to the source space using electro- and/or magneto-encephalography (EEG/MEG) signals, provide an estimate of spatial distributions of varying cortical brain activity at millisecond resolution (Nunez, 1995; Hamalainen et al., 1993). Developments of these technologies have recently been increasingly active (He et al., 1987; van Veen et al., 1997; Liu et al., 2002; Darvas et al., 2004; Phillips et al., 2005; Lin et al., 2006; Huang et al., 2006; Nagarajan et al., 2006; Ding et al., 2007) and they have widespread application in studying human brain functions and diseases (Flor et al., 1995; Elbert et al., 1995; Ebersole, 2000; Qin et al., 2004; Osipova et al., 2006; Jensen et al., 2007; Darvas et al., 2010; Liljestrom et al., 2009). Accurate reconstruction of intracranial brain activity underlying EEG/MEG is difficult because, mathematically, ESI is an ill-posed inverse problem which does not have a unique solution (Baillet et al., 2001; He, 2004). From the perspective of methodology, ESI technologies can be roughly classified into three types: methods based on spatial filter theory (van Veen et al., 1997); methods based on equivalent current dipole (ECD) source models (He et al., 1987); and methods based on distributed current density (DCD) source models (Hamalainen & IImoniemi, 1984; Dale & Sereno, 1993). Among them, methods based on the cortical current density (CCD) source model (one kind of DCD model) (Dale & Sereno, 1993) recently received considerable attentions (Liu et al., 2002; Darvas et al., 2004; Phillips et al., 2005; Lin et al., 2006; Huang et al., 2006; Darvas et al., 2010; Liljestrom et al., 2009). The advantage of CCD model is that it possesses a linear relationship between model parameters (to be estimated) and measured EEG/MEG signals, which allows inverse problems to be solved efficiently.
The set of linear equations describing the forward relationship between current sources and EEG/MEG measurements is, unfortunately, highly underdetermined (i.e., non-uniqueness) and its inverse solution is extremely sensitive to noise sources (i.e., ill-conditioning). These linear equations are usually solved by regularization schemes, such as various minimum norm estimate (MNE) methods using L2-norm (Hamalainen & IImoniemi, 1984; Pascual-Marqui et al., 1994; Liu et al., 1998). While L2-norm regularized MNE methods have been extensively used in localizing simple brain activity, its limitation appears as the low spatial resolution in their solutions (Hamalainen & IImoniemi, 1984; Pascual-Marqui et al., 1994). Thus, local brain activity maxima in L2-norm regularized MNE solutions were usually emphasized by thresholding spatially smeared cortical current density maps. Currently, several statistical methods (Barnes & Hillebrand, 2003; Pantazis et al., 2005) have been proposed to address the threshold issue. However, one of the problems to have smeared spatial reconstructions is that it will reduce the accuracy of localization as their detailed spatial structures are lost. In efforts to reconstruct distributed sparse (i.e., compact) brain sources, L1-norm regularized MNE methods have been explored (Wagner et al., 1998; Uutela et al., 1999; Ding & He, 2008). While L2-norm MNE methods produce over-smoothed inverse solutions, L1-norm MNE methods, as those reported above, produce over-focused inverse solutions, which usually only involves activity in a single element on the CCD model (Ding & He, 2008). Thus both L1- and L2-norm regularized MNE methods have their limitations in reconstructing spatially extended cortical sources and revealing their spatial structures on the cortical surface.
The performance of regularized L1/L2-norm MNE methods is also influenced by the size of source space, i.e., the number of elements in the CCD model. Most MNE methods, from early developments (Hamalainen & IImoniemi, 1984; Pascual-Marqui et al., 1994; Liu et al., 1998) to most recent advancements (Phillips et al., 2005; Lin et al., 2006; Huang et al., 2006; Daunizeau et al., 2006), have only be investigated with low-density CCD models (about 1,000 to 7000 elements). Since the human cortex is highly convoluted (i.e., sulci and gyri), the high-density element representation is necessary for the purpose of precise modeling (for example, a model with each element less than 6 mm2, which usually leads to total about or over 30,000 elements). The performance of regularized L1/L2-norm MNE methods need to be evaluated in such high-density models.
Recently, we developed a novel sparse ESI algorithm, i.e., the variation-based sparse cortical current density (VB-SCCD) method (Ding, 2009). The VB-SCCD method uses an L1-norm regularization scheme, which is similar to L1-norm regularized MNE methods. However, from the perspective of mathematical principle, VB-SCCD is different from both L1- and L2-norm regularized MNE methods since it utilizes the concept of sparse source imaging (Ding and He, 2008). The objective functions in sparse source imaging are defined to represent cortical current density maps with minimal non-zero coefficients (i.e., sparseness). The L1-norm regularization scheme is then used to reconstruct these non-zero coefficients in representation maps and, consequently, to recover cortical current density maps. The performance of the sparse ESI algorithm depends on the accuracy of sparse representations in representing cortical current density maps, the robustness of L1-norm regularization schemes, and the efficiency in combining those two. It has been studied mathematically that optimal inverse solutions are achievable if the number of sparse features to reconstruct does not exceed the number of measurements (Candes and Tao, 2005). In VB-SCCD, the variation map of cortical current density maps is used as the representation map to characterize the sparseness on boundaries between active cortical regions (i.e., source) and inactive cortical regions (i.e., non-source). Our preliminary simulation study (Ding, 2009) suggested that VB-SCCD provided much enhanced ability in estimating spatially extended cortical sources and in reconstructing their spatial extents, as compared with the weighted MNE method (wMNE) (Liu et al., 1998) and cortical low resolution electromagnetic tomography (cLORETA) (Wagner et al., 1996). Our simulation data further indicate improved suppression of background artifacts and reduced smoothness in reconstructed cortical current density maps as compared with two other methods.
The objective of the present study is to extend our previous simulation study to an experimental study on real data, and to assess the capability and performance of VB-SCCD in localizing brain sources behind motor potentials (MP) related to finger movements. The advantage of using MP(s) is that the locations of primary sensorimotor and associated motor cortical activity have been well described in the literature (Rizzolatti et al., 1998) with different imaging technologies, such as EEG (Urbano et al., 1998), MEG (Gerloff et al., 1998b), and functional magnetic resonance imaging (fMRI) (Jancke et al., 2000). This fact permits us to evaluate and validate solutions obtained from VB-SCCD. The performance of VB-SCCD on localizing brain sources behind MPs, recorded from a 96-electrodes EEG system, was further compared with wMNE and cLORETA as in our previous simulations (Ding, 2009).
2. Methods
A. Variation-Based Sparse Cortical Current Density (VB-SCCD) Algorithm
Given the CCD source model and boundary element volume conductor (see Section II.C on construction of both models), the forward relationship between current sources and EEG measurements can be expressed as , where the vector denotes the potentials at M electrodes; is a vector of N current dipole moments on the CCD model. is a vector of noises. A = (A1, A2, …, AN) is the so-called gain matrix (M × N) and N is usually much larger than M. The inverse problem is to reconstruct from , which has no unique solution and is highly ill-posed (Nunez, 1995; He, 2004). The inverse problem here is solved through three regularization schemes:
-
a)wMNE (Liu et al., 1998):
(1)
where β is the regularization parameter. Here, W is an N × N diagonal matrix with each diagonal element defined as to compensate the bias due to the source depth.
-
b)cLORETA (Wagner et al, 1996):
(2)
Here, L is the two-dimensional discrete spatial Laplacian operator defined over the cortical surface.
-
c)VB-SCCD (Ding, 2009):
(3)
where V is a matrix operator to get the variation map of cortical current density distributions. The variation vector is thus defined as . Each element in this variation vector represents a coefficient defined on a triangular edge in the CCD model and its value indicates the current density difference between two triangular elements sharing the same edge (see Ding, 2009 for details). If the cortical current density within each active cortical source is close to uniform or can be approximated with uniform distributions, non-zero coefficients are expected to largely happen on boundaries (the sparse features), and can be identified by minimizing the L1-norm of this variation vector. The new sparse ESI algorithm explores the sparseness in the transform domain (i.e. the variation map), instead of the original source domain, which only produce over-focused EEG inverse solutions (Wagner et al., 1998; Uutela et al., 1999; Ding and He, 2008).
We solved the optimization problems stated in (1), (2) and (3) using the second order cone programming (SOCP) technique (Nemirovski and Ben Tal, 2001; Ding and He, 2008) implemented in a MATLAB package named SeDuMi (Sturm, 2001). The regularization parameter β in all equations was estimated by applying the discrepancy principle (Morozov, 1966). We chose it so that the probability of , where , was small. When noises are Gaussian white, , wheres σ2 denotes the variance, had the χm distribution with m degrees of freedom, i.e. From this distribution, the upper bound for ∥n∥2 could be computed easily. In practice we selected β such that the confidence interval [0,β] integrated to a 0.99 probability (Ding and He, 2008). The variance σ2 was estimated as discussed in Section C.
B. Experimental Design and Data Acquisition
Six healthy right-handed human participants (age 22.7 ± 1.5, 3 males and 3 females) took part in the present study after informed consent was obtained according to UIC/IRB. Participants were seated comfortably in an armchair in a dimly lit, sound-damped room, with arms relaxed and resting on pillows on a table in front of them. The participants were asked to perform fast repetitive finger movements which were cued by visual stimuli. 10–15 blocks of 2 Hz thumb and index finger oppositions for both hands were recorded, with each 30-second blocks of finger movement and rest. Before EEG recording there was a training session, in which participants were provided with real-time feedback of electromyographic (EMG) signals and they were asked to keep consistent patterns on EMG shapes and amplitudes. As the result of training, all participants had relatively stable motor performance for the EEG recording. During movement, participants were instructed to avoid eye blinks, swallowing, or any movement other than required finger movements.
Electrical potentials were recorded at 94 scalp electrodes using a left ear electrode as the reference in a 96-channel Neuroscan EEG system (Compumedics, Inc., El Paso, TX). A/D sampling rate was 250 Hz. One bipolar surface EMG was recorded and the peak point of EMG was used as a trigger for averaging to obtain evoked motor potentials. After EEG recording, electrode positions were digitized using a 3D localization device, i.e., Polhemus Fastrack (Polhemus Inc., Vermont), with respect to the anatomic landmarks of the head (nasion, left, and right preauricular points).
High-resolution structural MRI brain images of all participants were acquired in the axial plane using a three-dimensional spoiled gradient recalled imaging (SPGR) sequence with a 220 mm field of view. The 124-axial-slice protocol produces a voxel in-plane dimension of 0.9375×0.9375 mm. The slice thickness varies from 1.8 mm to 2 mm in order cover the entire head due to different sizes of participants' heads.
C. Analysis protocol
EMG-locked averaging was done off-line. The EEG data were digitally filtered with a band-pass of 0.3–50 Hz. Each EMG peak point was marked automatically using threshold detection. All data were segmented into 500 ms epochs according to detected EMG peaks, which timings were set to zero. Trials containing artifacts were rejected by the combined procedure of pre-processing algorithms from the Neuroscan system and visual inspection. Artifact-free single epochs were then averaged by aligning to EMG peaks.
Participant's realistic head models were reconstructed from individual anatomic MRIs using Curry software (Compumedics, Inc., El Paso, TX). Scalp, skull and brain compartments were segmented from MRIs and triangulated into 1630±115.3, 1662±84.4, and 2043±125.0 triangles (mean±std), respectively, which served as the volume conductor model. The conductivities for the scalp and brain tissue were 0.33/Ω.m and the conductivity ratio between the brain and skull was assumed to be 1:1/20 (Lai et al., 2005). The source model was built by segmenting the cortex surface from MRI and triangulating it into a fine mesh of 29104±2828 triangles in Curry software, which preserve the detailed features of gyri and sulci on the neocortical envelope. A unitary equivalent current dipole was placed in each triangle along the normal direction of the triangle to form the source space on the CCD model. Co-registration was achieved by matching the location of 3 anatomic landmarks on the individual MRI to the digitized coordinates of these points using an automatic matching technique from Curry software.
Detection rates of various motor components from VB-SCCD were then summarized (Table 1) according to their anatomic locations, including somatosensory cortex (S1, Brodmann areas (BAs) 1, 2, and 3), primary motor cortex (M1, BA 4), premotor cortex (BA 6), supplementary motor area (SMA in BA 6), parietal areas (BAs 5 and 7), and dorsolateral prefrontal cortex (BAs 8, 9, and 46), and their timings, which are pre-movement MP (< −40 ms, pre-MP), MP (−40 ms – 120 ms), and post-movement MP (> 120 ms, post-MP). The binomial cumulative distribution was used to test the statistical significance of the detection rate of each component by VB-SCCD across all participants. Those tests were distinguished for contralateral and ipsilateral activity to the performing hands due to the prominent feature of lateralization, while left and right hand movements were not separated which led to 12 samples per condition (two hands from six participants) (Table 2).
Table 1.
Cortical sources identified by VB-SCCD within different cortices in the entire 500 ms time window from all participants. The indices (from A to F) for these cortices are same as in Figs. 2 and 3. A plus sign (+) indicates the observation of cortical activity within the cortex, and a minus sign (−) indicates no observations. The first row of signs in each box refers to activity in the hemisphere contralateral to the moving hand in a sequence of pre-MP, MP, and post-MP, while the second row of signs is for the ipsilateral hemisphere. L: left hand; R: right hand; c: contralateral i: ipsilateral.
| S1 (A) | M1 (B) | Premotor Area (C) | SMA (D) | Parietal Area (E) | Prefrontal Area (F) | ||||||||
|---|---|---|---|---|---|---|---|---|---|---|---|---|---|
| L | R | L | R | L | R | L | R | L | R | L | R | ||
| P1 | c | +++ | −−+ | +++ | +++ | +++ | −++ | − − − | − − − | +−+ | +++ | +++ | +++ |
| i | − − − | +++ | − − − | +++ | − − − | − − − | − − − | − − − | − − − | − − − | +++ | +−+ | |
|
| |||||||||||||
| P2 | c | +++ | ++− | +++ | +++ | +++ | +++ | − − − | − − − | +++ | +++ | +++ | −++ |
| i | −−+ | − − − | +−− | − − − | −++ | −++ | − − − | −+− | − − − | −−+ | −++ | − − − | |
|
| |||||||||||||
| P3 | c | +++ | +++ | +++ | +++ | ++− | ++− | −−+ | +++ | −+− | ++− | ++− | +++ |
| i | +++ | − − − | − − − | − − − | −+− | − − − | −++ | −++ | − − − | − − − | −+− | − − − | |
|
| |||||||||||||
| P4 | c | ++− | −++ | ++− | ++− | ++− | −+− | − − − | −−+ | ++− | −+− | −+− | +++ |
| i | − − − | − − − | − − − | − − − | +−− | −+− | − − − | −−+ | − − − | − − − | +++ | − − − | |
|
| |||||||||||||
| P5 | c | +++ | −++ | ++− | −++ | ++− | +++ | −+− | −−+ | +++ | − − − | − − − | +−+ |
| i | − − − | − − − | − − − | − − − | +−− | − − − | −+− | −−+ | − − − | ++− | −−+ | +−+ | |
|
| |||||||||||||
| P6 | c | − − − | +++ | ++− | +++ | +++ | −++ | −+− | − − − | +−+ | +−+ | ++− | +++ |
| i | ++− | − − − | +++ | − − − | −+− | −++ | −+− | − − − | +++ | +++ | +++ | +++ | |
Table 2.
Detection rates for different cortices within pre-MP, MP, and post-MP periods tested across all participants. The first row in each cell contains the number of detections (before `/') and the number of total conditions (after `/'). The second row indicates associated statistical significances from binomial distributions (bold fonts for values less than 0.05 and underlined for values close to 0.05). c: contralateral i: ipsilateral.
| S1 (A) | M1 (B) | Premotor Area (C) | SMA (D) | Parietal Area (E) | Prefrontal Area (F) | |||||||
|---|---|---|---|---|---|---|---|---|---|---|---|---|
| c | i | c | i | c | i | c | i | c | i | c | i | |
| Pre | 8/12 | 3/12 | 11/12 | 3/12 | 9/12 | 2/12 | 1/12 | 0/12 | 9/12 | 3/12 | 9/12 | 6/12 |
| 0.073 | 0.927 | 0.0002 | 0.927 | 0.019 | 0.981 | 0.997 | 1.000 | 0.019 | 0.927 | 0.019 | 0.387 | |
|
| ||||||||||||
| MP | 10/12 | 3/12 | 12/12 | 2/12 | 12/12 | 6/12 | 3/12 | 5/12 | 8/12 | 3/12 | 10/12 | 6/12 |
| 0.003 | 0.927 | 0.0000 | 0.981 | 0.000 | 0.387 | 0.927 | 0.613 | 0.073 | 0.927 | 0.003 | 0.387 | |
|
| ||||||||||||
| Post | 9/12 | 3/12 | 8/12 | 2/12 | 7/12 | 3/12 | 4/12 | 4/12 | 7/12 | 3/12 | 8/12 | 8/12 |
| 0.019 | 0.927 | 0.0730 | 0.981 | 0.194 | 0.927 | 0.806 | 0.806 | 0.194 | 0.927 | 0.073 | 0.073 | |
3. Results
A. Localization of Motor Components
Fig. 1 presents the localization results of motor components associated with the execution of finger movements from all six participants. To obtain cortical maps of brain activity during finger movements, we averaged cortical maps reconstructed by VB-SCCD between 0 ms to 80 ms in each participant, which covers the major component of MPs after the onset of finger movements (see Figs. 2 and 3 and both are not thresholded). Although the averaged maps smooth out the temporal dynamic changes and suppress low-amplitude brain activity, they reveal the most significant brain activity during the investigated time window.
Figure 1.
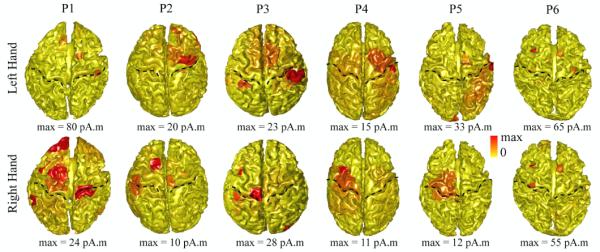
Reconstructed cortical brain activity behind the execution of finger movements from all six study participants (P1–P6) by VB-SCCD. These cortical maps were integrated over the time window from 0 ms to 80 ms in each participant. Each map was normalized by its own maximal value. Dashed lines: central sulcus.
Figure 2.
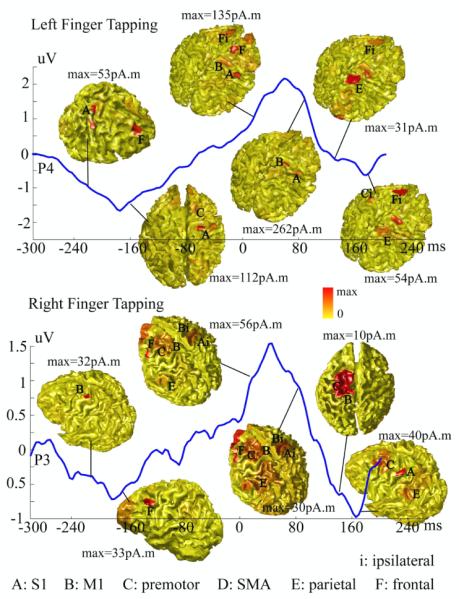
Dynamic patterns of reconstructed cortical brain activity within the entire 500 ms time window for the participant P1. An EEG waveform from one channel (P4 for left hand and P3 for right hand) above the motor cortex contralateral to the moving hand is illustrated to indicate the timing of reconstructed cortical maps. Each map was normalized by its own maximal value. A: S1; B: M1; C: premotor area; D: SMA; E: parietal area; F: dorsolateral prefrontal area; i: ipsilateral.
Figure 3.
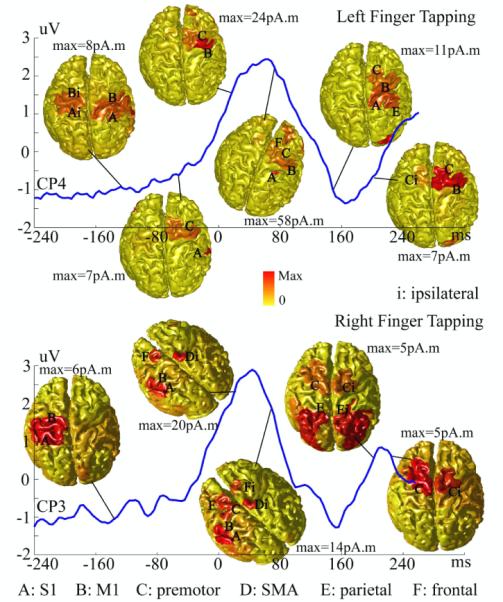
Dynamic patterns of reconstructed cortical brain activity within the entire 500 ms time window for the participant P2. An EEG waveform from one channel (CP4 for left hand and CP3 for right hand) above the motor cortex contralateral to the moving hand is illustrated to indicate the timing of reconstructed cortical maps. Each map was normalized by its own maximal value.
The MP sources related to the execution of finger movements involving the functional brain system of S1, M1, premotor cortex, and SMA were recovered around the central sulcus (marked by dashed curves). Consistently, as expected given the contralateral control of motor cortex, brain activity on the hemisphere contralateral to the performing hand overly dominated brain activity from the ipsilateral hemisphere in all participants and in either hand movements. The contralateral areas with statistically significant detection rates within MP periods are S1 (p < 0.005), M1 (p < 0.001), and premotor area (p < 0.001), while there is no ipsilateral areas showing statistically significant detection rates (Table 2). Brain activity was also observed in other areas of prefrontal cortex (p < 0.005) and parietal cortex. As compared with brain activity in above motor cortices, activity in these regions presents less contralateral preponderance in terms of detection rates and less consistency among different participants in terms of spatial patterns.
B. Temporal Dynamics of Cortical Sources in Motor Task
We further studied the dynamic changes of brain activity behind efforts to maintain fast repetitive finger movements at the frequency of 2 Hz. Figs. 2 and 3 illustrate a sequence of reconstructed cortical maps by VB-SCCD during the 500 ms epoch from −250 ms to 250 ms for the first participant (P1) and second participant (P2), respectively, and for both hands. A representative waveform of evoked potential over the electrode above the sensorimotor cortex contralateral to the moving hand was plotted together with reconstructed single-latency maps to indicate the timing. Prominent features in these waveforms include a pre-MP before −80 ms, a MP between 0 ms and 100 ms, and a post-MP after 120 ms. Different spatial distributions of brain activity within pre-MP, MP, and post-MP windows reflect different functions performed by different brain regions during these periods. While most brain activity within MP appear on sensorimotor and premotor cortices, which are related to the execution of movements, brain activity within pre-MP and post-MP involve a larger system of prefrontal, parietal, sensorimotor, and premotor cortices, which are related to the planning and coordination of movements. Furthermore, brain activity within pre-MP and post-MP seems more symmetric suggesting the involvement of both hemispheres (especially for P2, Fig. 3), while brain activity within MP shows strong contralateral preponderances as discussed in Fig. 1.
Nevertheless, we also observed a notable variance, in terms of spatial distribution, of brain activity during pre-MP and post-MP among different participants. Modest variance in ipsilateral brain activity during MP across different participants also can be seen in the figures. These might be possibly due to different control strategies and/or different control timings adopted by each participant during finger movements. These controls and the maintenance of a repetitive rate of motor acts are active brain processes (rather than passive responses), which vary in individuals.
From the group analysis, most consistent brain activity (p < 0.05 for detection rates) is observed in contralateral M1, premotor cortex, parietal cortex, and dorsolateral prefrontal cortex during pre-MPs. During MPs, most consistently detected brain activity (p < 0.05) is within contralateral S1, M1, premotor cortex, and prefrontal cortex. Only the detection of brain activity within S1 is of statistical significance (p < 0.05) during post-MPs. Furthermore, other areas, i.e., contralateral S1 for pre-MPs, contralateral parietal cortex for MPs, and contralateral M1 and symmetrical prefrontal cortex for post-MPs, have high detection rates which are close to the significance level (p = 0.073). With respect to the temporal sequence of events in these contralateral areas, M1 areas precede S1 areas in producing consistent activity which could be detected with statistical significance (pre-MP and MP for M1, MP and post-MP for S1), while both contralateral M1 and S1 activities are overlapped during MPs. Furthermore, the activity within prefrontal, premotor, and parietal cortices seems interdependent, which becomes significantly detectable during both pre-MPs and MPs and less significant during post-MPs. The detection rate is the lowest for SMA.
In terms of detection rates, brain activity within the S1 and M1 is mostly lateralized (the rates between contralateral and ipsilateral detections are 3 and 4.4, respectively). Brain activity within premotor area (the rate is 2.5), parietal cortex (the rate is 2.5), and prefrontal cortex (the rate is 1.2) is less lateralized. The activations with SMA (the rate is 0.8) show the most symmetry, which has more simultaneous detections of both contralateral and ipsilateral sides rather than lateralized detections (7 conditions against 3 conditions). Some ipsilateral brain activity is even stronger than contralateral brain activity. For example, the participant P5 showed greater activation in right prefrontal cortex and left parietal cortex when moving either hand (Table 1).
C. Enhanced Spatial Identification of Sources on Cortical Surface
The first column in Fig. 4 shows the scalp MP maps at the peaks within 0 ms and 80 ms (Figs. 2 and 3) from two participants (P1 and P2) for left and right hands. These scalp MP maps have limited spatial resolutions due to the so-called volume conductor effects (Nunez, 1995). Furthermore, underlying brain sources behind these MP maps are not well defined spatially since these MP maps have low spatial resolution and their distributions also depend on the orientations of current flows. Reconstructed single-latency cortical current density maps by VB-SCCD are shown in the second column of Fig. 4. These maps were thresholded at the 20 percentage of their own maximums in order to make comparison with other two algorithms (i.e., cLORETA and wMNE), which will be discussed below. These cortical current density maps, as compared with the scalp potential maps, have gained spatial resolution and, thus, avoid complication on their interpretations due to the current flow orientation issue and volume conductor issue. Furthermore, they reveal cortical current distributions with much enhanced resolution. For example, while the scalp MP maps from P2 for both left and right hands look very similar to dipolar patterns across the central sulcus (as compared to P1), their reconstructed cortical current density maps actually show activity at multiple distinct locations.
Figure 4.
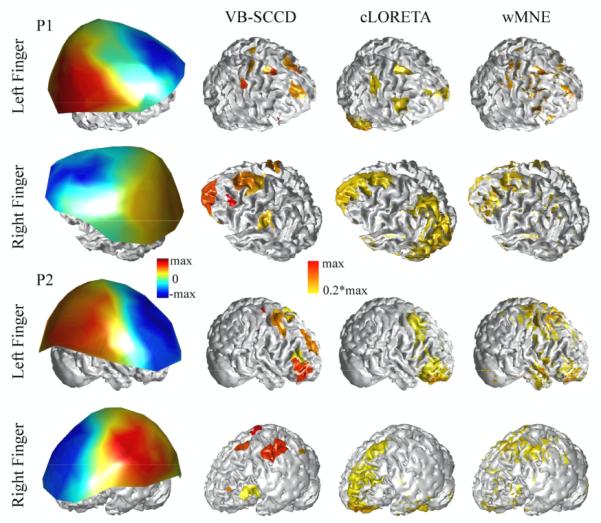
Comparison of scalp potential maps, cortical maps from VB-SCCD, cLORETA, and wMNE in participants P1 and P2 for both hands. Each cortical map was thresholded at 20% of its own maximum in order to better illustrate results from cLORETA and wMNE.
D. Comparison of VB-SCCD, cLORETA, and wMNE
Fig. 4 also presents results from three algorithms (i.e., VB-SCCD, cLORETA, and wMNE). Since the results from cLORETA and wMNE are not good for visualization without thresholding due to the smoothness, we thresholded all cortical maps from all three algorithms individually at the 20th percent of the maximum of each map. This step actually does not obviously affect the visualization of results from VB-SCCD (comparing Figs. 2, 3, and 4). One observation in Fig. 4 is that the measures of brain activity obtained from wMNE are much scattered and lack the continuity over the cortical surface as comparison to VB-SCCD and cLORETA. This is probably due to the fact that the certain sorts of cortical current source continuity are considered in both VB-SCCD and cLORETA algorithms, but not in wMNE (Wagner et al., 1996; Ding, 2009). Furthermore, consistent with other studies (Pascual-Marqui, 1995), wMNE favors superficial source reconstructions with high-amplitude current densities on the ridges of gyri, low-amplitude current densities on the banks of sulci, and even no currents on the valleys of sulci in illustrated examples. However, the spatial localizations of brain activities from wMNE, as compared with cLORETA, seem more consistent with VB-SCCD, although most of them appear more scattered and distributed. In cLORETA, only results from the left hands of both participants are close to results from VB-SCCD. Results from the right hands indicate the largest discrepancy between cLORETA and VB-SCCD. For example, in the right hand of P1, the largest current density from cLORETA spreads widely over the parietal and occipital cortices, which contrasts with the scalp MP observation that, in these areas, potentials are much smaller compared with the frontal area. In the case of right hand from P2, a parietal cortical source due to the large scalp MP observation over this area is obviously missed in cLORETA.
To quantitatively compare the performance of three algorithms, the detection rates of both wMNE and cLORETA were similar calculated as VB-SCCD for contralateral S1, M1, premotor, prefrontal, and parietal cortex during the MP period, where VB-SCCD shows statistically significant detections. Since the results from wMNE were extremely scattered, a low-pass spatial filter was applied to eliminate spatially spiky sources (i.e., only sources with more than 5 triangular elements would survive the filter). The detection rates for wMNE are 8, 8, 7, 6 and 4 out of 12 for S1, M1, premotor, prefrontal, and parietal cortex, respectively. The detection rates for cLORETA are 6, 5, 4, 5 and 6 out of 12 in the same sequence for locations.
4. Discussion
The major shortcoming of using simulated EEG data (Ding, 2009) for method development and validation is that the data are not realistic. Furthermore, since the forward and inverse calculations are based on the same head model, results obtained using simulated EEG cannot reflect errors introduced by the head model but only show the accuracy of the source model and associated inverse regularization schemes. The present study provides the first experimental results with regard to the feasibility of reconstructing brain activity by means of VB-SCCD behind motor potentials recorded using a real electrode set-up. Six participants scanned with MRI were subjected to the VB-SCCD analysis using realistic geometry head models.
The main findings obtained with VB-SCCD are related to the activation of a system underlying finger movements involving multiple distribute and well-separated cortical structures. Furthermore, the distinct spatial localization patterns during motor preparation (pre-MP and post-MP) and motor execution (MP) are revealed. During the MP periods, a system including preponderant contralateral primary sensorimotor area (p < 0.005) is always activated (Fig. 1 and Tables 1 and 2), as supported by many EEG/MEG, and fMRI studies (Salmelin et al., 1995; Jancke et al., 2000). M1 and S1 activation overlap to some extent has been observed in intracortical recordings in monkeys (Murphy et al., 1985) and non-invasive EEG study for humans (Gerloff et al., 1998b). The sequential activation of S1 and M1 found in our data (Table 2) is also consistent with above cited studies that neuron population in the M1 increase their firing rates before and during movement, while neuron population in the S1 show maximal activity after movement onset. The significant co-activations of the premotor area, dorsolateral prefrontal area and parietal lobule (p < 0.05 or close to 0.05, Table 2) during pre-MP, MP, and post-MP demonstrate the importance of a fronto-parietal network for visuomotor transformations for body movements (Jancke et al., 2000). The premotor areas are preferentially activated to process the visual pacing stimulus. At the same time, these visual cues also trigger the timing of finger movements by transferring the sensory pacing codes via the dorsal frontoparietal pathway to the prefrontal cortex, where stimulus-response plans are learned and maintained (Jancke et al., 2000). The brain activations noted in the parietal area during post-MP periods reflect its role in the somatosensory-motor integration for the appropriate motor control, which, for example, has been suggested as a higher-order somatosensory zone devoted to the analysis of proprioceptive information as would be generated by performing our task (Rizzolatti et al., 1998). The total detection in contralateral S1, M1, premotor, prefrontal, and parietal areas during pre-MP, MP, and post-MP periods is 137 out of 180 (p < 0.0000). However, only a few detections of SMA areas are observed in our study, while its role in movement execution is well established (Gerloff et al., 1998a). The reduced capability in detecting sources from SMA areas might be due to the bilateral activations of left and right SMA areas, which have the opposite orientation and their potential projections on the scalp surface might cancel each other (Gerloff et al., 1998a). More symmetric activations, as compared with the number of asymmetric activations, detected from SMA also support the explanation. We also observe that the brain activity within primary sensorimotor cortex is more lateralized than other areas, which suggests an asymmetric functional control of initiation and execution of movements and a relatively functional symmetry during the planning and coordination of motor acts.
All of these observations are made possible by the VB-SCCD sparse neuroimaging method. The millisecond-level temporal resolution of EEG signals utilized in VB-SCCD provides a sensitive and precise approach for evaluating dynamic activation patterns of the brain (Figs. 2 and 3). The strongly enhanced spatial resolution achieved by VB-SCCD, as compared with scalp potentials/fields (Fig. 4), significantly improve cortical source separation ability of EEG, which allowed us to reveal the complicated brain activity associated with performing a simple motor task. All reconstructed cortical activations are supported by previous studies using different imaging technologies (e.g., EEG, MEG, and fMRI) in similar experimental protocols. Furthermore, as suggested in Fig. 4 and also in our previous simulation studies (Ding, 2009), VB-SCCD has much better performance (p < 0.000 for detecting contralateral sources (except SMA) during MP periods) over other available ESI algorithms (i.e., cLORETA (p = 0.8169) and wMNE (p = 0.1831)). Furthermore, wMNE seems better than cLORETA in terms of detection rate, while spatial distributions reconstructed by wMNE are significantly scattered and have more false alarms.
In the present study, we demonstrated that an ESI technology (i.e., VB-SCCD) is able to reconstruct a complicated dynamic system of cortical brain activity. It is promising to broaden the application of ESI technologies in neuroscience and clinical neurology from the early success in simple brain activity (Flor et al., 1995; Elbert et al., 1995; Ebersole, 2000) to the exploration of high-complexity brain systems with high clinical and scientific significance. It is also worth to note that detailed spatiotemporal information underlying brain activity simultaneously tracked by VB-SCCD can be the foundation for further analyses of brain networks, such as functional connectivity studies (Babiloni et al., 2005; Stam et al., 2006; Ding et al., 2007; De Vico Fallani et al., 2008; Valencia et al., 2009). Such functional connectivity studies of brain networks have the advantage of using real dynamic neuronal time events, rather than merely implementing static task contrasts with block design fMRI studies (Buchel and Friston, 1997).
We used un-thresholded cortical maps reconstructed from scalp EEGs to illustrate brain sources behind motor actions. This is based on the fact that the VB-SCCD algorithm does not significantly smooth boundaries which are aimed to be reconstructed as explicitly expressed in equation (3). Fig. 5 shows a simulation example comparing simulated sources and those reconstructed by VB-SCCD, cLORETA, and wMNE. It demonstrates that VB-SCCD has the best recovery of spatial distributions and cortical coverage of simulated sources. Fig. 5 also shows the reconstructed cortical map by one of previous reported L1-norm regularized MNEs (Ding and He, 2008), which produces an over-focused inverse solution. This is why these algorithms are not suitable to reconstruct spatially distributed cortical sources and we did not include them in the present study for comparisons. However, the smoothness issue in VB-SCCD is also impacted by some other factors, such as signal-noise-ratio (SNR) in real data. From our present results, most of cortical motor sources in the pre-MP and post-MP periods were observed to be smoother in spatial distributions than those from MP periods (see Fig. 3). This is because the peaks with largest amplitudes during MP periods give higher signal-noise-ratio data, as compared with those activities in pre-MP and post-MP periods. Data with better SNR usually produces better source reconstructions. One possible solution to such a problem is to use statistical techniques to screen statistically significant evoked components out from background spontaneous EEG/MEG data (Maris and Oostenveld, 2007) and to apply VB-SCCD only on these data, which can avoid over-smoothed inverse solutions and their misleading interpretations.
Figure 5.

A simulation example to illustrate the capability of VB-SCCD, wMNE, and cLORETA in recovering spatial extents of simulated two separated cortical sources, without any thresholding. (a) simulated cortical map with two sources; reconstructed cortical maps by (b) VB-SCCD, (c) cLORETA, (d) wMNE, and (e) L1-norm MNE (Ding and He, 2008).
Since the highly convoluted human cortex (i.e., sulci and gyri) requires a high-density element representation, CCD models created for each individual were triangulated into the high-resolution mesh with each triangle of area about 6 mm2, resulting in about 30,000 triangles. Low-density CCD models (about 1,000 to 7000 elements) (Hämäläinen and Ilmoniemi, 1984; Pascual-Marqui et al., 1995; Liu et al., 1998; Daunizeau et al., 2006; Lin et al., 2006; Huang et al., 2006) have multiple modeling misspecifications, including significant loss of cortical details, low spatial resolution, and dramatically changed orientations of triangular elements (Lin et al., 2006), all of which significantly degrade the accuracy of EEG/MEG inverse solutions. The advantage of VB-SCCD is that its performance is mainly decided by the number of sparseness and the number of independent measurements, but is not based on the size of source space (Candes and Tao, 2005). In other words, whether high-density or low-density CCD models are used, the performance of VB-SCCD will not be significantly influenced if there is no significant change in the number of coefficients needed to represent brain activity. This is essential in tackling the non-uniqueness mathematical challenge. Furthermore, we implemented iterative solvers (Ding, 2009) to handle large-scale computational requirements due to the use of high-resolution models. It is worth noting that the high-density model is not able to handle orientation misspecifications caused during segmentation of cortical surfaces. While we can develop more accurate segmentation algorithms to analyze MRI images, another approach is to loosen the orientation constraint in CCD models (Lin et al., 2006) and allow orientations to be decided during the inverse reconstruction (Ding and He, 2008).
In summary, we have tested the feasibility of reconstructing cortical brain activity from motor potentials by means of a new sparse ESI technology, i.e. VB-SCCD. The cortical maps behind motor potentials from VB-SCCD are promising and supported by evidence of previous studies using multiple brain imaging modalities. The present study suggests that VB-SCCD provides high-resolution source reconstruction capability and may potentially become useful in studying complicated dynamic systems of brain activity which are of wide interest to neuroscience and clinical neurological research.
Acknowledgements
This work was supported in part by OCAST HR09-125S, a fund from the University of Oklahoma, NSF CAREER ECCS-0955260, and NIH RO1 EB00178. The authors would like to thank Min Zhu for useful discussions. The authors are also grateful to anonymous reviewers for their constructive comments.
Reference
- Babiloni F, Babiloni C, Carducci F, Cincotti F, Astolfi L, Basilisco A, Rossini PM, Ding L, Ni Y, Cheng J, et al. Assessing time-varying cortical functional connectivity with the multimodal integration of high resolution EEG and fMRI data by Directed Transfer Function. NeuroImage. 2005;24:118–131. doi: 10.1016/j.neuroimage.2004.09.036. [DOI] [PubMed] [Google Scholar]
- Baillet S, Mosher JC, Leahy RM. Electromagnetic brain mapping. IEEE Signal Processing Magazine. 2001;18(6):14–30. [Google Scholar]
- Barnes GR, Hillebrand A. Statistical Flattening of MEG Beamformer Images. Human brain mapping. 2003;18:1–12. doi: 10.1002/hbm.10072. [DOI] [PMC free article] [PubMed] [Google Scholar]
- >Buchel C, Friston KJ. Modulation of connectivity in visual pathways by attention: cortical interactions evaluated with structural equation modeling and fMRI. Cerebral Cortex. 1997;7(8):768–778. doi: 10.1093/cercor/7.8.768. [DOI] [PubMed] [Google Scholar]
- Candes EJ, Tao T. Decoding by linear programming. IEEE Transactions on Information Theory. 2005;51(12):4203–4215. [Google Scholar]
- Dale AM, Sereno MI. Improved localization of cortical activity by combining EEG and MEG with MRI cortical surface reconstruction: a linear approach. J. Cog. Neurosci. 1993;5:162–176. doi: 10.1162/jocn.1993.5.2.162. [DOI] [PubMed] [Google Scholar]
- Darvas F, Pantazis D, Kucukaltun-Yildirim E, Leahy RM. Mapping human brain function with MEG and EEG: methods and validation. NeuroImage. 2004;23:S289–S299. doi: 10.1016/j.neuroimage.2004.07.014. [DOI] [PubMed] [Google Scholar]
- Darvas F, Scherer R, Ojemann JG, Rao RP, Miller KJ, Sorensen LB. High gamma mapping using EEG. NeuroImage. 2010;49:930–938. doi: 10.1016/j.neuroimage.2009.08.041. [DOI] [PMC free article] [PubMed] [Google Scholar]
- Daunizeau J, Mattout J, Clonda D, Goulard B, Benali H, Lina JM. Bayesian Spatio-Temporal Approach for EEG Source Reconstruction: Conciliating ECD and Distributed Models. IEEE Trans. Biomed. Eng. 2006;53(3):503–516. doi: 10.1109/TBME.2005.869791. [DOI] [PubMed] [Google Scholar]
- De Vico Fallani F, Astolfi L, Cincotti F, Mattia D, Tocci A, Salinari S, Marciani MG, Witte H, Colosimo A, Babiloni F. Brain network analysis from high resolution EEG recordings by the application of theoretical graph indexes. IEEE Trans on Neural System and Rehabilit. Engineering. 2008;16:442–452. doi: 10.1109/TNSRE.2008.2006196. [DOI] [PubMed] [Google Scholar]
- Ding L. Reconstructing Cortical Current Density by Exploring Sparseness in the Transform Domain. Physics in Medicine and Biology. 2009;54:2683–2697. doi: 10.1088/0031-9155/54/9/006. [DOI] [PubMed] [Google Scholar]
- Ding L, He B. Sparse source imaging in EEG with accurate field modeling. Human brain mapping. 2008;29:1053–1067. doi: 10.1002/hbm.20448. [DOI] [PMC free article] [PubMed] [Google Scholar]
- Ding L, Worrell GA, Lagerlund TD, He B. Ictal source analysis: localization and imaging of causal interactions in humans. NeuroImage. 2007;34:575–586. doi: 10.1016/j.neuroimage.2006.09.042. [DOI] [PMC free article] [PubMed] [Google Scholar]
- Ebersole JS. Noninvasive localization of epileptogenic foci by EEG source modeling. Epilepsia. 2000;41(Suppl. 3):S24–S33. doi: 10.1111/j.1528-1157.2000.tb01531.x. [DOI] [PubMed] [Google Scholar]
- Elbert T, Pantev C, Wienbruch C, Rochstroh B, Taub E. Increased cortical representation of the fingers of the left hand in string players. Science. 1995;270:305–307. doi: 10.1126/science.270.5234.305. [DOI] [PubMed] [Google Scholar]
- Flor H, Elbert T, Knecht S, Wienbruch C, Pantev C, Birbaumer N, Larbig W, Taub E. Phantom-limb pain as a perceptual correlate of cortical reorganization following arm amputation. Nature. 1995;375:482–484. doi: 10.1038/375482a0. [DOI] [PubMed] [Google Scholar]
- Gerloff C, Richard J, Hadley J, Schulman AE, Honda M, Hallett M. Functional coupling and regional activation of human cortical motor areas during simple, internally paced and externally paced finger movements. Brain. 1998a;121:1513–1531. doi: 10.1093/brain/121.8.1513. [DOI] [PubMed] [Google Scholar]
- Gerloff C, Uenishi N, Nagamine T, Kunieda T, Hallett M, Shibasaki H. Cortical activation during fast repetitive finger movements in humans: steady-state movement-related magnetic fields and their cortical generators. Electroenceph. Clin. Neurophysiol. 1998b;109:444–453. doi: 10.1016/s0924-980x(98)00045-9. [DOI] [PubMed] [Google Scholar]
- Hämäläinen MS, Hari R, Ilmoniemi RJ, Knuutila J, Lounasmaa OV. Magnetoencephalography – theory, instrumentation, and applications to noninvasive studies of the working human brain. Reviews of Modern Physics. 1993;65:413–497. [Google Scholar]
- Hämäläinen MS, Ilmoniemi RJ. Interpreting measured magnetic fields of the brain: estimates of current distributions. Helsinki University of Technology; 1984. [Google Scholar]
- He B. Modeling and imaging of bioelectrical activity: Principles and applications. Kluwer Academic/Plenum Publishers; New York: 2004. [Google Scholar]
- He B, Musha T, Okamoto Y, Homm S, Nakajima Y, Sato T. Electrical dipole tracing in the brain by means of the boundary element method and its accuracy. IEEE Trans. Biomed. Eng. 1987;34:406–414. doi: 10.1109/tbme.1987.326056. [DOI] [PubMed] [Google Scholar]
- Huang XH, Dale AM, Song T, Halgren E, Harrington DL, Podgorny I, Canive JM, Lewis S, Lee RR. Vector-based spatial-temporal minimum L1-norm solution for MEG. NeuroImage. 2006;31:1025–1037. doi: 10.1016/j.neuroimage.2006.01.029. [DOI] [PubMed] [Google Scholar]
- Jancke L, Loose R, Lutz K, Specht K, Shah NJ. Cortical activations during paced finger-tapping applying visual and auditory pacing stimuli. Cognitive Brain Research. 2000;10:51–66. doi: 10.1016/s0926-6410(00)00022-7. [DOI] [PubMed] [Google Scholar]
- Jensen O, Kaiser J, Lachaux JP. Human gamma-frequency oscillations associated with attention and memory. Trends in Neurosciences. 2007;30(7):317–324. doi: 10.1016/j.tins.2007.05.001. [DOI] [PubMed] [Google Scholar]
- Lai Y, van Drongelen W, Ding L, Hecox KE, Towle VL, Frim DM, He B. Estimation of in vivo human brain-to-skull conductivity ratio from simultaneous extra- and intra-cranial electrical potential recordings. Clinical Neurophysiology. 2005;116:456–465. doi: 10.1016/j.clinph.2004.08.017. [DOI] [PubMed] [Google Scholar]
- Liljestrom M, Hulten A, Parkkonen L, Salmelin R. Comparing MEG and fMRI views to naming actions and objects. Human Brain Mapping. 2009;30:1845–1856. doi: 10.1002/hbm.20785. [DOI] [PMC free article] [PubMed] [Google Scholar]
- Lin FH, Belliveau JW, Dale AM, Hämäläinen MS. Distributed Current Estimates Using Cortical Orientation Constraints. Hum Brain Mapp. 2006;27:1–13. doi: 10.1002/hbm.20155. [DOI] [PMC free article] [PubMed] [Google Scholar]
- Lin FH, Witzel T, Ahlfors SP, Stufflebeam SM, Belliveau JW, Hämäläinen MS. Assessing and improving the spatial accuracy in MEG source localization by depth-weighted minimum-norm estimates. NeuroImage. 2006;31:160–171. doi: 10.1016/j.neuroimage.2005.11.054. [DOI] [PubMed] [Google Scholar]
- Liu AK, Belliveau JW, Dale AM. Spatiotemporal imaging of human brain activity using fMRI constrained MEG data: Monte Carlo simulations. Proc. Natl. Acad. Sci. USA. 1998;95:8945–8950. doi: 10.1073/pnas.95.15.8945. [DOI] [PMC free article] [PubMed] [Google Scholar]
- Liu AK, Dale AM, Belliveau JW. Monte Carlo Simulation Studies of EEG and MEG Localization Accuracy. Hum Brain Mapp. 2002;16:47–62. doi: 10.1002/hbm.10024. [DOI] [PMC free article] [PubMed] [Google Scholar]
- Maris E, Oostenveld R. Nonparametric statistical testing of EEG- and MEG-data. Journal of Neuroscience Methods. 2007;164:177–190. doi: 10.1016/j.jneumeth.2007.03.024. [DOI] [PubMed] [Google Scholar]
- Morozov AV. On the solution of functional equations by the method of regularization. Soviet. Math. Dokl. 1966;7:414–417. [Google Scholar]
- Murphy JT, Wong YC, Kwan HC. Sequential activation of neurons in primate motor cortex during unrestrained forelimb movement. J. Neurophysiol. 1985;53:435–445. doi: 10.1152/jn.1985.53.2.435. [DOI] [PubMed] [Google Scholar]
- Nagarajan S, Attias HT, Hild KE, II, Sekihara K. A graphical model for estimating stimulus-evoked brain responses from magnetoencephalography data with large background brain activity. NeuroImage. 2006;30:400–416. doi: 10.1016/j.neuroimage.2005.09.055. [DOI] [PMC free article] [PubMed] [Google Scholar]
- Nemirovski A, Ben Tal A. Lectures on Modern Convex Optimization: Analysis, Algorithms and Engineering Application: SIAM. 2001. [Google Scholar]
- Nunez PL. Neocortical dynamics and human EEG rhythms. Oxford University Press; New York: 1995. [Google Scholar]
- Osipova D, Takashima A, Oostenveld R, Fernandez G, Maris E, Jensen O. Theta and gamma oscillations predict encoding and retrieval of declarative memory. The Journal of Neuroscience. 2006;26(28):7523–7531. doi: 10.1523/JNEUROSCI.1948-06.2006. [DOI] [PMC free article] [PubMed] [Google Scholar]
- Pantazis D, Nichols TE, Baillet S, Leahy R. A comparison of random field theory and permutation methods for the statistical analysis of MEG data. NeuroImage. 2005;25:383–394. doi: 10.1016/j.neuroimage.2004.09.040. [DOI] [PubMed] [Google Scholar]
- Pascual-Marqui RD. In source localization: continuing discussion of the inverse problem. 1995. Reply to comments by Hämäläinen, Ilmoniemi and Nunez. [Google Scholar]
- Phillips C, Mattout J, Rugg MD, Maquet P, Friston K. An empirical Bayesian solution to the source reconstruction problem in EEG. NeuroImage. 2005;24:997–1011. doi: 10.1016/j.neuroimage.2004.10.030. [DOI] [PubMed] [Google Scholar]
- Qin L, Ding L, He B. Motor imagery classification by means of source analysis for brain-computer interface applications. Journal of Neural Engineering. 2004;1:135–141. doi: 10.1088/1741-2560/1/3/002. [DOI] [PMC free article] [PubMed] [Google Scholar]
- Rizzolatti G, Luppino G, Matelli M. The organization of the cortical motor system: new concepts. Electroencephalography and Clinical Neurophysiology. 1998;106:283–296. doi: 10.1016/s0013-4694(98)00022-4. [DOI] [PubMed] [Google Scholar]
- Salmelin R, Hämäläinen M, Kajola M, Hari R. Functional segregation of movement-related rhythmic activity in the human brain. Neuroimage. 1995;2:237–243. doi: 10.1006/nimg.1995.1031. [DOI] [PubMed] [Google Scholar]
- Stam CJ, Jones BF, Manshanden I, van Cappellen van Walsum AM, Montez T, Verbunt JP, de Munck JC, van Dijk BW, Berendse H, Scheltens P. Magnetoencephalographic evaluation of resting-state functional connectivity in Alzheimer's disease. Neuroimage. 2006;32:1335–1344. doi: 10.1016/j.neuroimage.2006.05.033. [DOI] [PubMed] [Google Scholar]
- Sturm JS. Using SeDuMi 1.02, a Matlab toolbox for optimization over symmetric cones. Tilburg University, Department of Econometrics; Netherlands: 2001. [Google Scholar]
- Urbano A, Babiloni C, Onorati P, Ambrosini A, Carducci F, Fattorini L, Babiloni F. Responses of human primary sensorimotor and supplementary motor areas to internally-triggered unilateral and simultaneous bilateral one-digit movements: A high resolution EEG study. Eur. J. Neurosci. 1998;40(8):285–489. doi: 10.1046/j.1460-9568.1998.00072.x. [DOI] [PubMed] [Google Scholar]
- Uutela K, Hamalainen M, Somersalo E. Visualization of Magnetoencephalographic Data Using Minimum Current Estimates. NeuroImage. 1999;10:173–180. doi: 10.1006/nimg.1999.0454. [DOI] [PubMed] [Google Scholar]
- van Veen B, van Drongelen W, Yuchtman M, Suzuki A. Localization of Brain Electric Activity via Linearly Constrained Minimum Variance Spatial Filtering. IEEE Trans. Biomed. Eng. 1997;44(9):867–880. doi: 10.1109/10.623056. [DOI] [PubMed] [Google Scholar]
- Valencia M, Pastor MA, Fernández-Seara MA, Artieda J, Martinerie J, Chavez M. Complex modular structure of large-scale brain networks. Chaos. 2009;19(2) doi: 10.1063/1.3129783. art. no. 023119. [DOI] [PubMed] [Google Scholar]
- Wagner M, Fuchs M, Wischmann HA, Drenckhahn R, Köhler T. Smooth reconstruction of cortical sources from EEG or MEG recordings. NeuroImage. 1996;3:S168. [Google Scholar]
- Wagner M, Wischmann HA, Fuchs M, Kohler T, Drenckhahn R. Current density reconstruction using the L1 norm. Advances in Biomagnetism Research: Biomag96. Springer-Verlag; New York: 1998. pp. 393–396. [Google Scholar]