Abstract
Three-prime untranslated regions (3′UTRs) of metazoan messenger RNAs (mRNAs) contain numerous regulatory elements, yet remain largely uncharacterized. Using polyA capture, 3′ rapid amplification of complementary DNA (cDNA) ends, full-length cDNAs, and RNA-seq, we defined ∼26,000 distinct 3′UTRs in Caenorhabditis elegans for ∼85% of the 18,328 experimentally supported protein-coding genes and revised ∼40% of gene models. Alternative 3′UTR isoforms are frequent, often differentially expressed during development. Average 3′UTR length decreases with animal age. Surprisingly, no polyadenylation signal (PAS) was detected for 13% of polyadenylation sites, predominantly among shorter alternative isoforms. Trans-spliced (versus non–trans-spliced) mRNAs possess longer 3′UTRs and frequently contain no PAS or variant PAS. We identified conserved 3′UTR motifs, isoform-specific predicted microRNA target sites, and polyadenylation of most histone genes. Our data reveal a rich complexity of 3′UTRs, both genome-wide and throughout development.
The 3′ untranslated regions (3′UTRs) of mRNAs contain cis-acting sequences that interact with RNA-binding proteins and/or small noncoding RNAs [such as micro RNAs (miRNAs)] to influence mRNA stability, localization, and translational efficiency (1–3). The differential processing of mRNA 3′ ends has evident roles in development, metabolism, and disease (4, 5). Despite these critical roles, genome-wide characterization of 3′UTRs lags far behind that of coding sequences (CDSs). Even in the well-annotated genome of Caenorhabditis elegans, nearly half (∼47%) of the 20,191 genes annotated in WormBase (release WS190) (6, 7) lack an annotated 3′UTR, and only ∼1180 (∼5%) are annotated with alternative 3′UTR isoforms (fig. S1, A and B).
We have taken a multifaceted, empirical approach to defining the 3′UTR landscape in C. elegans (figs. S2 to S5 and tables S1 to S4) (8). We prepared developmentally staged cDNA libraries composed of mostly full-length clones spanning from 5′ capped first base to polyadenylated (polyA) tail, and we annotated 16,659 polyA addition sites in 11,180 genes by manually curating ∼300,000 Sanger capillary sequence traces in National Center for Biotechnology Information (NCBI) AceView (9). We developed a method to capture the 3′ ends of polyadenylated transcripts genome-wide by deep sampling and generated a comprehensive developmental profile comprising more than 2.5 million sequence reads from Roche/454 (fig. S2 to S5 and tables S1 to S4). We cloned 3′ rapid amplification of cDNA ends (RACE) products directly targeting 3′UTRs for 7105 CDSs (6741 genes) in both the Promoterome (10) and ORFeome (11) collections, and we recovered one or more sequenced isoforms for 85% of the targets (figs. S2 and S5 and tables S1 to S4) (8, 12). Finally, we remapped and annotated polyA addition sites in published RNA-seq data (13, 14).
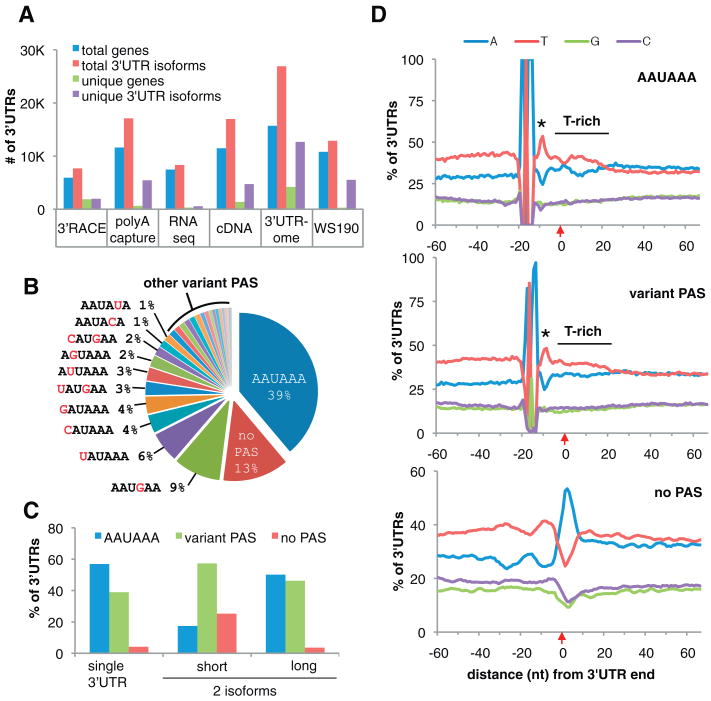
All data sets were mapped, cross-validated, consolidated, and filtered to eliminate obvious experimental artifacts, including internal priming on A-rich stretches (Fig. 1A) (8). These data sets are not yet saturated: Whereas for most genes (11,516 or 73%), at least one 3′UTR isoform is supported by two or more experimental approaches, 47% of transcripts are observed by only one method (in part due to limitations specific to each protocol) (Fig. 1 and tables S3 and S4) (8). The resulting 130,090 distinct polyA sites, identified at single-nucleotide resolution and supported by more than 3 million independent polyA tags, were clustered into 26,967 representative polyA sites. Due to biological variation, 86% of tags occur within 4 nucleotides of representative sites, although individual polyA tags may spread over ∼20 nucleotides (fig. S6).
Fig. 1.
The 3′UTRome and 3′UTR PAS. (A) The number of genes and isoforms detected in, or specific to, each data set and cumulative totals in WS190 and 3′UTRome annotations. (B) PAS motif frequencies: AAUAAA (39%), variant PAS (1 to 9%), and no PAS (13%). (C) PAS usage in genes with one or two (short and long) 3′UTR isoforms. (D) Nucleotide distribution spanning ±60 nt around the polyA addition site, in 3′UTRs with: AAUAAA (top), 10 most common variant PAS (middle), and no PAS (bottom). Alignments, centered at −19 nt, show a T-spike at 5 nt downstream of PAS (asterisk), polyA addition site (red arrow), and T-rich region downstream of cleavage site. The A-rich peak downstream of “no PAS” is not enriched for AAAAAA, suggesting an A-rich motif at that location rather than artifactual A-rich ends.
Linking polyA sites to their parent genes proved to be a challenge, as many previous gene models were incomplete or incompatible with our new data. Using all available empirical evidence, we reannotated in AceView the C. elegans gene models (9). Of the 15,683 protein-coding genes with both polyA sites and cDNA support, 57% confirm the structure of WormBase WS190 gene models. The remainder encode different proteins, usually representing different cDNA-supported splice patterns: ∼25% share the same stop codon, ∼12% use a different stop (hundreds of those correspond to fusions or splits of earlier gene models), and ∼6% are not yet annotated in WormBase (supporting data sets S1 and S2).
This integrated collection, herein called the 3′UTRome (fig. S1 and data set S2), provides evidence supporting 3′UTR structures for ∼74% of all C. elegans protein-coding genes in WormBase WS190, including previously unannotated isoforms for ∼7397 genes (fig. S1, A to D). The length distribution of 3′UTRs parallels that in WormBase (fig. S1D), with a mean of 211 nucleotides (nt) (median = 140 nt). The 3′UTRome matches 61% of WormBase 3′UTRs within ±10 nt (6714 polyA ends for 6563 genes) and contains thousands of longer or shorter isoforms (fig. S1A). We identified 6177 polyA ends for 4466 genes with no previous 3′UTR annotation and discovered 1490 polyA ends for 1031 genes not yet represented in WormBase (fig. S1A and data sets S1 to S3).
We annotate more than one 3′UTR isoform for 43% of 3′UTRome genes (figs. S1 and S7). Of these, a majority (65%) reflects alternative 3′-end formation at distinct locations in the same terminal exon for proteins using the same stop; the remainder use distinct stops in the same last exon or distinct last exons. Very rarely (79 examples), an intron within the 3′UTR is excised or retained (fig. S8), potentially affecting functional sequence content elements (fig. S8C). Indeed, putative binding sites for miRNAs (this study) or ALG-1 (15) were identified in the variable regions of some of these transcripts. About 2% of genes possess five or more 3′UTR isoforms (Fig. 1A and figs. S1B and S7).
To identify putative cis-acting sequences that may play a role in 3′-end formation, we scanned the 50 nt upstream of the cleavage and polyA addition sites for all possible 5- to 10-mers and assigned the most likely polyadenylation signal (PAS) motif to each 3′UTR using an iterative procedure based on enrichment and centering of the k-mers. The canonical PAS motif AAUAAA (seen in 39% of 3′ ends) and many variants differing by 1 to 2 nt are detected, with distributions all peaking 19 nt upstream of the polyA site (figs. S9, S10, and table S5) (8). The canonical signal predominates in genes with unique 3′UTRs (57%). However, many high-quality 3′UTRs (3658) lack a detectable PAS motif altogether (Fig. 1, B and C). All PAS variants are embedded within a T-rich region that spikes 5 nt downstream of the PAS motif and extends about 20 nt beyond the cleavage site (Fig. 1D). 3′UTRs with no PAS tend to be T-rich throughout, except for a very A-rich eight-nucleotide region just after the cleavage site (Fig. 1D). Thus, a functional PAS motif with strict sequence specificity appears dispensable for 3′-end formation in C. elegans.
Among genes with alternative 3′UTRs, successive polyA sites show a marked asymmetry: The longest isoform prefers a PAS, whereas shorter isoforms more often show no PAS (Fig. 1C and fig. S11). The distance between alternative polyA sites peaks at ∼40 nt, with resonances at ∼80 and ∼140 nt (fig. S11A). This regularity suggests that a physical constraint (possibly queuing transcription complexes) could contribute to cleavage and polyA addition at some upstream sites, which may, therefore, depend less on instructive cues from signal sequences.
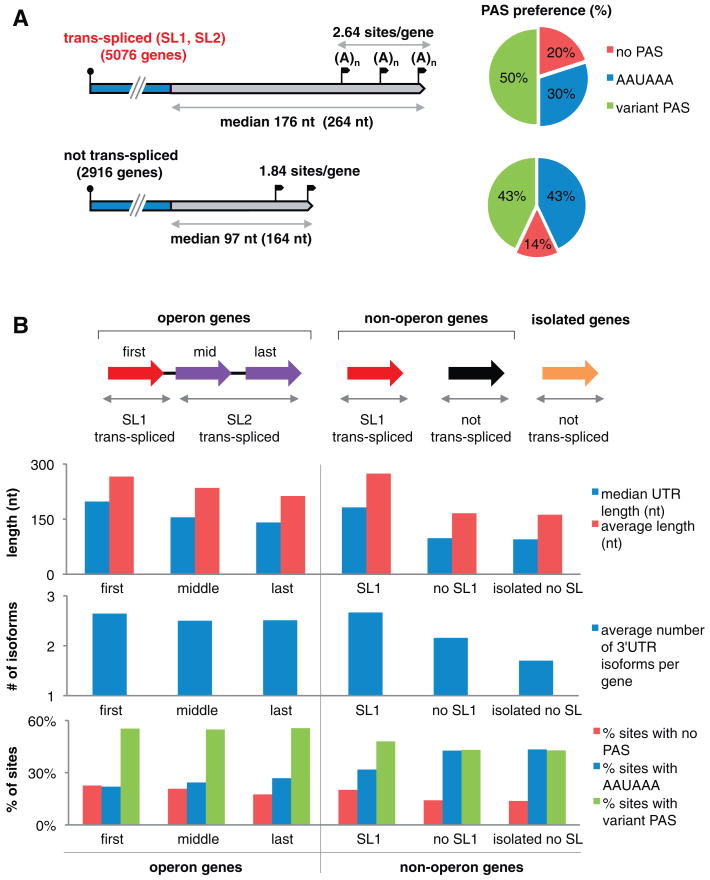
Because many C. elegans genes undergo trans-splicing of a splice leader (SL) to the 5′ end of a nascent transcript (16), we asked whether any properties of transcript 5′ and 3′ ends correlate (Fig. 2, A and B). About 15% of C. elegans genes belong to transcriptional units called operons, each containing two to eight genes that can be cotranscribed, cleaved into separate transcripts, polyadenylated, and trans-spliced with specific leaders (Fig. 2, A and B). The first gene in an operon is trans-spliced only to SL1; downstream genes are usually trans-spliced to 1 of 11 other SLs (SL2 to SL12), although we observed that two-thirds of these genes occasionally become trans-spliced to SL1. The processing of adjacent operon transcript ends (cleavage, polyA addition to the upstream transcript, and SL addition to the downstream transcript) is coupled mechanistically by machinery resembling the cis-splicing apparatus (17). Comparing 3′UTRs within operons, we observe that the “first” (SL1-spliced), “middle” (any gene between first and last), and “last” genes progressively decrease in average length (from 266 to 213 nt), number of 3′UTR isoforms per gene (from 2.64 to 2.51), and frequency of 3′UTRs with no PAS (from 23 to 18% in ∼1400 sites) (Fig. 2B).
Fig. 2.
3′UTRs in operons and trans-spliced versus non–trans-spliced mRNAs. (A) Trans-spliced (top) and non–trans-spliced (bottom) mRNAs: 3′UTR median (and average) lengths, number of 3′UTR isoforms per gene (polyA sites, black flags), and PAS preference (pie charts: % 3′UTRs with AAUAAA, variant PAS, and no PAS). (B) (Top) Schematic of operon (left, n = 574 operons), non-operon (center, n = 4348 genes), and isolated (right, n = 2098) genes. Initial operon genes (red) are SL1–trans-spliced; downstream genes (purple) usually acquire one of the other SLs (SL2 to SL12). Non-operon genes are either SL1–trans-spliced (red, n = 3530) or not trans-spliced (black, n = 818). Isolated genes (having no neighbors within 2 kb) are not trans-spliced (orange, n = 2098). (Bottom) 3′UTR lengths, number of isoforms, and PAS sites for operon and non-operon genes.
However, only a small fraction (13%) of the 7026 mainly SL1-spliced genes clearly belongs to an operon, and these genes differ notably from non-operon SL1-spliced genes in their usage of the canonical AAUAAA hexamer (22% of 1409 sites versus 32% of 10,879 sites, respectively). Furthermore, we observed the canonical PAS motif much more frequently in non–trans-spliced than in SL-containing transcripts (43% of 5131 sites versus 30% of 14,873 sites) (Fig. 2A). Whereas “standard” non–trans-spliced genes have ∼30% more 3′UTR isoforms per gene than “isolated” ones having no neighbor within 2 kb (2.4 versus 1.7), these non–trans-spliced genes are more similar to each other than to trans-spliced genes, because they have shorter and fewer 3′UTR isoforms and higher canonical PAS usage. Thus, trans-splicing within operons appears to enhance (directly or indirectly) the activity of noncanonical PAS sequences upstream, and trans-splicing at the 5′ end correlates with distinct properties at the 3′ end of the same transcript, independent of 5′-end processing downstream.
Unexpectedly, the 3′UTRome reveals polyadenylated transcripts for nearly all histone genes (fig. S12 and table S6). The major class of replication-dependent histones (H2a, H2b, H3, and H4) is not thought to be polyadenylated in metazoans; instead, their 3′ ends form a stem-loop structure that is recognized and cleaved several nucleotides downstream by U7 small nuclear ribonucleoprotein and factors such as stem-loop binding protein (18, 19). C. elegans has 61 cDNA-supported histone genes (9) that all harbor conserved sequences with 3′ stem-loop potential; however, they also contain conserved PAS elements downstream of the hairpin sequence (20). Because C. elegans histone transcripts have also been shown to terminate in the typical stem-loop structure and to be depleted in successive rounds of polyA selection (20), we were surprised to recover polyadenylated transcripts for 57 histone genes in multiple, independent data sets (fig. S12 and table S6). This finding suggests that, at least in C. elegans (and perhaps also in higher metazoans), the usual route for histone mRNA 3′-end processing may include initial cleavage and polyA addition at conserved PAS sites, followed by further processing to remove sequences downstream of the stem-loop.
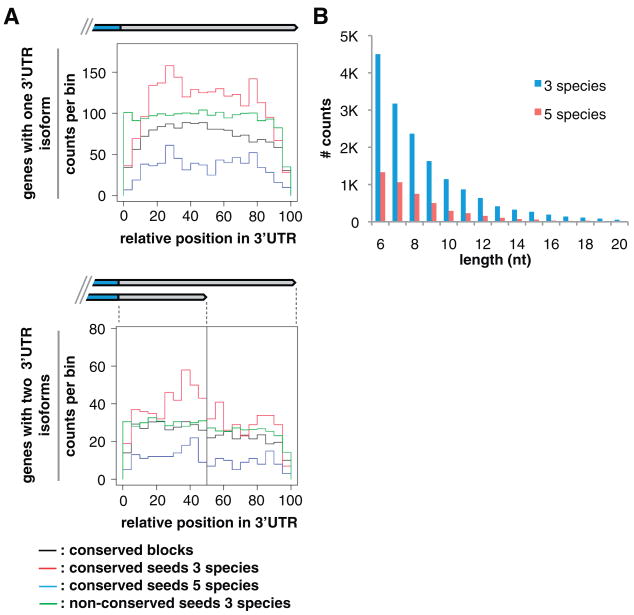
We searched 3′UTRs for conserved sequence motifs and other potential functional elements. We updated our atlas of predicted conserved miRNA targets for the 3′UTRome, using the PicTar algorithm with new 3- and 5-way multispecies alignments (Fig. 3, fig. S13, and table S7). Roughly half of the newly predicted sites match our previous predictions (21), but many sites are gained or lost (fig. S13A and table S7). These differences reflect improvements in both 3′UTR annotations and multispecies alignments, which increase the accuracy of conserved-seed site identification and signal-to-noise ratios (8). More than 3000 PAS motifs are positionally conserved among Caenorhabditis species, including within alternative 3′UTRs (fig. S13B). Thus, maintenance of multiple specific 3′ termini may be functionally important for some genes. Thousands of unexplained conserved sequence blocks of varying lengths within 3′UTRs (Fig. 3B and table S7) may represent previously unrecognized functional elements that await further characterization. In vivo Argonaute (ALG-1) binding sites (15) overlap significantly with predicted miRNA target sites but not with other conserved blocks (table S7), indicating that the latter are, overall, not directly related to microRNA function (8). For 1876 convergently transcribed neighboring genes, overlapping 3′ regions could pair as double-stranded RNA if coexpressed, potentially triggering endogenous small interfering RNA production (22) that could down-regulate cognate mRNAs (fig. S14 and data set S4).
Fig. 3.
Conserved sequence elements in 3′UTRs. (A) Histogram distributions of conserved sequence blocks (black, counts shown at 1/5th scale), conserved miRNA seeds in three (red; C. elegans, C. remanei, C. briggsae) and five (blue; C. elegans, C. remanei, C. briggsae, C. brenneri, C. japonica) species, and nonconserved miRNA seeds (green, 1/25th scale) along the normalized length of 3′UTRs, in genes with one isoform (top) or exactly two isoforms (bottom). For genes with one isoform, the length scale is 100%; for two isoforms, 0 to 50% represents the short-isoform span, and 51 to 100% indicates the span exclusive to the long isoform. Counts were binned by fraction of total length and, thus, varied in absolute length. (B) Length distribution (up to 20 nt) of conserved sequence blocks in 3′UTRs (excluding miRNA target and PAS sites), in three (blue; n = 16,204 conserved blocks) and five (red; n = 4758) species. See also table S7.
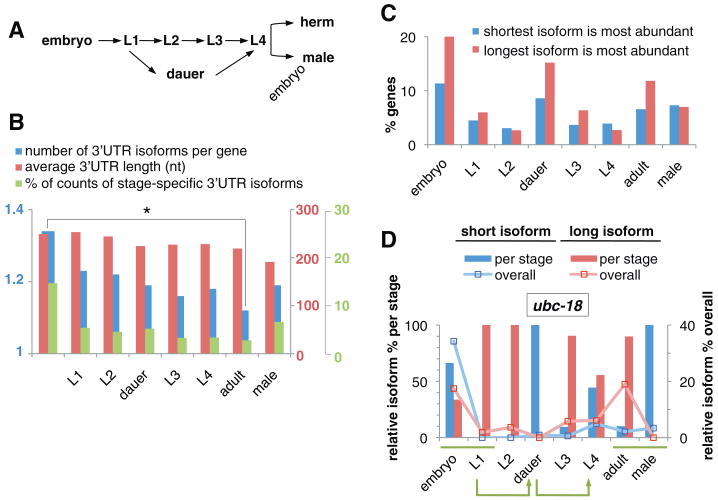
We examined alternative 3′UTR isoforms in different developmental stages (Fig. 4) and found a downward trend in average length and number of 3′UTRs per gene from the embryonic through the adult stage (Fig. 4, A and B). Among genes expressed in more than one developmental stage, embryos display the largest proportion of stage-specific 3′UTR isoforms, and these tend toward longer isoforms (Fig. 4, B and C, tables S8 and S9, and data set S5). Some genes switch 3′UTR length coincident with developmental transitions, most notably from embryo to L1, L1 to dauer entry, dauer exit to L4, and in adult hermaphrodites versus males (Fig. 4D, table S9, and data sets S5 and S6). Thus, 3′ UTR-mediated gene regulation may be widespread in the C. elegans embryo, and differential expression of alternative isoforms may represent a mechanism to engage or bypass 3′UTR-mediated regulatory controls in specific developmental contexts (23, 24).
Fig. 4.
3′UTRs during development. (A) C. elegans developmental transitions: embryogenesis, four larval stages, and adults. In unfavorable environments, L1 larvae arrest in dauer stage and can re-enter the life cycle as L4 larvae. herm, hermaphrodites. (B) The number of 3′UTR isoforms per gene decreases significantly during development (blue) (*p ∼ 0.004, permutation test). The average length of 3′UTRs decreases during development (red). Adult males have shorter average 3′UTRs than hermaphrodites. Embryos show more stage-specific 3′UTR isoforms for genes expressed during multiple developmental stages (green) (see table S8). (C) Proportion of genes showing stage-specific expression of alternative 3′UTR isoforms (see table S9). Embryos and dauers favor longer 3′UTR isoforms. (D) Differential 3′UTR-isoform expression during development (ubc-18 shown; see data sets S5 and S6 for details). The bar chart illustrates the relative abundance of short versus long 3′UTR isoforms for ubc-18 in each stage (sum per stage = 100%, left y axis). The line graph shows the relative abundance across all stages (sum per gene across all stages = 100%, right y axis). Green bars highlight differences in 3′UTR isoform usage in the embryo-to-L1 transition and between adult hermaphrodite and male stages. Green arrows indicate dauer entry and exit transitions.
The 3′UTRome compendium evidences support for multiple mechanisms of transcript 3′-end formation in C. elegans, including standard PAS-directed 3′-end formation from a large collection of PAS variants, regularly spaced “shadow” polyA addition sites devoid of recognizable signals, and both operon-dependent and -independent correlations between features at the 5′ and 3′ ends of the same or of consecutive transcripts that are consistent with the possibility that trans-splicing and 3′-end processing within a gene could occur by functionally linked mechanisms. We characterize thousands of previously unknown and alternative 3′UTR isoforms throughout development, define a comprehensive catalog of PAS elements, discover a surprising number of polyadenylated transcripts with no discernable PAS, and definitively document polyadenylation of histone transcripts. We also identify conserved sequence elements in 3′UTRs that may interact with trans-acting factors such as miRNAs and RNA-binding proteins, some of which occur within variable regions of alternative 3′UTRs. A collection of cloned 3′UTRs for several thousand C. elegans genes is available to the research community for high-throughput downstream analyses and in vivo studies (table S10 and data set S7) (8).
Supplementary Material
Acknowledgments
This work was supported in part by grants from NIH (U01-HG004276) to F.P., K.C.G., J.K.K., and N.R.; NIH grant (R00HG004515) to K.C.; Grants-in-Aid for Scientific Research from the Ministry of Education, Culture, Sports, Science and Technology of Japan to Y.K., S.S., and Y.S.; NIH (R01GM088565), Muscular Dystrophy Association and the Pew Charitable Trusts to J.K.K.; a gift from the Ellison Foundation to M.V. and Institute Sponsored Research funds from the DFCI Strategic Initiative in support of the CCSB; the Helmholtz-Alliance on Systems Biology (Max Delbrück Centrum Systems Biology Network) to S.D.M.; and the Intramural Research Program of NIH, National Library of Medicine to J.T.-M. and D.T.-M. We thank J. V. Moran, T. Blumenthal, A. Billi, D. Mecenas, and B. Bargmann for discussions; T. Shin'I and Exelixis for C. elegans cDNA traces; and, for technical assistance, T. Nawy and B. Brown (statistical analysis); R. Sachidanandam, R. Lyons, and S. Genik (deep sequencing); P. MacMenamin and D. Schaub (3′UTRome database); M. Morris (data submission); and L. Huang (stage analysis). 3′UTRome data sets are available from NCBI Trace Archive, dbEST, Sequence Read Archive, Gene Expression Omnibus, and modENCODE (8). See supporting online materials and methods for details. Annotations are displayed at NCBI AceView (www.aceview.org) (9) and www.UTRome.org (12).
Footnotes
www.sciencemag.org/cgi/content/full/science.1191244/DC1
Materials and Methods
Figs. S1 to S14
Tables S1 to S10
References
Data sets S1 to S7
References and Notes
- 1.de Moor CH, Meijer H, Lissenden S. Semin Cell Dev Biol. 2005;16:49. doi: 10.1016/j.semcdb.2004.11.007. [DOI] [PubMed] [Google Scholar]
- 2.Wickens M, Bernstein DS, Kimble J, Parker R. Trends Genet. 2002;18:150. doi: 10.1016/s0168-9525(01)02616-6. [DOI] [PubMed] [Google Scholar]
- 3.Bartel DP. Cell. 2009;136:215. doi: 10.1016/j.cell.2009.01.002. [DOI] [PMC free article] [PubMed] [Google Scholar]
- 4.He L, et al. Nature. 2005;435:828. doi: 10.1038/nature03552. [DOI] [PMC free article] [PubMed] [Google Scholar]
- 5.Chatterjee S, Pal JK. Biol Cell. 2009;101:251. doi: 10.1042/BC20080104. [DOI] [PubMed] [Google Scholar]
- 6.Stein L, Sternberg P, Durbin R, Thierry-Mieg J, Spieth J. Nucleic Acids Res. 2001;29:82. doi: 10.1093/nar/29.1.82. [DOI] [PMC free article] [PubMed] [Google Scholar]
- 7.Harris TW, et al. Nucleic Acids Res. 2010;38(Database issue):D463. doi: 10.1093/nar/gkp952. [DOI] [PMC free article] [PubMed] [Google Scholar]
- 8.See supporting online material for details.
- 9.Thierry-Mieg D, Thierry-Mieg J. Genome Biol. 2006;7(suppl. 1):S12.1. doi: 10.1186/gb-2006-7-s1-s12. [DOI] [PMC free article] [PubMed] [Google Scholar]
- 10.Dupuy D, et al. Genome Res. 2004;14:2169. doi: 10.1101/gr.2497604. [DOI] [PMC free article] [PubMed] [Google Scholar]
- 11.Reboul J, et al. Nat Genet. 2003;34:35. doi: 10.1038/ng1140. [DOI] [PubMed] [Google Scholar]
- 12.Mangone M, Macmenamin P, Zegar C, Piano F, Gunsalus KC. Nucleic Acids Res. 2008;36(Database issue):D57. doi: 10.1093/nar/gkm946. [DOI] [PMC free article] [PubMed] [Google Scholar]
- 13.Hillier LW, et al. Genome Res. 2009;19:657. doi: 10.1101/gr.088112.108. [DOI] [PMC free article] [PubMed] [Google Scholar]
- 14.Shin H, et al. BMC Biol. 2008;6:30. doi: 10.1186/1741-7007-6-30. [DOI] [PMC free article] [PubMed] [Google Scholar]
- 15.Zisoulis DG, et al. Nat Struct Mol Biol. 2010;17:173. doi: 10.1038/nsmb.1745. [DOI] [PMC free article] [PubMed] [Google Scholar]
- 16.Blumenthal T, et al. Nature. 2002;417:851. doi: 10.1038/nature00831. [DOI] [PubMed] [Google Scholar]
- 17.Liu Y, Huang T, MacMorris M, Blumenthal T. RNA. 2001;7:176. doi: 10.1017/s1355838201002333. [DOI] [PMC free article] [PubMed] [Google Scholar]
- 18.Wang ZF, Whitfield ML, Ingledue TC, Dominski Z, Marzluff WF. Genes Dev. 1996;10:3028. doi: 10.1101/gad.10.23.3028. [DOI] [PubMed] [Google Scholar]
- 19.Marzluff WF, Wagner EJ, Duronio RJ. Nat Rev Genet. 2008;9:843. doi: 10.1038/nrg2438. [DOI] [PMC free article] [PubMed] [Google Scholar]
- 20.Keall R, Whitelaw S, Pettitt J, Müller B. BMC Mol Biol. 2007;8:51. doi: 10.1186/1471-2199-8-51. [DOI] [PMC free article] [PubMed] [Google Scholar]
- 21.Lall S, et al. Curr Biol. 2006;16:460. doi: 10.1016/j.cub.2006.01.050. [DOI] [PubMed] [Google Scholar]
- 22.Okamura K, Balla S, Martin R, Liu N, Lai EC. Nat Struct Mol Biol. 2008;15:581. doi: 10.1038/nsmb.1438. [DOI] [PMC free article] [PubMed] [Google Scholar]
- 23.Lund E, Liu M, Hartley RS, Sheets MD, Dahlberg JE. RNA. 2009;15:2351. doi: 10.1261/rna.1882009. [DOI] [PMC free article] [PubMed] [Google Scholar]
- 24.Giraldez AJ, et al. Science. 2006;312:75. doi: 10.1126/science.1122689. published online 16 February 2006. [DOI] [PubMed] [Google Scholar]
Associated Data
This section collects any data citations, data availability statements, or supplementary materials included in this article.


