

Abstract
Converging evidence supports the hypothesis that an anterolateral processing pathway mediates sound identification in auditory cortex, analogous to the role of the ventral cortical pathway in visual object recognition. Studies in nonhuman primates have characterized the anterolateral auditory pathway as a processing hierarchy, composed of three anatomically and physiologically distinct initial stages: core, belt, and parabelt. In humans, potential homologs of these regions have been identified anatomically, but reliable and complete functional distinctions between them have yet to be established. Because the anatomical locations of these fields vary across subjects, investigations of potential homologs between monkeys and humans require these fields to be defined in single subjects. Using functional MRI, we presented three classes of sounds (tones, band-passed noise bursts, and conspecific vocalizations), equivalent to those used in previous monkey studies. In each individual subject, three regions showing functional similarities to macaque core, belt, and parabelt were readily identified. Furthermore, the relative sizes and locations of these regions were consistent with those reported in human anatomical studies. Our results demonstrate that the functional organization of the anterolateral processing pathway in humans is largely consistent with that of nonhuman primates. Because our scanning sessions last only 15 min/subject, they can be run in conjunction with other scans. This will enable future studies to characterize functional modules in human auditory cortex at a level of detail previously possible only in visual cortex. Furthermore, the approach of using identical schemes in both humans and monkeys will aid with establishing potential homologies between them.
Introduction
Convergent evidence indicates that sound recognition in the macaque is mediated by an anterolaterally directed cortical pathway. This pathway forms an anatomical hierarchy: projections extend from auditory core cortex via anterolateral belt to rostral parabelt and ventrolateral prefrontal cortex (Romanski et al., 1999; Kaas and Hackett, 2000; Hackett et al., 2001). This hierarchy is also expressed functionally; whereas core neurons respond selectively to pure tones (Merzenich and Brugge, 1973), belt responses require band-passed noise (BPN) (Rauschecker et al., 1995; Petkov et al., 2006; Kusmierek and Rauschecker, 2009), and parabelt neurons respond to more complex sounds such as species-specific vocalizations (Poremba et al., 2003; Petkov et al., 2008; Kikuchi et al., 2010). Ventrolateral prefrontal areas respond strongly to vocalizations (Romanski and Goldman-Rakic, 2002; Averbeck and Romanski, 2006) and possibly task-related aspects of sounds (Cohen et al., 2009).
This anatomical hierarchy is thought to be conserved across species: human core [corresponding to Brodmann area (BA) 41 (Hackett et al., 2001)] and belt and parabelt regions (Sweet et al., 2005) are reliably identified using the same techniques as in the monkey. Functionally, human core and belt have been dissociated using stimulus preferences defined in the macaque (Wessinger et al., 2001). However, while more anterolateral regions of human auditory cortex are known to respond well to species-specific vocalizations (i.e., human speech and voices) (Binder et al., 2000; Scott et al., 2000; Belin et al., 2000; Leaver and Rauschecker, 2010), a clear functional delineation of belt and parabelt in humans has not yet been performed. Demonstration of such a boundary would argue for at least three discrete processing stages in human auditory cortex, an important step toward assessing potential homologies between human and macaque. Furthermore, the inability to delineate belt from parabelt regions in humans restricts our ability to interpret other human neuroimaging data. For example, several studies demonstrate selectivity for several types of speech sounds in anterolateral auditory regions (Obleser et al., 2006; Joanisse et al., 2007; Leaver and Rauschecker, 2010), but at present it is unclear whether these regions belong to belt or parabelt.
Besides the fact that a clear belt/parabelt boundary has not been established in humans, it is also well known that the anatomical locations of auditory subregions vary widely between individuals (Penhune et al., 1996; Morosan et al., 2001; Rademacher et al., 2001; Sweet et al., 2005). When investigating processing in these subregions, then, using a functional localization scheme would assure data to be functionally consistent across studies. Human visual cortex studies routinely identify regional boundaries by means of visual field mapping (Engel et al., 1997; Sereno et al., 2001; Wandell et al., 2007). In auditory cortex, however, frequency gradient reversals can demarcate cochleotopic areas only at the same hierarchical level (Merzenich and Brugge, 1973), but not between levels. The latter boundaries correlate instead with bandwidth and spectrotemporal complexity (Rauschecker et al., 1995). Thus, we predicted the borders between core, belt, and parabelt could be functionally localized in single human subjects using spectrotemporal stimulus preferences defined in the macaque.
Materials and Methods
Subjects.
The Georgetown University Institutional Review Board gave approval for all experiments, and subjects gave written informed consent before participating. A total of 13 subjects participated in this investigation (18–36 years of age, 5 males). All subjects were right handed, reported no history of hearing problems or neurological illness, and spoke American English as their native language.
Stimuli.
Pure-tone (PT), BPN, and white noise (WN) stimuli were generated using MATLAB (MathWorks). PT and BPN stimuli had center frequencies of 500, 2000, and 8000 Hz, and BPN stimuli had a bandwidth of 1 octave. Limiting the species-specific vocalization category to vowel (VOW) stimuli allowed all three sound classes to be well matched in duration and temporal dynamics. Additionally, VOW stimuli provide a logical progression in spectral complexity in that they contain combinations of BPN, analogous to BPN containing combinations of PT (Fig. 1A). VOW stimuli were isolated from a database of recordings available online (Hillenbrand et al., 1995). The vowel portions of these waveforms were identified, and sections that were largely steady state were selected on the basis of visual inspection. All stimuli were root-mean-square normalized in amplitude and were presented as a short block (i.e., 166 ms of sound followed by 166 ms of silence, repeated for 3 s). Six subjects were presented with PT, BPN, and VOW stimuli; seven subjects were presented with PT, BPN, VOW, and WN stimuli.
Figure 1.
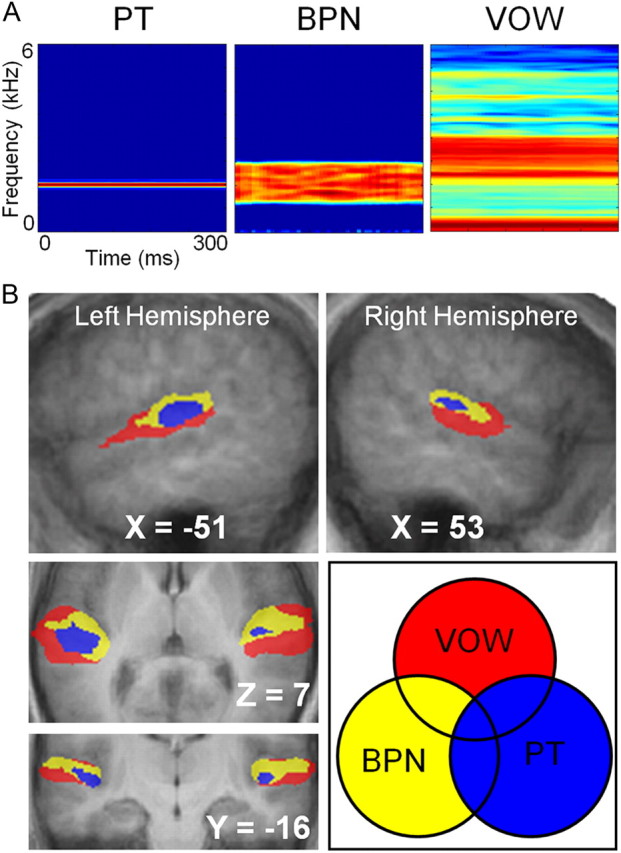
Three functionally discrete regions identified in human auditory cortex using BOLD imaging and sounds with different spectral complexity. A, Example stimuli used. Subjects were presented with PT, BPN, and species-specific vocalization (VOW) stimuli, based on the ability to differentiate core, belt, and parabelt using these stimulus classes in previous nonhuman primate studies. B, Random-effects group analysis (n = 13). A hierarchy of three functionally separable regions is clearly visible in each hemisphere. PT activation (blue) was centered on Talairach coordinates [48, −20, 7] and [−45, −24, 8]. Adjacent voxels responded to BPN but not PT (yellow), and further regions of cortex responded to VOW, but not BPN or PT. Minimum t value for all conditions is 9.8.
Data acquisition.
All MRI data were acquired at the Center for Functional and Molecular Imaging at Georgetown University on a 3.0 tesla Siemens Trio Scanner using whole-head echo-planar imaging sequences (flip angle = 90°, TE = 30 ms, FOV = 205, 64 × 64 matrix). In six subjects, a single-channel circularly polarized head coil was used, and in the remaining seven subjects, a 12-channel head coil was used. A sparse sampling paradigm (Edmister et al., 1999) was used in which image acquisition is clustered into a portion of the total repetition time (TR = 7500 ms; TA = 2000 ms). Stimuli were presented during the remaining silent portion of the TR (5500 ms), starting 1000 ms after the offset of a volume acquisition. Following functional scans, high-resolution (1 × 1 × 1 mm3) anatomical images (MPRAGE) were acquired. Auditory stimuli were presented through STAX electrostatic earphones at a comfortable listening volume (∼65–70 dB) worn inside ear defenders giving ∼26 dB attenuation. One stimulus block was presented on each trial. While in the scanner, subjects were asked to perform a passive listening task in which they simply attended to the presented stimuli. This task was chosen over an oddball task to maintain the short scan duration. Each condition was presented 30 times in random order, for a total of 120 volumes (PT, BPN, VOW, and SIL conditions), or 150 volumes (PT, BPN, VOW, WN, and SIL conditions).
Data analysis.
Data were analyzed using BrainVoyager QX 2.1.0 (Brain Innovation), SPSS, and Matlab (The MathWorks). Functional images were first coregistered to their corresponding anatomical images, and then both sets of images were spatially normalized to the Talairach atlas. The first two volumes (14 s) of each functional run were discarded, and the remaining images were preprocessed for motion correction, linear trend removal, and spatial smoothing using an 8 mm Gaussian kernel. Whole-head statistical maps were calculated for each subject individually using fixed-effects general linear models and then submitted to a second-level random-effects group analysis. Activation for each individual condition is reported relative to the baseline value, defined as the average value for each voxel over all acquisitions. All statistical thresholds are corrected to p < 0.05 based on cluster extent, using a Monte-Carlo simulation of the data (1000 iterations).
Results
Group analysis identifies three functionally discrete regions in auditory cortex
In a random-effects group analysis, we included scans from all 13 subjects for PT, BPN, and VOW. To visualize the activation pattern evoked by each stimulus condition, we produced activation maps for each condition relative to baseline. Because statistical maps vary with the chosen statistical threshold, we chose to set our threshold such that the volume of activation to the PT condition was consistent with values reported for auditory core (∼1800 mm3 averaged across hemispheres) in previous human anatomical studies (Penhune et al., 1996; Rademacher et al., 2001). This chosen threshold was restricted to be at least p < 0.05, though it ultimately was much more restrictive. This approach has also been used in several recent functional neuroimaging studies of nonhuman primates (Petkov et al., 2006, 2008; Kayser et al., 2008).
We then applied the same threshold to activation maps for BPN and VOW. To determine whether a functional hierarchy as identified previously in nonhuman primates could be identified, we created regions of interest (ROIs) based on logical combinations of PT, BPN, and VOW responses (Fig. 1B). First, since auditory core cortex is known to respond well to PT, we defined the set of all PT-responsive voxels to be auditory core. These voxels, shown in blue in Figure 1B, were located primarily in bilateral Heschl's gyri, in good agreement with anatomical expectations based on coordinates (Penhune et al., 1996; Rivier and Clarke, 1997). We also calculated the overlap of these voxels with cytoarchitectonic probability maps of three areas (Te 1.0, Te 1.1, Te 1.2), which together are thought to represent BA 41 (consistent with definitions for human “core”) (Hackett et al., 2001), and are distributed with the Anatomical Toolbox for SPM (Morosan et al., 2001; Rademacher et al., 2001; Eickhoff et al., 2005, 2007). We found that as much as 76% of our group-defined PT responsive voxels overlapped with the conjunction of the three maps. More specifically, 75% were still found to overlap with the conjunction of only regions Te 1.0 and Te 1.1. Very few PT-responsive voxels extended into region Te 1.2, arguing that this subfield may be more consistent with belt than core (see Discussion). In a second ROI definition, we included all voxels responding to BPN, and then removed any voxels shared with PT activation (thus already assigned to auditory core cortex). This logical combination (BPN NOT PT) is the behavior to be expected from “belt” regions. These voxels were located in cortex adjacent (both medial and lateral) to our defined auditory core cortex ROI. Finally, we created a third region consisting of those voxels that responded to VOW, and then excluded all voxels already assigned to one of the other ROIs [VOW NOT (BPN OR PT)]. This response profile represents the behavior expected from rostral “parabelt” regions, in particular those responsive to VOW. These voxels were located in cortex adjacent to the belt ROI. Rather than expanding symmetrically, however, these voxels were located primarily anterior, lateral, and ventral to the adjacent “belt” ROI.
We further tested whether this progression from simple to complex selectivity in the anterolateral direction was significant by running statistical comparisons directly between the conditions in our group study. Figure 2 shows the results of contrasts for both BPN > PT and VOW > BPN, and the sizes and coordinates for the resulting clusters are reported in Table 1. These contrasts yielded large significant activations at p < 0.05. As can be seen in the series of slices, the BPN > PT contrast (yellow) yields activation primarily restricted to both the medial and lateral extents of Heschl's gyrus in each hemisphere. This activation overlaps our PT-responsive region in the previous analysis. This indicates that complex stimuli such as BPN can evoke greater activation in core than PT stimuli. We interpret this to indicate that more neurons in core, each responding to select frequencies contained in the BPN, are recruited by the spectrally wider BPN. Additionally, the VOW > BPN contrast (red) yields activation further lateral, anterior, and ventral to the BPN > PT contrast, also seen in the coordinates listed in Table 1. The two contrasts share very little overlap (orange).
Figure 2.
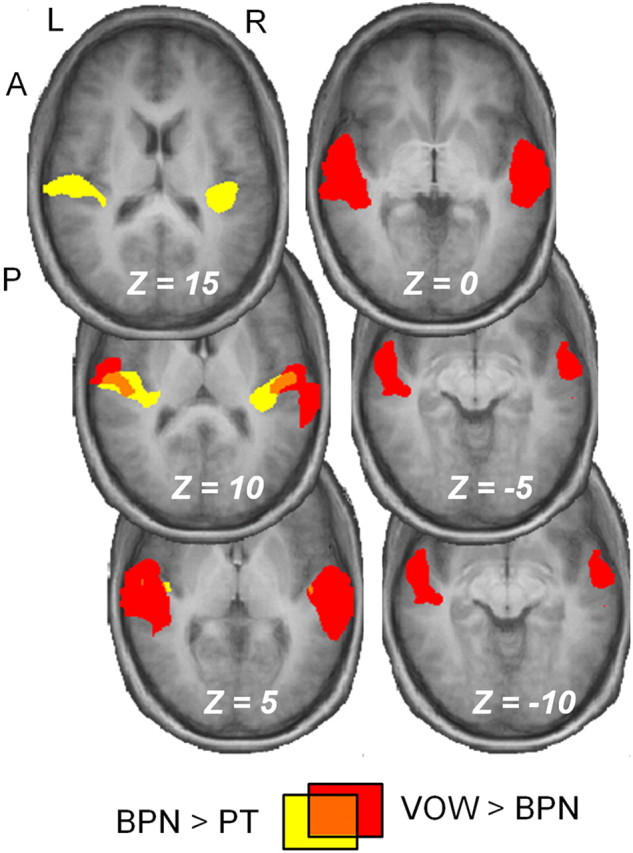
A progression from simple to complex selectivity in the anterolateral direction. A BPN > PT contrast (yellow) yielded activation largely restricted to areas adjacent to the medial and lateral extents of Heschl's gyrus in each hemisphere. The VOW > BPN contrast yielded significant activation in anterolateral aspects of the superior temporal gyrus. The two contrasts share little overlap (orange). Thresholds were p < 0.05 for both contrasts, and the sizes and Talairach coordinates of the resulting clusters are reported in Table 1.
Table 1.
Activation volume and location for contrasts in the group random-effects analysis
| Contrast | Size (mm3) | x | y | z |
|---|---|---|---|---|
| BPN > PT | 3046 | −38 | −25 | 12 |
| 3934 | 47 | −21 | 12 | |
| VOW > BPN | 11,928 | −56 | −19 | 3 |
| 11,884 | 53 | −17 | 2 | |
| VOW > WN | 1940 | −56 | −15 | 3 |
| 265 | 56 | −6 | −4 | |
| 168 | 48 | −24 | 1 |
The threshold for all contrasts is p < 0.05 corrected, with a minimum of 5 contiguous voxels. For BPN > PT and VOW > BPN contrasts, n = 13, and for VOW > WN, n = 7.
Hierarchical organization is consistent across subjects
While the group analysis supports the existence of a tiered hierarchy and a general progression from dorsomedial to anterolateral auditory cortex, it is well known that the specific anatomical locations of auditory cortical fields vary widely across subjects (Penhune et al., 1996; Rademacher et al., 2001; Sweet et al., 2005). This raises the question of whether the group analysis is representative of the functional hierarchy also in individual subjects. We therefore reanalyzed our data, localizing ROIs selective for the different sound classes in each subject individually, followed by a group analysis of the ROI parameters to test whether the relative functional organization was consistent across subjects.
To identify the auditory hierarchy in individual subjects, we created maps similar to the group analysis of Figure 1B for each of our 13 subjects. The statistical threshold was set independently for each subject using the same criterion as for the group (i.e., ∼1800 mm3 averaged for the PT condition across hemispheres). Thresholds were set via minimum t statistic, and the values for each subject are reported in Table 2. For each subject, the chosen t statistic corresponded to at least p < 0.05, but for most subjects the threshold was much more restrictive. Three representative examples of these maps are shown as a series of axial sections in Figure 3. In the resulting images, bilateral activation was observed in each subject for all three experimental conditions. Visual inspection of these maps confirmed that the functional organization in all imaged subjects qualitatively matched that of Figure 1B, but significant variability in locations and size can be seen across subjects. To quantify these individual datasets, we first calculated activation volume as a function of stimulus condition and hemisphere for each subject. For those cases in which more than one cluster per hemisphere was observed, volume was recorded as the sum over all clusters within each hemisphere. The resulting values for each subject are reported in Table 2, and the average values are plotted in Figure 4A. Repeated-measures ANOVA indicated a significant main effect of stimulus condition (p < 0.001). Post hoc paired t tests confirmed highly significant (p < 0.001) differences in activation volumes between all three stimulation conditions. While there was no main effect of hemisphere, post hoc paired t tests indicated a significant (p < 0.01) difference between hemispheres for PT, but not for BPN or VOW. For PT, the left-hemisphere volume was greater than the right-hemisphere volume, consistent with previous anatomical (Penhune et al., 1996; Rademacher et al., 2001) and functional (Wessinger et al., 2001) results. Inspection of Table 2 also confirms that the activation volume between conditions increases from PT to BPN to VOW in both hemispheres for all subjects.
Table 2.
Activation volume in each subject increases with increasing spectral complexity
| Subject | Threshold (min t) | PT-LT (mm3) | PT-RT (mm3) | BPN-LT (mm3) | BPN-RT (mm3) | VOW-LT (mm3) | VOW-RT (mm3) | WN-LT (mm3) | WN-RT (mm3) |
|---|---|---|---|---|---|---|---|---|---|
| 1 | 8.7 | 2125 | 1487 | 5706 | 5851 | 7573 | 7300 | NA | NA |
| 2 | 8.4 | 1814 | 1802 | 5654 | 4579 | 8817 | 7189 | NA | NA |
| 3 | 4.5 | 1726 | 1924 | 5337 | 7993 | 11,501 | 12,284 | NA | NA |
| 4 | 6.7 | 2279 | 1444 | 4822 | 3531 | 6729 | 5899 | NA | NA |
| 5 | 9.4 | 792 | 2777 | 2189 | 4052 | 5890 | 8063 | NA | NA |
| 6 | 4.4 | 2077 | 1600 | 4869 | 4861 | 14,467 | 13,393 | NA | NA |
| 7 | 9.9 | 3021 | 586 | 3896 | 1524 | 8302 | 2764 | 3200 | 2386 |
| 8 | 10.1 | 2747 | 862 | 3039 | 743 | 8440 | 4916 | 4199 | 3460 |
| 9 | 3.0 | 1456 | 2056 | 10,329 | 13,871 | 21,403 | 27,006 | 9898 | 12,572 |
| 10 | 7.6 | 2346 | 1262 | 6585 | 3156 | 7543 | 4891 | 9137 | 5757 |
| 11 | 5.5 | 2816 | 754 | 3679 | 1140 | 9350 | 6308 | 2685 | 2327 |
| 12 | 5.2 | 2341 | 1135 | 2643 | 2653 | 6913 | 6161 | 2456 | 2958 |
| 13 | 4.4 | 2360 | 1226 | 5784 | 6923 | 9113 | 14,192 | 5016 | 5398 |
| Mean | 6.7 | 2146 | 1455 | 4964 | 4683 | 9695 | 9259 | 5227 | 4980 |
| SE | 0.7 | 166 | 165 | 582 | 974 | 1155 | 1763 | 1159 | 1368 |
The threshold for each subject was chosen such that the volume of their average PT activation across hemispheres was consistent with average human auditory core volumes reported in previous anatomical studies.
Figure 3.

Functional organization in individual subjects. The three functionally differentiable regions identified in the group were also consistently identified in all 13 subjects in each hemisphere. Three representative subjects are shown here. Thresholds varied by subject and are reported in Table 2.
Figure 4.

Quantification of single-subject analysis. A, Activation volume by stimulus condition across subjects. B, Quantification of the spatial overlap between stimulus conditions. Matrix values indicate the percentage of voxels within the region of interest displayed along the horizontal axis that are also activated by the conditions shown along the vertical axis. Dark colors indicate a low percentage of overlap between conditions (i.e., few active voxels in common), while light colors indicate a high percentage of overlap. C, Average location of active voxels for each condition across subjects (medial–lateral coordinates are reported as absolute values because both hemispheres were collapsed). *p < 0.05, **p < 0.01, ***p < 0.001.
Next, we quantified the spatial overlap between these activation patterns by calculating the percentage of active voxels shared between each of the stimulus conditions. Because no significant main effect of hemisphere was observed in the preceding analysis, data were collapsed across hemispheres. In each subject, we defined three ROIs, one for each of the three testing conditions and containing all voxels active for the condition. Importantly, here we include all voxels responding to each condition, and do not apply any of the logical operations described for Figure 1. The matrix shown in Figure 4B reports the percentage of voxels within each of these regions of interest (indicated on the horizontal axis) that are also activated by the stimulus condition indicated on the vertical axis. Thus, the far left column of this matrix indicates that a very high percentage of PT-responsive voxels are also activated by both BPN and VOW stimuli, as might be predicted for auditory core. The middle column indicates that only a low percentage of BPN-responsive voxels responded to PT (bottom), as predicted for belt areas, whereas a very high percentage of these voxels were also activated by VOW stimuli (top). Finally, the far right column shows that PT and BPN stimuli activated only small subsets of VOW-responsive voxels (bottom and middle). This pattern of responses strongly supports the conclusion that these areas form a functional hierarchy: early stages are activated by both simple and complex stimuli (the latter containing simple features that can drive neurons in these early areas), whereas activation of later stages requires sufficiently complex stimuli.
Finally, we determined whether the stimulus condition had a significant effect on the location of activation in individual subjects. For each subject, we calculated the mean Talairach coordinates over all voxels activated by each stimulus condition. Absolute values were used for x-coordinate locations to account for the sign difference across hemispheres. These values are plotted in Figure 4C. Repeated-measures ANOVA with factors for stimulus condition, hemisphere, and coordinates indicated significant main effects of stimulus condition (p < 0.05) and coordinates (p < 0.05). No significant main effect was observed for hemisphere nor for the interaction condition × hemisphere. The data were then collapsed across hemisphere, and post hoc paired t tests confirmed that the location of VOW activation was significantly more lateral (p < 0.05), rostral (p < 0.01), and ventral (p < 0.05) to the location of PT activation. No significant displacement was observed between PT and BPN conditions in any direction, reflecting the fact that BPN responses were observed surrounding PT responses on all sides. These results are consistent with the assumption that a ventral auditory processing stream extends from auditory core areas of cortex via anterior auditory belt to anterior and lateral aspects of the superior temporal gyrus (i.e., rostral parabelt).
While the relative functional organization across subjects is largely consistent with the results of our group random-effects analysis, we noted a wide variation in the absolute locations of the ROIs across subjects. Examples of this discrepancy are shown in Figure 5A in a series of slices for the same subjects as in Figure 3. This illustrates that the group ROI captures only a small portion of the variability of ROIs across subjects. To quantify how well group-defined and individual ROIs matched, we calculated for each subject the fraction of voxels in the individually defined ROIs that were also present in the group ROIs for the PT, BPN, and VOW conditions (Fig. 5B). The resulting matrix shows an average 24% overlap between each subject's ROI and the group ROI for PT, 51% for BPN, and 56% for VOW. These results show that using a localizer-based approach when studying higher-level auditory processing in humans can provide an up to fourfold improvement in accounting for interindividual variability.
Figure 5.

Benefits of functional localization in individual subjects compared to group analysis. A, In three example subjects, the mismatch between PT activation defined by the group analysis and the single-subject is apparent. B, Fraction of voxels in single-subject ROIs that are also present in the group-defined ROI. Minimum t value was 9.8 for the group, and single-subject values are as listed in Table 2.
Organization reflects sensitivity to spectral combinations, not just increasing bandwidth
While our stimuli were chosen to increase in spectral complexity to demonstrate hierarchical processing, they also displayed a simple increase in spectral bandwidth. This leaves open the possibility that any increases in activation volume we observed for PT, BPN, and VOW were simply a result of increasing bandwidth, rather than increasing spectral complexity. If this were correct, further increasing bandwidth to WN should yield maximal activation. In a control experiment, we tested this possibility by adding WN stimuli, which have maximal bandwidth but minimal spectral complexity. In a random-effects group analysis of the seven subjects presented with WN stimuli, the VOW > WN contrast yielded significant (p < 0.05) activation in anterolateral auditory cortex. The resulting cluster sizes and coordinates are listed in Table 1. These clusters are similar in location to those of the VOW > BPN contrast.
We then conducted single-subject analyses of these scans including WN, and the results are shown in Figure 6. After quantifying the volume of activation by stimulus condition in each individual subject, repeated-measures ANOVA confirmed a significant effect of stimulus condition (p < 0.001). Again we found no significant effect of hemisphere, so data were collapsed across hemisphere. As in Figure 4A, activation volume increased from PT to BPN to VOW. By contrast, WN stimuli activated a significantly smaller volume than VOW stimuli (p < 0.05, post hoc paired t test). These results demonstrate that the findings above do not simply reflect a monotonic increase in preferred bandwidth from PT to WN, but more likely reflect increases in preferred spectral complexity that are relevant for the extraction or identification of particular types of sound.
Figure 6.

Organization based on spectral complexity. In an additional control experiment activation by WN was compared with activation by PT, BPN, and VOW. The results demonstrate that the regional differences do not merely depend on increasing bandwidth, but depend instead on spectral complexity, similar to the monkey. Activation volume across subjects (n = 7) for each stimulus condition is shown. Minimum t values for each subject are those listed in Table 2. *p < 0.05, **p < 0.01, ***p < 0.001.
Discussion
Building on previous work that demonstrated similar anatomical organization between macaque and human auditory cortex (Hackett et al., 2001; Sweet et al., 2005), we investigated whether common functional organization could be identified in the two species as well. In a sparse-sampling fMRI study, we presented human subjects with the same sound classes typically associated with the core, belt, and parabelt regions in studies of the macaque: PT, BPN, and species-specific vocalization (VOW). We found that PT elicited activation primarily within the caudomedial extent of Heschl's gyrus. BPN bursts also activated this region, as well as adjacent rostromedial and dorsolateral cortex. Finally, VOW activated both of the preceding regions, as well as anterolateral regions in the superior temporal plane (“planum temporale”), superior temporal gyrus, and superior temporal sulcus. We found this organization to be robust and consistent in both group and single-subject analyses.
The activations we report are more restricted in their extent through the superior temporal lobe than have previously been reported in macaques for similar stimuli (Poremba et al., 2003). This is due to our use of statistical thresholds beyond the customarily used p < 0.05 (corrected for multiple comparisons). While we expected to observe the strongest responses to PT in core, it is possible for PT to still evoke (smaller) activations in other regions. This was our motivation in scaling the threshold for each subject such that their PT activation volume matched anatomical expectations.
Overall, the locations and sizes of the regions identified by our functional analyses are in good agreement with those reported for human core, belt, and parabelt in recent anatomical studies (Hackett et al., 2001; Sweet et al., 2005). Additionally, we found that 75% of our PT-responsive voxels (which we define as core) overlapped with areas Te 1.0 and Te 1.1 (Morosan et al., 2001), but very few with area Te 1.2. This result adds support that this area is more consistent with the human belt, rather than core, which has been argued both anatomically (Wallace et al., 2002) and functionally (Hall et al., 2006).
Given the observed anisotropy in VOW activation, which favors anterior and lateral directions, we infer that this activation more specifically represents the rostral subdivision of the parabelt described previously in the monkey (Hackett et al., 1998). By contrast, BPN activation was more symmetrical between medial and lateral belt, consistent with findings in the macaque (Kusmierek and Rauschecker, 2009). The lack of any significant left-hemisphere lateralization for our speech stimuli (VOW) was somewhat surprising, though compatible with a recent meta-analysis of fMRI studies using speech sounds (Turkeltaub and Coslett, 2010). The authors reported equivalent bilateral activity for sublexical speech segments with left lateralization only being driven by tasks requiring explicit attention to phonology. Thus, the lack of any left lateralization for VOW stimuli in the present data may be explained by the passive listening task used.
In addition to being speech sounds, the VOW stimuli we presented are also human voices. This raises the question of how the extent of our VOW-selective responses compare to the “temporal voice areas” (TVAs) documented in previous results (Belin et al., 2000). As could be expected, the results of our VOW > BPN contrast are in good agreement with the locations of the TVA bilaterally [Talairach coordinates in our study were [−56, −19, 3] and [53, −17, 2] compared with [54, −13, 4] and [−60, −23, 6] (Belin et al., 2000)]. Additionally, both sets of coordinates from Belin et al. (2000) fall within our reported parabelt region. We interpret this agreement to reflect the increased spectrotemporal complexity required to activate further anterolateral regions of auditory cortex, with the condition that this complexity is relevant for vocal communication.
Expanding on prior work (Wessinger et al., 2001), we demonstrated a series of hierarchically related auditory cortical fields in the human. Early stages of this hierarchy are activated by both simple and complex stimuli, whereas activation of later stages requires stimuli containing sufficiently complex combinations of features. In such a scheme, neurons in primary and primary-like core areas of auditory cortex (while narrowly tuned to specific frequencies) are not necessarily exclusively responsive to tonal stimuli alone but respond to more complex sounds as well, as long as these sounds contain energy within the neurons tuning range (Rauschecker and Tian, 2004). Including WN stimuli in some of our scans contributed an important control condition by showing that WN stimuli activate a smaller cortical volume than VOW stimuli. This demonstrated that the increases in activation volume observed were due to spectral complexity rather than a simple increase in the number and range of frequencies present. This selectivity of higher-order areas is due to nonlinear integration in frequency and time (“combination sensitivity”) (Suga et al., 1979; Margoliash and Fortune, 1992; Rauschecker and Scott, 2009).
In the present study, potential functional correlates of core, belt, and rostral parabelt regions were identified robustly in single subjects using a relatively short duration scan (∼15 min), making the paradigm suitable as a functional localizer for studies with other types of complex stimuli. The need for auditory functional localization methods is evident from the existing literature (Formisano et al., 2003; Petkov et al., 2006; Fedorenko et al., 2010), and highlighted by the variability in ROI size and location in individual subjects that was not well captured by the group analysis. This variability in functional location severely limits the ability of auditory fMRI studies to investigate the sound recognition process at different levels of auditory processing. Our paradigm overcomes this limitation and will enable future studies to characterize functional modules in human auditory cortex at each stage of the auditory hierarchy, a level of detail previously possible only in visual cortex. Furthermore, the approach of using identical schemes in both humans and monkeys will aid with establishing potential homologies between them. In the case of monkeys, however, our human speech sounds (VOW) would presumably be replaced with conspecific vocalizations (perhaps coos, which exhibit spectrotemporal complexity beyond BPN similar to VOW).
The direct contrasts between conditions (i.e., BPN > PT, VOW > BPN, and VOW > WN) ensure that the progression of selectivity we report is statistically significant. However, when localizing the core, belt, and parabelt regions in individual subjects, we still prefer to define these based on the logical combinations shown in Figures 1 and 3. The reason is that we expect the “boundary” to have some finite width. Defining the boundary using only significantly different voxels will necessarily ignore voxels that are in between regions where responses are in transition from one sound class to the next. This method is comparable to that used to define the core/belt boundary in electrophysiology studies from our laboratory (Tian et al., 2001; Kusmierek and Rauschecker, 2009), dividing regions logically based on a preference index.
Several previous studies have attempted to map auditory fields via tonotopic or cochleotopic organization (Formisano et al., 2003; Talavage et al., 2004; Humphries et al., 2010). While such studies have indeed been able to confirm the existence of multiple cochleotopic areas in the auditory cortex of humans, the monkey literature would suggest that these areas may correspond to subfields within one level, e.g., core (i.e., A1, R, and RT) or belt (AL, ML, CL), but cannot distinguish boundaries between adjacent levels of the hierarchy. The boundaries between hierarchical levels are instead predicted to correlate with differences in preferred bandwidth, or perhaps spectral complexity (Rauschecker et al., 1995). The work of Wessinger et al. (2001) provided early evidence for a core/belt boundary in the human. Our present results confirmed this finding, and provided a fundamentally new contribution by defining a belt/parabelt boundary. It would be useful in future studies to combine tonotopic mapping with our established method of bandwidth/complexity mapping to identify individual subregions within each level of the hierarchy.
While our results define auditory cortical fields based on varying spectral complexity, the structure and function of auditory cortex must also reflect temporal complexity. This was not tested in the present study since our stimuli were intentionally chosen to be steady state, allowing stimulus durations to be precisely controlled across conditions. However, similar hierarchical organization reflecting temporal complexity has indeed been previously reported (Patterson et al., 2002). Combining all aspects of complex sounds, both spectrally and temporally, should deliver a complete picture of functional mapping in at least the initial stages of auditory processing in humans.
Footnotes
This work was funded by the National Science Foundation (BCS-0519127 and OISE-0730255 to J.P.R. and BCS-0749986 to M.R. and J.P.R.), the National Institute of Neurological Disorders and Stroke (R01-NS-052494 to J.P.R), and the Tinnitus Research Initiative (to J.P.R.).
References
- Averbeck BB, Romanski LM. Probabilistic encoding of vocalizations in macaque ventral lateral prefrontal cortex. J Neurosci. 2006;26:11023–11033. doi: 10.1523/JNEUROSCI.3466-06.2006. [DOI] [PMC free article] [PubMed] [Google Scholar]
- Belin P, Zatorre RJ, Lafaille P, Ahad P, Pike B. Voice-selective areas in human auditory cortex. Nature. 2000;403:309–312. doi: 10.1038/35002078. [DOI] [PubMed] [Google Scholar]
- Binder JR, Frost JA, Hammeke TA, Bellgowan PS, Springer JA, Kaufman JN, Possing ET. Human temporal lobe activation by speech and nonspeech sounds. Cereb Cortex. 2000;10:512–528. doi: 10.1093/cercor/10.5.512. [DOI] [PubMed] [Google Scholar]
- Cohen YE, Russ BE, Davis SJ, Baker AE, Ackelson AL, Nitecki R. A functional role for the ventrolateral prefrontal cortex in non-spatial auditory cognition. Proc Natl Acad Sci U S A. 2009;106:20045–20050. doi: 10.1073/pnas.0907248106. [DOI] [PMC free article] [PubMed] [Google Scholar]
- Edmister WB, Talavage TM, Ledden PJ, Weisskoff RM. Improved auditory cortex imaging using clustered volume acquisitions. Hum Brain Mapp. 1999;7:89–97. doi: 10.1002/(SICI)1097-0193(1999)7:2<89::AID-HBM2>3.0.CO;2-N. [DOI] [PMC free article] [PubMed] [Google Scholar]
- Eickhoff SB, Stephan KE, Mohlberg H, Grefkes C, Fink GR, Amunts K, Zilles K. A new SPM toolbox for combining probabilistic cytoarchitectonic maps and functional imaging data. Neuroimage. 2005;25:1325–1335. doi: 10.1016/j.neuroimage.2004.12.034. [DOI] [PubMed] [Google Scholar]
- Eickhoff SB, Paus T, Caspers S, Grosbras M-H, Evans AC, Zilles K, Amunts K. Assignment of functional activations to probabilistic cytoarchitectonic areas revisited. Neuroimage. 2007;36:511–521. doi: 10.1016/j.neuroimage.2007.03.060. [DOI] [PubMed] [Google Scholar]
- Engel SA, Glover GH, Wandell BA. Retinotopic organization in human visual cortex and the spatial precision of functional MRI. Cereb Cortex. 1997;7:181–192. doi: 10.1093/cercor/7.2.181. [DOI] [PubMed] [Google Scholar]
- Fedorenko E, Hsieh P-J, Nieto-Castañón A, Whitfield-Gabrieli S, Kanwisher N. A new method for fMRI investigations of language: defining ROIs functionally in individual subjects. J Neurophysiol. 2010;104:1177–1194. doi: 10.1152/jn.00032.2010. [DOI] [PMC free article] [PubMed] [Google Scholar]
- Formisano E, Kim DS, Di Salle F, van de Moortele PF, Ugurbil K, Goebel R. Mirror-symmetric tonotopic maps in human primary auditory cortex. Neuron. 2003;40:859–869. doi: 10.1016/s0896-6273(03)00669-x. [DOI] [PubMed] [Google Scholar]
- Hackett TA, Stepniewska I, Kaas JH. Subdivisions of auditory cortex and ipsilateral cortical connections of the parabelt auditory cortex in macaque monkeys. J Comp Neurol. 1998;394:475–495. doi: 10.1002/(sici)1096-9861(19980518)394:4<475::aid-cne6>3.0.co;2-z. [DOI] [PubMed] [Google Scholar]
- Hackett TA, Preuss TM, Kaas JH. Architectonic identification of the core region in auditory cortex of macaques, chimpanzees, and humans. J Comp Neurol. 2001;441:197–222. doi: 10.1002/cne.1407. [DOI] [PubMed] [Google Scholar]
- Hall DA, Edmondson-Jones AM, Fridriksson J. Periodicity and frequency coding in human auditory cortex. Eur J Neurosci. 2006;24:3601–3610. doi: 10.1111/j.1460-9568.2006.05240.x. [DOI] [PubMed] [Google Scholar]
- Hillenbrand J, Getty LA, Clark MJ, Wheeler K. Acoustic characteristics of American English vowels. J Acoust Soc Am. 1995;97:3099–3111. doi: 10.1121/1.411872. [DOI] [PubMed] [Google Scholar]
- Humphries C, Liebenthal E, Binder JR. Tonotopic organization of human auditory cortex. Neuroimage. 2010;50:1202–1211. doi: 10.1016/j.neuroimage.2010.01.046. [DOI] [PMC free article] [PubMed] [Google Scholar]
- Joanisse MF, Zevin JD, McCandliss BD. Brain mechanisms implicated in the preattentive categorization of speech sounds revealed using FMRI and a short-interval habituation trial paradigm. Cereb Cortex. 2007;17:2084–2093. doi: 10.1093/cercor/bhl124. [DOI] [PubMed] [Google Scholar]
- Kaas JH, Hackett TA. Subdivisions of auditory cortex and processing streams in primates. Proc Natl Acad Sci U S A. 2000;97:11793–11799. doi: 10.1073/pnas.97.22.11793. [DOI] [PMC free article] [PubMed] [Google Scholar]
- Kayser C, Petkov CI, Logothetis NK. Visual modulation of neurons in auditory cortex. Cereb Cortex. 2008;18:1560–1574. doi: 10.1093/cercor/bhm187. [DOI] [PubMed] [Google Scholar]
- Kikuchi Y, Horwitz B, Mishkin M. Hierarchical auditory processing directed rostrally along the monkey's supratemporal plane. J Neurosci. 2010;30:13021–13030. doi: 10.1523/JNEUROSCI.2267-10.2010. [DOI] [PMC free article] [PubMed] [Google Scholar]
- Kusmierek P, Rauschecker JP. Functional specialization of medial auditory belt cortex in the alert rhesus monkey. J Neurophysiol. 2009;102:1606–1622. doi: 10.1152/jn.00167.2009. [DOI] [PMC free article] [PubMed] [Google Scholar]
- Leaver AM, Rauschecker JP. Cortical representation of natural complex sounds: effects of acoustic features and auditory object category. J Neurosci. 2010;30:7604–7612. doi: 10.1523/JNEUROSCI.0296-10.2010. [DOI] [PMC free article] [PubMed] [Google Scholar]
- Margoliash D, Fortune ES. Temporal and harmonic combination-sensitive neurons in the zebra finch's HVc. J Neurosci. 1992;12:4309–4326. doi: 10.1523/JNEUROSCI.12-11-04309.1992. [DOI] [PMC free article] [PubMed] [Google Scholar]
- Merzenich MM, Brugge JF. Representation of the cochlear partition of the superior temporal plane of the macaque monkey. Brain Res. 1973;50:275–296. doi: 10.1016/0006-8993(73)90731-2. [DOI] [PubMed] [Google Scholar]
- Morosan P, Rademacher J, Schleicher A, Amunts K, Schormann T, Zilles K. Human primary auditory cortex: cytoarchitectonic subdivisions and mapping into a spatial reference system. Neuroimage. 2001;13:684–701. doi: 10.1006/nimg.2000.0715. [DOI] [PubMed] [Google Scholar]
- Obleser J, Boecker H, Drzezga A, Haslinger B, Hennenlotter A, Roettinger M, Eulitz C, Rauschecker JP. Vowel sound extraction in anterior superior temporal cortex. Hum Brain Mapp. 2006;27:562–571. doi: 10.1002/hbm.20201. [DOI] [PMC free article] [PubMed] [Google Scholar]
- Patterson RD, Uppenkamp S, Johnsrude IS, Griffiths TD. The processing of temporal pitch and melody information in auditory cortex. Neuron. 2002;36:767–776. doi: 10.1016/s0896-6273(02)01060-7. [DOI] [PubMed] [Google Scholar]
- Penhune VB, Zatorre RJ, MacDonald JD, Evans AC. Interhemispheric anatomical differences in human primary auditory cortex: probabilistic mapping and volume measurement from magnetic resonance scans. Cereb Cortex. 1996;6:661–672. doi: 10.1093/cercor/6.5.661. [DOI] [PubMed] [Google Scholar]
- Petkov CI, Kayser C, Augath M, Logothetis NK. Functional imaging reveals numerous fields in the monkey auditory cortex. PLoS Biol. 2006;4:e215. doi: 10.1371/journal.pbio.0040215. [DOI] [PMC free article] [PubMed] [Google Scholar]
- Petkov CI, Kayser C, Steudel T, Whittingstall K, Augath M, Logothetis NK. A voice region in the monkey brain. Nat Neurosci. 2008;11:367–374. doi: 10.1038/nn2043. [DOI] [PubMed] [Google Scholar]
- Poremba A, Saunders RC, Crane AM, Cook M, Sokoloff L, Mishkin M. Functional mapping of the primate auditory system. Science. 2003;299:568–572. doi: 10.1126/science.1078900. [DOI] [PubMed] [Google Scholar]
- Rademacher J, Morosan P, Schormann T, Schleicher A, Werner C, Freund HJ, Zilles K. Probabilistic mapping and volume measurement of human primary auditory cortex. Neuroimage. 2001;13:669–683. doi: 10.1006/nimg.2000.0714. [DOI] [PubMed] [Google Scholar]
- Rauschecker JP, Scott SK. Maps and streams in the auditory cortex: nonhuman primates illuminate human speech processing. Nat Neurosci. 2009;12:718–724. doi: 10.1038/nn.2331. [DOI] [PMC free article] [PubMed] [Google Scholar]
- Rauschecker JP, Tian B. Processing of band-passed noise in the lateral auditory belt cortex of the rhesus monkey. J Neurophysiol. 2004;91:2578–2589. doi: 10.1152/jn.00834.2003. [DOI] [PubMed] [Google Scholar]
- Rauschecker JP, Tian B, Hauser M. Processing of complex sounds in the macaque nonprimary auditory cortex. Science. 1995;268:111–114. doi: 10.1126/science.7701330. [DOI] [PubMed] [Google Scholar]
- Rivier F, Clarke S. Cytochrome oxidase, acetylcholinesterase, and NADPH-diaphorase staining in human supratemporal and insular cortex: evidence for multiple auditory areas. Neuroimage. 1997;6:288–304. doi: 10.1006/nimg.1997.0304. [DOI] [PubMed] [Google Scholar]
- Romanski LM, Goldman-Rakic PS. An auditory domain in primate prefrontal cortex. Nat Neurosci. 2002;5:15–16. doi: 10.1038/nn781. [DOI] [PMC free article] [PubMed] [Google Scholar]
- Romanski LM, Tian B, Fritz J, Mishkin M, Goldman-Rakic PS, Rauschecker JP. Dual streams of auditory afferents target multiple domains in the primate prefrontal cortex. Nat Neurosci. 1999;2:1131–1136. doi: 10.1038/16056. [DOI] [PMC free article] [PubMed] [Google Scholar]
- Scott SK, Blank CC, Rosen S, Wise RJ. Identification of a pathway for intelligible speech in the left temporal lobe. Brain. 2000;123:2400–2406. doi: 10.1093/brain/123.12.2400. [DOI] [PMC free article] [PubMed] [Google Scholar]
- Sereno MI, Pitzalis S, Martinez A. Mapping of contralateral space in retinotopic coordinates by a parietal cortical area in humans. Science. 2001;294:1350–1354. doi: 10.1126/science.1063695. [DOI] [PubMed] [Google Scholar]
- Suga N, O'Neill WE, Manabe T. Harmonic-sensitive neurons in the auditory cortex of the mustache bat. Science. 1979;203:270–274. doi: 10.1126/science.760193. [DOI] [PubMed] [Google Scholar]
- Sweet RA, Dorph-Petersen K-A, Lewis DA. Mapping auditory core, lateral belt, and parabelt cortices in the human superior temporal gyrus. J Comp Neurol. 2005;491:270–289. doi: 10.1002/cne.20702. [DOI] [PubMed] [Google Scholar]
- Talavage TM, Sereno MI, Melcher JR, Ledden PJ, Rosen BR, Dale AM. Tonotopic organization in human auditory cortex revealed by progressions of frequency sensitivity. J Neurophysiol. 2004;91:1282–1296. doi: 10.1152/jn.01125.2002. [DOI] [PubMed] [Google Scholar]
- Tian B, Reser D, Durham A, Kustov A, Rauschecker JP. Functional specialization in rhesus monkey auditory cortex. Science. 2001;292:290–293. doi: 10.1126/science.1058911. [DOI] [PubMed] [Google Scholar]
- Turkeltaub PE, Coslett HB. Localization of sublexical speech perception components. Brain Lang. 2010;114:1–15. doi: 10.1016/j.bandl.2010.03.008. [DOI] [PMC free article] [PubMed] [Google Scholar]
- Wallace MN, Johnston PW, Palmer AR. Histochemical identification of cortical areas in the auditory region of the human brain. Exp Brain Res. 2002;143:499–508. doi: 10.1007/s00221-002-1014-z. [DOI] [PubMed] [Google Scholar]
- Wandell BA, Dumoulin SO, Brewer AA. Visual field maps in human cortex. Neuron. 2007;56:366–383. doi: 10.1016/j.neuron.2007.10.012. [DOI] [PubMed] [Google Scholar]
- Wessinger CM, VanMeter J, Tian B, Van Lare J, Pekar J, Rauschecker JP. Hierarchical organization of the human auditory cortex revealed by functional magnetic resonance imaging. J Cogn Neurosci. 2001;13:1–7. doi: 10.1162/089892901564108. [DOI] [PubMed] [Google Scholar]