

Abstract
The objective of this study was to assess the importance of select cultured and uncultured bacteria in the rumen by quantifying their populations and the effect of diets and ruminal fractions. Full-length 16S rRNA gene (rrs) sequences were recovered from rumen samples using specific primers designed from partial sequences recovered previously. Five uncultured bacterial operational taxonomic units (OTUs) were quantified using specific quantitative PCR (qPCR) in fractionated ruminal samples from sheep fed either hay alone or hay plus corn. Species Fibrobacter succinogenes, Ruminococcus albus, R. flavefaciens, Ruminobacter amylophilus, Selenomonas ruminantium, and Mitsuokella multacida and genera Butyrivibrio and Prevotella were also quantified as comparison. The full-length rrs sequence improved taxonomic assignments of partial rrs sequences. Genus Prevotella had the greatest abundance. Of the three major cultured cellulolytic species, R. flavefaciens was most abundant, followed by R. albus and F. succinogenes. The five uncultured bacterial OTUs, classified to genus Acetivibrio, genus Allobaculum, family Ruminococcaceae, order Clostridiales, or class Clostridia, had abundance comparable to that of the above species of genera except Prevotella. Corn supplementation and fractions affected distribution of the rumen bacteria, but to a limited extent. When compared to the qPCR data, sequence frequencies in the rrs clone libraries tended to overestimate the abundance of the bacteria represented. This study showed that abundance and population dynamics of uncultured bacteria can be quantified by specific qPCR, which complements the results of rrs clone libraries. This study also revealed that some uncultured bacteria might be as important as some of the well-characterized bacteria in the rumen. The approach used should be applicable to assess the abundance and potential importance of uncultured bacteria in other environments.
1. Introduction
The complex rumen microbiome plays essential roles in digesting feeds and supplying nutrients to host animals. To positively affect rumen functions, dietary interventions have been attempted to modulate this microbiome [1]. The rumen microbiome as a whole and its individual populations are often analyzed to unveil the underpinning of dietary interventions. Community fingerprinting by DGGE [2], T-RFLP [3], and ARISA [4] have been used in accessing overall dietary effects. However, detailed assessments come from analysis of 16S rRNA gene (rrs) clone libraries or quantitative comparisons of populations of known species or groups, such as F. succinogenes, R. albus, R. flavefaciens, Butyrivibrio fibrisolvens [5, 6], Prevotella spp. [7], Megasphaera elsdenii [8], and methanogens [9]. However, most of these known species or populations account for only a small portion of the rumen microbiome, as exemplified by F. succinogenes, R. albus, and R. flavefaciens, which together represent only 4.5–9% of the total bacteria in the rumen of sheep [10].
Analysis of rrs clone libraries can identify both known (i.e., cultured) and novel bacteria (i.e., uncultured). Of the bacteria identified by rrs sequences of rumen origin, cultured bacteria only accounted for 6.5% [11]. Large numbers of uncultured bacteria represented by novel rrs sequences were especially found within families Ruminococcaceae, Lachnospiraceae, and order Clostridiales. Function and ecology of uncultured bacteria are often inferred from closely related species, while their relative abundance, and thus weight or importance to the entire microbiome, is typically estimated from prevalence of respective rrs sequences in clone libraries. However, sequence prevalence does not necessarily reflect actual abundance of the represented bacteria in the microbiome because of biases associated with PCR and cloning [12]. We hypothesize that the population sizes of uncultured bacteria can be quantified using specific qPCR, and the quantitative information can complement the results of rrs clone libraries and help gauge the importance of uncultured bacteria. In this study, we tested this hypothesis by recovering full-length rrs sequences from select uncultured bacteria and then quantifying their abundance in fractionated rumen samples of sheep fed hay only or hay plus corn. The populations of select well-characterized ruminal bacteria were also quantified for comparison.
2. Materials and Methods
2.1. Feeding, Sample Collection, and DNA Extraction
Four ruminally cannulated sheep were divided into two groups of two sheep each and used in the feeding experiment that was set up in a crossover design with two periods of three weeks each. During the first period, one group was fed 100% orchardgrass hay, while the other group was fed a combination of 70% orchardgrass hay and 30% corn. During the second period, the diets were switched. The sheep were fed once daily for 21 days prior to ruminal sample collection, which took place 6 hrs after feeding. Sample collection and fractionation (adhering or Ad versus liquid or Lq) were done as described previously [13]. Metagenomic DNA was extracted using the RBB+C method [14]. The DNA quality was evaluated using agarose gel (1.0%) electrophoresis, and DNA yield was quantified using the Quant-it Kit (Invitrogen Corporation, Carlsbad, Calif, USA).
2.2. Cloning, Sequencing, and Phylogenetic Analysis
In a previous study [13], a number of OTUs were defined from novel partial rrs sequences (approximat 600 bp from the 3′ end corresponding to 900–1,540 of the E. coli rrs gene) recovered from fractionated rumen samples. Some of these downstream partial sequences either have no close match in the RDP database or only match sequences of bacteria never reported in the rumen. One specific reverse primer was designed using Primer Premier 5.0 (Premier Biosoft Int'l, Palo Alto, Calif, USA) for each of 25 OTUs defined from the downstream partial sequences. The specificity of the primers was verified by in silico analysis against sequences in the RDP database using the Probe Match function. This OTU-specific reverse primer (Table 1) was paired with bacterial primer 27f (Table 2) in PCR to recover the upstream partial sequence. The positions of the primers were shown in Figure 1. The PCR reactions and cloning were done as described previously [13], except for an optimized annealing temperature at 54°C. Three random clones were chosen from each clone library for sequencing from both ends. The partial sequences recovered from each clone library were assembled using BioEdit [15] to form the upstream partial sequence (>1000 bp from the 5′ end corresponding to 8–1006 or beyond of the E. coli rrs gene). This upstream partial sequence and the corresponding downstream partial sequence recovered previously [13] were assembled into a full-length gene sequence using BioEdit [15]. The overlap between the two partial sequences ranged from 106 to 566 bp. The full-length sequences were subjected to vigorous chimera analysis using four different programs: the RDP Chimera Check (http://rdp.cme.msu.edu/), the Bellerophon (http://greengenes.lbl.gov/), the Pintail program of Bioinformatics-Toolkit (http://www.bioinformatics-toolkit.org/Web-Pintail/), and the Mallard [16]. All suspect chimeric sequences were excluded from further analysis. The full-length sequences were compared to RDP sequences and classified using the Classifier program [17]. A neighbor-joining tree based on the full-length sequences and their most similar sequences was constructed using the neighbor Joining method at RDP [18]. The full-length sequences obtained in this study were deposited in GenBank (accession numbers GU120110, GU120113, GU120120, GU120121, GU120128, GU120129, and GU120131-GU120137).
Table 1.
Primers* used to retrieve full-length rrs gene sequences of the uncultured bacteria.
| Partial sequences (GenBank accession no.) | Sequences (5′ → 3′) | Annealing position (E. coli numbering) | Amplicon length (bp) |
|---|---|---|---|
| Lq-H1-18 (AY816400) | GAC ACA CCT GAT CTC TCA GGT T | 1006–1028 | 1,021 |
| Ad-H1-89 (AY816504) | CGA CTT TGC TTC CCT CTG TTT | 1246–1266 | 1,259 |
| Ad-C2-43 (AY816609) | CTC CAG AGT GCC CAT CCG AA | 1135–1154 | 1,147 |
| Ad-C1-74 (AY816616) | GAA GGG ACC GGT TAA GGT C | 1013–1031 | 1,024 |
| Lq-H2-71 (AY816389) | TTC TCG GCC CCA AAT TCG | 1466–1483 | 1,476 |
| Ad-H1-14 (AY816508) | GAT TTG CTT ACC CTC GCG GGT TT | 1260–1282 | 1,275 |
| Ad-H1-53 (AY816423) | CGT ATC TCT ACG GCT TTA C | 1002–1020 | 1,013 |
| Ad-H1-75 (AY816420) | CAC ACC TTG TAT CTC TAC AAG C | 1006–1027 | 1,020 |
| Ad-H2-90 (AY816432) | CTT CGA CAG CTG CCT CCT TA | 1451–1470 | 1,463 |
| Lq-C1-28 (AY816538) | CCA GGG CCA TTA CAC CCT GT | 1005–1025 | 1,018 |
| Lq-C2-16 (AY816578) | GAC TTT GCT TCC CTT TGT TTT G | 1245–1265 | 1,258 |
| Lq-C2-58 (AY816550) | AGC CTC CGA TAC ATC TCT GC | 1010–1029 | 1,022 |
*Only the primers that produced a single sequence were listed.
Table 2.
Primers and probe used for real-time PCR quantification of recognized rumen bacterial species, genera, or uncultured bacteria.
| Primers | Sequences (5′ → 3′) | Target | Annealing temperature (°C) | Amplicon length (bp) | References |
|---|---|---|---|---|---|
| 27f | AGA GTT TGA TCM TGG CTC AG | Bacteria | 54 | 1,535 | [19] |
| 1525r | AAG GAG GTG WTC CAR CC | ||||
| 340f | TCC TAC GGG AGG CAG CAG T | Bacteria | 60 | 467 | [20] |
| 806r | GGA CTA CCA GGG TAT CTA ATC CTG TT | ||||
| TaqMan probe | 6-FAM-5′-CGT ATT ACC GCG GCT | 70 | |||
| GCT GGC AC-3′-TAMRA | |||||
| Bac303f | GAA GGT CCC CCA CAT TG | Bacteroides and Prevotella | 56 | 418 | [21] |
| Bac708r | CAA TCG GAG TTC TTC GTG | ||||
| ARC787F | ATT AGA TAC CCS BGT AGT CC | Archaea | 60 | 273 | [22] |
| ARC1059R | GCC ATG CAC CWC CTC T | ||||
| Ra1281f | CCC TAA AAG CAG TCT TAG TTC G | R. albus | 55 | 175 | [23] |
| Ra1439r | CCT CCT TGC GGT TAG AAC A | ||||
| Fs-f | GGT ATG GGA TGA GCT TGC | F. succinogenes | 63 | 446 | [24] |
| Fs-r | GCC TGC CCC TGA ACT ATC | ||||
| 530f | GTG CCA GCM GCC GCG G | Butyrivibrio | 65 | 371 | [19] and this study |
| Buty-900r | TGC GGC ACY GAC TCC CTA TG | ||||
| Sel-Mit-f | TGC TAA TAC CGA ATG TTG | S. ruminantium and M. multacida | 53 | 513 | [24] |
| Sel-Mit-r | TCC TGC ACT CAA GAA AGA | ||||
| Ram-f | CAA CCA GTC GCA TTC AGA | Ruminobacter amylophilus | 57 | 642 | [24] |
| Ram-r | CAC TAC TCA TGG CAA CAT | ||||
| Rf154f-K | TCT GGA AAC GGA TGG TA | R. flavefaciens | 55 | 295 | [23] |
| Rf425r-K | CCT TTA AGA CAG GAG TTT ACA A |
Figure 1.
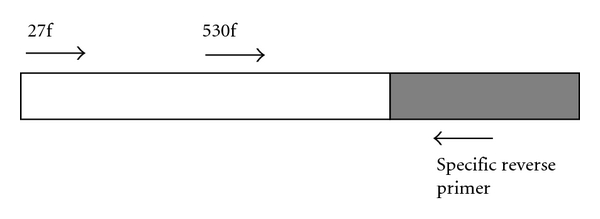
A diagram showing the position and the approach used to obtain full-length rrs gene. The shaded box represents the downstream partial sequence determined in a previous study [13], while the open box represents the upstream partial sequence determined in this study. Each sequence-specific reverse primer was used to retrieve the upstream partial sequence and to quantify the abundance of each of the uncultured bacteria when paired with bacterial primers 27f and 5330f, respectively.
2.3. Quantification of Cultured Bacteria and Uncultured Bacteria by Specific qPCR
One qPCR standard was prepared for each species, genus, group, or OTU of the uncultured bacteria to be quantified. The standard for F. succinogenes, R. albus, and Prevotella was prepared through PCR using the bacterial primers 27f and 1525r (Table 2) and the genomic DNA of F. succinogenes S85, R. albus 8, and Prevotella ruminicola 23, respectively. Due to the lack of strains in our laboratory, a sample-derived standard was prepared for genus Butyrivibrio, R. amylophilus, R. flavefaciens, and S. ruminantium, total bacteria, and total archaea using the respective specific PCR primer set (Table 2) and a composite DNA sample pooled from all the metagenomic DNA to be quantified as described previously [25]. One sample-derived standard for each of the uncultured bacterial OTUs was prepared similarly but with PCR using primer 530f (Table 2) and the respective specific reverse primer for each of the full-length rrs sequences (Table 1). The standards were purified and quantified as done previously [25]. Each standard was serially diluted (1 : 10) immediately before the qPCR assays, and the concentrations ranged from 101 to 107 copies per reaction.
qPCR was carried out using respective specific primers (Table 2) and a Stratagene Mx3000 machine (La Jolla, Calif, USA). Total bacteria was quantified using the TaqMan assay [20], while the other species, groups or uncultured bacterial OTUs were quantified using SYBR Green-based qPCR. The PCR conditions were the same as those used previously [25], except for the annealing temperature that was optimized in this study (see Table 2). Each of the uncultured bacterial OTUs was quantified using the respective OTU-specific reverse primer (Table 1) and bacterial primer 530f (Table 2) similarly as for the cultured bacteria but with a primer annealing temperature at 54°C. To minimize variations, the qPCR assay for each bacterium, species, or group was done in triplicates for both the standards and the metagenomic DNA samples using the same master mix and the same PCR plate. No-template controls were included in triplicates in parallel.
Absolute abundance was calculated as rrs copied per μg metagenomic DNA, while relative abundance was expressed as percent of total bacterial rrs copies. The absolute abundance was not expressed as rrs gene copies/g or mL of sample because (i) the solid and the liquid fractions have different sample matrices, (ii) not all adhering bacteria can be detached or recovered from the solid digesta particles [13], and (iii) the two types of diets probably resulted in solid digesta particles containing different contents of plant content materials (nonmicrobial). The mean was calculated from the three replicates of the qPCR for each sample. Then, the mean was calculated from the four samples (two animals by two periods) of each fraction and each diet. The fraction- and diet-based data of abundance were analyzed using one-way analysis of variance (ANOVA) using GraphPad Prism 5 (GraphPad Software, San Diego, Calif, USA) and the means were compared using one-way ANOVA with Tukey's multiple comparison test. Significant difference was declared at P ≤ 0.05, while tendency was declared at P ≤ 0.10.
3. Results
3.1. Phylogenetic Assignment of the Full-Length rrs Sequences
Twenty-five reverse primers were designed and used in retrieving upstream partial sequences, but only 12 each were allowed for identical upstream partial sequences from the clones that were sequenced. The remaining 13 primers generated 2-3 very similar but different upstream partial sequences (data not shown). These latter primers and sequences were excluded from further analysis. The full-length sequences were assigned to genus (the lowest taxonomic rank of the new Bergey's Taxonomy of Prokaryotes used in the RDP database) or higher taxa (Figure 2). The increased sequence length allowed taxonomic assignment with a greater confidence for all the sequences and to genus for Ad-H1-89-3, Ad-C2-43-3, Ad-C1-74-3, Lq-C1-28-3, and Lq-C2-58-2. Six full-length sequences remained to be assigned to a genus (i.e., Lq-C2-16-3 and Ad-H2-89-1), family (i.e., Lq-H1-18-2, Ad-H1-53-2, and Ad-H1-75-1), or order (i.e., Ad-H2-90-2) (Figure 2). Seven of the full-length sequences each are very similar (99% sequence identity) to sequences also recovered from the rumen by other researchers (based on BLASTn analysis and GenBank records), including Lq-H1-18-2 (17 sequences), Lq-H2-71-3 (9 sequences), Ad-H1-14-1 (45 sequences), Lq-C1-28-3 (7 sequences), Lq-C2-16-3 (2 sequences), Ad-H1-53-2 (1 sequence), and Ad-H2-90-2 (1 sequence). Because none of these novel bacteria can be classified to existing species or genus, they were referred to bacterial OTUs. These OTUs, especially OTUs Ad-H1-14-1 and Lq-H1-18-2, may represent bacteria common in the rumen. The remaining six full-length sequences shared no more than 97% sequence identity with any of the sequences in the RDP or the GenBank. These sequences likely represent novel bacteria that have not been documented.
Figure 2.

A Weighbor-joining tree based on the full-length sequences recovered in this study and their mostly similar sequences found in the RDP database. The taxa to which the sequences were assigned to are also shown. The values in brackets are the confidence level obtained from the Classifier program of RDP. The tree was rooted with the sequence of Lactobacillus ruminis (T); NBRC 102161. The numbers at branching points are bootstrap values based on 100 replicates. The scale bar represents 0.1 substitution per site. Sequences obtained in this study were shown in bold. The uncultured bacteria that were quantified by qPCR were also underlined.
3.2. Quantification of Cultured Bacteria
Total bacteria did not differ in abundance between the two diets or between the two fractions, while the archaeal abundance tended to be lower (P = 0.067) in the H-Ad sample than in the other three samples (Table 3). Of the three major known cellulolytic species, R. albus and R. flavefaciens were more abundant than F. succinogenes in all the samples (Table 3), a finding consistent with some previous studies (e.g., [26, 27]) but contradictory to other studies (e.g., [28, 29]). F. succinogenes tended to be more abundant in the adhering fraction and in the hay-fed sheep, reflecting its ability to adhere to fiber particles in the rumen. The abundance of the two Ruminococcus species, especially relative to total bacteria, was numerically higher in the adhering fraction of hay-fed sheep. Overall, the abundance of each of these three cellulolytic species was similar between the two diets and between the two fractions. Genus Butyrivibrio was significantly more abundant in the hay-fed sheep than in the hay:corn-fed counterparts, but its abundance did not differ between the two ruminal fractions within the same dietary group (Table 3). Of the known species and genera quantified, genus Prevotella was the most predominant, accounting for about 27% of the total bacteria in the hay-fed sheep and more than 50% in the hay:corn-fed sheep (Table 3). R. amylophilus was found in relatively high abundance in the adherent fraction of the sheep fed the hay:corn diet, corresponding to its ability to utilize starch. S. ruminantium and M. multacida are closely related species within family Veillonellaceae. Since the primers used in this study amplify both species, they were quantified together as a group. As shown in Table 3, this group of bacteria was less abundant in the adhering fraction of the hay-fed sheep than in the liquid fraction of the hay:corn-fed sheep. These results are in general agreement with the ability of these two species to utilize sugars and lactate.
Table 3.
Populations of bacteria (cultured and uncultured) and archaea.
| H-Ad | H-Lq | C-Ad | C-Lq | SEM | P value | |
|---|---|---|---|---|---|---|
| Total bacteria | 3.6×10⁹ | 8.3×10⁹ | 5.3×10⁹ | 4.8×10⁹ | 1.0×10⁹ | 0.123 |
| F. succinogenes | 2.7×10⁵ (a) (0.01%) | 5.6×10⁴ (a,b) (0.00%) | 1.3×10⁵ (a,b) (0.00%) | 2.1×10⁴ (b)(0.00%) | 5.6×10⁴ (0.001%) | 0.025 (0.004) |
| R. albus | 6.5×10⁸ (17.94%) | 1.5×10⁷ (0.18%) | 4.9×10⁷ (0.94%) | 3.1×10⁷ (0.65%) | 1.5×10⁸ (0.43%) | 0.477 (0.398) |
| R. flavefaciens | 5.9×10⁷ (1.63%) | 4.3×10⁷ (0.52%) | 5.3×10⁷ (1.01%) | 5.0×10⁷(1.05%) | 3.2×10⁶ (0.23%) | 0.984 (0.307) |
| Butyrivibrio | 8.7×10⁷ (a) (2.42%) | 8.7×10⁷ (a) (1.05%) | 6.3×10⁶ (b) (0.12%) | 2.5×10⁶ (b) (0.05%) | 2.4×10⁷ (0.55%) | 0.003 (0.001) |
| Prevotella | 9.7×10⁸ (26.97%) | 2.3×10⁹ (26.95%) | 2.8×10⁹ (53.65%) | 2.9×10⁹ (60.67%) | 4.5×10⁸ (8.83%) | 0.459 (0.255) |
| R. amylophilus | 8.6×10³ (0.00%) | 1.6×10⁴ (0.00%) | 8.2×10⁴ (0.00%) | 1.0×10⁴(0.00%) | 1.8×10⁴ (0.00%) | 0.131 (0.231) |
| S. ruminantium & M. multacida | 2.8×10⁶ (a) (0.08%) | 4.7×10⁷ (a,b) (0.56%) | 6.1×10⁷ (a,b) (1.15%) | 1.5×10⁷ (b) (0.30%) | 1.4×10⁷ (0.23%) | 0.051 (0.060) |
| Ad-H1-75-1 | 5.0×10⁶ (0.14%) | 9.2×10⁶ (0.11%) | 2.3×10⁶ (0.04%) | 3.4×10⁶ (0.07%) | 1.5×10⁶ (0.02%) | 0.072 (0.334) |
| Ad-H2-90-2 | 1.2×10⁷ (a) (0.33%) | 4.6×10⁷ (b) (0.56%) | 1.0×10⁷ (a) (0.19%) | 5.4×10⁶ (a) (0.11%) | 9.4×10⁶ (0.10%) | 0.007 (0.196) |
| Ad-H1-14-1 | 4.5×10⁷ (1.24%) | 4.5×10⁷ (0.54%) | 1.3×10⁷ (0.25%) | 9.9×10⁶ (0.21%) | 9.6×10⁶ (0.24%) | 0.327 (0.095) |
| Lq-C2-16-3 | 2.5×10⁷ (0.68%) | 2.4×10⁷ (0.28%) | 4.9×10⁷ (0.94%) | 2.7×10⁷ (0.57%) | 6.1×10⁶ (0.14%) | 0.518 (0.320) |
| Lq-C2-58-2 | 8.9×10⁶ (0.25%) | 1.9×10⁷ (0.23%) | 2.9×10⁷ (0.55%) | 4.6×10⁶ (0.10%) | 5.5×10⁶ (0.10%) | 0.095 (0.094) |
| Methanogens | 4.0×10⁵ | 2.5×10⁶ | 1.7×10⁶ | 2.4×10⁶ | 4.9×10⁵ | 0.068 |
Note: Means within a row with different superscripts differ (P < 0.05). Values in parentheses are relative abundance (%) of total bacteria.
3.3. Quantification of Uncultured Bacteria
The abundance of OTUs Ad-H1-14-1 (classified to genus Acetivibrio), Lq-C2-16-3 (classified to Ruminococcaceae), and Ad-H2-90-2 (classified only to class Clostridia) ranged from 106 to 107 copies of rrs genes/μg metagenomic DNA, corresponding to about 0.11 to 1.2% of total bacteria (Table 3). These abundances were lower than that of the genus Prevotella, comparable to that of the two Ruminococcus species and the genus Butyrivibrio, but higher than that of F. succinogenes, R. amylophilus, or S. ruminantium and M. multacida combined. These three OTUs did not differ in abundance between the two fractions in the hay-fed sheep, but appeared to be numerically more abundant in the adhering fraction than in the liquid fraction of the hay:corn-fed sheep. OTUs Lq-C2-58-2 (classified to genus Alloculum) and Ad-H1-75-1 (classified only to order Clostridiales) were slightly less abundant than the other three OTUs mentioned above. OTU Lq-C2-58-2 was significantly more abundant in the adhering fraction than in the liquid fraction of the hay:corn-fed sheep and tended to be more abundant in the liquid fraction of hay-fed sheep. Overall, OTUs Ad-H1-14-1, Ad-H2-90-2, and Ad-H1-75-1 were more abundant in the hay-fed sheep than in the hay:corn-fed sheep, whereas OTUs Lq-C2-16-3 and Lq-C2-58-2 had comparable abundance between the two feeding groups.
4. Discussion
Due to cost and time restraint, partial rrs gene sequences are typically determined in most studies that examined the diversity and species richness of various microbiome samples. As demonstrated in this study, however, full-length rrs sequences improve upon partial sequences in classification of rrs sequences, in both confidence and low taxa that are more informative. Although this is expected, the results of this study demonstrated the extent and aspects that full-length rrs sequences can improve over partial rrs sequences. Conceivably, full-length high-quality rrs sequences are also important in assigning candidate taxa (incertae sedis) that do not have cultured representatives. It should be noted that 13 of the 25 reverse primers designed in this study did not allow for retrieval of a single upstream partial sequence. Given that these reverse primers did not have any match in RDP or GenBank (data not shown), this might be explained by the fact that the downstream regions (V6–V9) of the rrs genes are more conserved than the upstream regions [30, 31].
All the full-length sequences determined in this study represented uncultured ruminal bacterial OTUs that cannot assigned to existing species or genera. Classification to a genus helped with inference of possible functions of these bacterial OTUs, such as OTUs Ad-H1-14-1 (classified to Acetivibrio), Ad-C1-74-3 (classified to Anaerovorax), and Lq-C1-28-3 (Roseburia). In addition to 45 nearly identical sequences, OTUs Ad-H1-14-1 is 98.8% identical to the sequence of a new strain, R-25 (accession number of its rrs sequence: AB239489), which was recently isolated from an enriched culture of sheep rumen [32]. This strain was shown to be short rod or coccus shaped, to adhere to orchardgrass hay, and to have activities of carboxymethylcellulase, xylanase, and α-L-arabinofuranosidase. Strain R-25 reached a relative abundances of 0.98% and 0.64% of total bacteria in the solid and the liquid fractions of rumen samples collected from sheep [32], which is comparable to that of OTU Ad-H1-14-1 in the sheep rumen sampled in this present study (Table 3). Acetivibrio is a genus that contains only two recognized cellulolytic species (i.e., A. cellulolyticus and A. cellulosolvens). This genus has no cultured representative from the rumen. However, the high prevalence of OTU Ad-H1-14-1 sequences recovered from the rumen and the relatively high abundance of Ad-H1-14-1 determined in the hay-fed sheep than in the hay:corn-fed sheep (Table 3) suggest that OTU Ad-H1-14-1, together with strain R-25, may represent an important species of fibrolytic ruminal bacteria in the genus Acetivibrio.
In this study, we quantified the populations of five uncultured bacteria classified to known genera (i.e., OTUs Lq-C2-58-2 and Ad-H1-14-1), family (i.e., OTU Lq-C2-16-3), order (OTU Ad-H1-75-1), or class (OTU Ad-H2-90-2) in the phylum Firmicutes (Figure 2). These uncultured bacteria had abundance comparable to or greater than that of known species or genera (except the genus Prevotella) of bacteria that are perceived important to rumen functions. For example, OTU Ad-H1-14-1 may be one important group of bacteria participating in fiber digestion in the rumen. Additionally, OTU Lq-C2-58-2 was classified to genus Allobaculum within the class Erysipelotrichi, a class of Firmicutes poorly represented by sequences of rumen origin [11]. Alloculum is a new genus represented by a single species, A. stercoricanis, whose type strain was initially isolated from canine feces and was shown to utilize several sugars, including glucose, fructose, maltose, and cellubiose [33]. OTU Lq-C2-58-2 might represent a group of scavenger utilizing sugars in the rumen. Although the specific functions of these uncultured bacteria remain to be determined, their relatedness with known taxa and their abundance suggest that some of them may play as important role in rumen function as some of the well-characterized bacteria.
The abundance of a bacterial group in an environment reflects its ability to adapt to the conditions and compete for the nutrients available therein and signifies its importance to the overall functions of the microbiome. As mentioned above, sequence frequencies in rrs gene clone libraries are often used in assessing the relative abundance of the bacteria represented, but the validity of such correlation is uncertain due to bias inherent to PCR and cloning [12]. In this study, we examined the above validity by comparing the frequency of five downstream partial sequences that were recovered previously in clone libraries [13] and the relative abundance (% of total bacteria) of the corresponding full-length sequences quantified by the specific qPCR assays. In the clone libraries, sequence Ad-H1-75-1 had a frequency of 2.1%, while the other four sequences had a frequency of 1.0%, in the fractions from which these sequences were recovered. The frequencies of all these sequences were greater than their relative abundance determined in this study, especially Ad-H1-75-1 (Table 3), suggesting that these sequences were over represented in the rrs gene clone libraries and their frequency in the clone libraries would overestimate their abundance in the rumen. More studies involving multiple rrs gene clone libraries constructed using different PCR primers and from different samples are needed to verify if sequence frequency in rrs gene clone libraries generally overestimates relative abundance of the bacteria represented. Nevertheless, caution should be exercised in estimating bacterial abundance from sequence frequency in rrs gene clone libraries. As demonstrated in this study, actual abundance and population dynamics of uncultured bacteria should be quantified using specific qPCR so their ecology and importance to the microbiome can be inferred more accurately.
Acknowledgment
This study was partially supported by a grant from the Ohio Agricultural Research and Development Center (OARDC).
References
- 1.Calsamiglia S, Busquet M, Cardozo PW, Castillejos L, Ferret A. Invited review: essential oils as modifiers of rumen microbial fermentation. Journal of Dairy Science. 2007;90(6):2580–2595. doi: 10.3168/jds.2006-644. [DOI] [PubMed] [Google Scholar]
- 2.McEwan NR, Abecia L, Regensbogenova M, Adam CL, Findlay PA, Newbold CJ. Rumen microbial population dynamics in response to photoperiod. Letters in Applied Microbiology. 2005;41(1):97–101. doi: 10.1111/j.1472-765X.2005.01707.x. [DOI] [PubMed] [Google Scholar]
- 3.Frey JC, Pell AN, Berthiaume R, et al. Comparative studies of microbial populations in the rumen, duodenum, ileum and faeces of lactating dairy cows. Journal of Applied Microbiology. 2010;108(6):1982–1993. doi: 10.1111/j.1365-2672.2009.04602.x. [DOI] [PubMed] [Google Scholar]
- 4.Welkie DG, Stevenson DM, Weimer PJ. ARISA analysis of ruminal bacterial community dynamics in lactating dairy cows during the feeding cycle. Anaerobe. 2010;16(2):94–100. doi: 10.1016/j.anaerobe.2009.07.002. [DOI] [PubMed] [Google Scholar]
- 5.Weimer PJ, Stevenson DM, Mertens DR, Thomas EE. Effect of monensin feeding and withdrawal on populations of individual bacterial species in the rumen of lactating dairy cows fed high-starch rations. Applied Microbiology and Biotechnology. 2008;80(1):135–145. doi: 10.1007/s00253-008-1528-9. [DOI] [PubMed] [Google Scholar]
- 6.Mosoni P, Chaucheyras-Durand F, Béra-Maillet C, Forano E. Quantification by real-time PCR of cellulolytic bacteria in the rumen of sheep after supplementation of a forage diet with readily fermentable carbohydrates: effect of a yeast additive. Journal of Applied Microbiology. 2007;103(6):2676–2685. doi: 10.1111/j.1365-2672.2007.03517.x. [DOI] [PubMed] [Google Scholar]
- 7.Stevenson DM, Weimer PJ. Dominance of Prevotella and low abundance of classical ruminal bacterial species in the bovine rumen revealed by relative quantification real-time PCR. Applied Microbiology and Biotechnology. 2007;75(1):165–174. doi: 10.1007/s00253-006-0802-y. [DOI] [PubMed] [Google Scholar]
- 8.Klieve AV, Hennessy D, Ouwerkerk D, Forster RJ, Mackie RI, Attwood GT. Establishing populations of Megasphaera elsdenii YE 34 and Butyrivibrio fibrisolvens YE 44 in the rumen of cattle fed high grain diets. Journal of Applied Microbiology. 2003;95(3):621–630. doi: 10.1046/j.1365-2672.2003.02024.x. [DOI] [PubMed] [Google Scholar]
- 9.Sundset MA, Edwards JE, Cheng YF, et al. Rumen microbial diversity in Svalbard reindeer, with particular emphasis on methanogenic archaea. FEMS Microbiology Ecology. 2009;70(3):553–562. doi: 10.1111/j.1574-6941.2009.00750.x. [DOI] [PubMed] [Google Scholar]
- 10.Michalet-Doreau B, Fernandez I, Fonty G. A comparison of enzymatic and molecular approaches to characterize the cellulolytic microbial ecosystems of the rumen and the cecum. Journal of Animal Science. 2002;80(3):790–796. doi: 10.2527/2002.803790x. [DOI] [PubMed] [Google Scholar]
- 11.Kim M, Morrison M, Yu Z. Status of the phylogenetic diversity census of ruminal microbiomes. FEMS Microbiology Ecology. 2011;76(1):49–63. doi: 10.1111/j.1574-6941.2010.01029.x. [DOI] [PubMed] [Google Scholar]
- 12.von Wintzingerode F, Göbel UB, Stackebrandt E. Determination of microbial diversity in environmental samples: pitfalls of PCR-based rRNA analysis. FEMS Microbiology Reviews. 1997;21(3):213–229. doi: 10.1111/j.1574-6976.1997.tb00351.x. [DOI] [PubMed] [Google Scholar]
- 13.Larue R, Yu Z, Parisi VA, Egan AR, Morrison M. Novel microbial diversity adherent to plant biomass in the herbivore gastrointestinal tract, as revealed by ribosomal intergenic spacer analysis and rrs gene sequencing. Environmental Microbiology. 2005;7(4):530–543. doi: 10.1111/j.1462-2920.2005.00721.x. [DOI] [PubMed] [Google Scholar]
- 14.Yu Z, Morrison M. Improved extraction of PCR-quality community DNA from digesta and fecal samples. BioTechniques. 2004;36(5):808–812. doi: 10.2144/04365ST04. [DOI] [PubMed] [Google Scholar]
- 15.Hall TA. BioEdit: a user-friendly biological sequence alignment editor and analysis program for Windows 95/98/NT. Nucleic Acids Symposium Series. 1999;41:95–98. [Google Scholar]
- 16.Ashelford KE, Chuzhanova NA, Fry JC, Jones AJ, Weightman AJ. New screening software shows that most recent large 16S rRNA gene clone libraries contain chimeras. Applied and Environmental Microbiology. 2006;72(9):5734–5741. doi: 10.1128/AEM.00556-06. [DOI] [PMC free article] [PubMed] [Google Scholar]
- 17.Wang Q, Garrity GM, Tiedje JM, Cole JR. Naive Bayesian classifier for rapid assignment of rRNA sequences into the new bacterial taxonomy. Applied and Environmental Microbiology. 2007;73(16):5261–5267. doi: 10.1128/AEM.00062-07. [DOI] [PMC free article] [PubMed] [Google Scholar]
- 18.Bruno WJ, Socci ND, Halpern AL. Weighted neighbor joining: a likelihood-based approach to distance-based phylogeny reconstruction. Molecular Biology and Evolution. 2000;17(1):189–197. doi: 10.1093/oxfordjournals.molbev.a026231. [DOI] [PubMed] [Google Scholar]
- 19.Lane DJ. 16S/23S rRNA sequencing. In: Stackebrandt E, Goodfellow MD, editors. Nucleic Acid Techniques in Bacterial Systematics. New York, NY, USA: John Wiley and Sons; 1991. pp. 115–175. [Google Scholar]
- 20.Nadkarni MA, Martin FE, Jacques NA, Hunter N. Determination of bacterial load by real-time PCR using a broad-range (universal) probe and primers set. Microbiology. 2002;148(1):257–266. doi: 10.1099/00221287-148-1-257. [DOI] [PubMed] [Google Scholar]
- 21.Bartosch S, Fite A, Macfarlane GT, McMurdo MET. Characterization of bacterial communities in feces from healthy elderly volunteers and hospitalized elderly patients by using real-time PCR and effects of antibiotic treatment on the fecal microbiota. Applied and Environmental Microbiology. 2004;70(6):3575–3581. doi: 10.1128/AEM.70.6.3575-3581.2004. [DOI] [PMC free article] [PubMed] [Google Scholar]
- 22.Yu Y, Lee C, Kim J, Hwang S. Group-specific primer and probe sets to detect methanogenic communities using quantitative real-time polymerase chain reaction. Biotechnology and Bioengineering. 2005;89(6):670–679. doi: 10.1002/bit.20347. [DOI] [PubMed] [Google Scholar]
- 23.Koike S, Kobayashi Y. Development and use of competitive PCR assays for the rumen cellulolytic bacteria: Fibrobacter succinogenes, Ruminococcus albus and Ruminococcus flavefaciens . FEMS Microbiology Letters. 2001;204(2):361–366. doi: 10.1111/j.1574-6968.2001.tb10911.x. [DOI] [PubMed] [Google Scholar]
- 24.Tajima K, Aminov RI, Nagamine T, Matsui H, Nakamura M, Benno Y. Diet-dependent shifts in the bacterial population of the rumen revealed with real-time PCR. Applied and Environmental Microbiology. 2001;67(6):2766–2774. doi: 10.1128/AEM.67.6.2766-2774.2001. [DOI] [PMC free article] [PubMed] [Google Scholar]
- 25.Chen J, Yu Z, Michel FC, Jr., Wittum T, Morrison M. Development and application of real-time PCR assays for quantification of erm genes conferring resistance to macrolides-lincosamides-streptogramin B in livestock manure and manure management systems. Applied and Environmental Microbiology. 2007;73(14):4407–4416. doi: 10.1128/AEM.02799-06. [DOI] [PMC free article] [PubMed] [Google Scholar]
- 26.Martin C, Millet L, Fonty G, Michalet-Doreau B. Cereal supplementation modified the fibrolytic activity but not the structure of the cellulolytic bacterial community associated with rumen solid digesta. Reproduction, Nutrition, Development. 2001;41(5):413–424. doi: 10.1051/rnd:2001141. [DOI] [PubMed] [Google Scholar]
- 27.Weimer PJ, Waghorn GC, Odt CL, Mertens DR. Effect of diet on populations of three species of ruminal cellulolytic bacteria in lactating dairy cows. Journal of Dairy Science. 1999;82(1):122–134. doi: 10.3168/jds.S0022-0302(99)75216-1. [DOI] [PubMed] [Google Scholar]
- 28.Koike S, Pan J, Kobayashi Y, Tanaka K. Kinetics of in sacco fiber-attachment of representative ruminal cellulolytic bacteria monitored by competitive PCR. Journal of Dairy Science. 2003;86(4):1429–1435. doi: 10.3168/jds.S0022-0302(03)73726-6. [DOI] [PubMed] [Google Scholar]
- 29.Michalet-Doreau B, Fernandez I, Peyron C, Millet L, Fonty G. Fibrolytic activities and cellulolytic bacterial community structure in the solid and liquid phases of rumen contents. Reproduction, Nutrition, Development. 2001;41(2):187–194. doi: 10.1051/rnd:2001122. [DOI] [PubMed] [Google Scholar]
- 30.Kim M, Morrison M, Yu Z. Evaluation of different partial 16S rRNA gene sequence regions for phylogenetic analysis of microbiomes. Journal of Microbiological Methods. 2011;84(1):81–87. doi: 10.1016/j.mimet.2010.10.020. [DOI] [PubMed] [Google Scholar]
- 31.Yu Z, Morrison M. Comparisons of different hypervariable regions of rrs genes for use in fingerprinting of microbial communities by PCR-denaturing gradient gel electrophoresis. Applied and Environmental Microbiology. 2004;70(8):4800–4806. doi: 10.1128/AEM.70.8.4800-4806.2004. [DOI] [PMC free article] [PubMed] [Google Scholar]
- 32.Koike S, Handa Y, Goto H, et al. Molecular monitoring and isolation of previously uncultured bacterial strains from the sheep rumen. Applied and Environmental Microbiology. 2010;76(6):1887–1894. doi: 10.1128/AEM.02606-09. [DOI] [PMC free article] [PubMed] [Google Scholar]
- 33.Greetham HL, Gibson GR, Giffard C, et al. Allobaculum stercoricanis gen. nov., sp. nov., isolated from canine feces. Anaerobe. 2004;10(5):301–307. doi: 10.1016/j.anaerobe.2004.06.004. [DOI] [PubMed] [Google Scholar]