

Abstract
Admixed populations such as African Americans and Hispanic Americans are often medically underserved and bear a disproportionately high burden of disease. Owing to the diversity of their genomes, these populations have both advantages and disadvantages for genetic studies of complex phenotypes. Advances in statistical methodologies that can infer genetic contributions from ancestral populations may yield new insights into the aetiology of disease and may contribute to the applicability of genomic medicine to these admixed population groups.
Admixed populations, defined here as populations with recent ancestry from two or more continents, have arisen in the past several hundred years as a consequence of historical events such as the transatlantic slave trade, the colonization of the Americas and other long-distance migrations. A substantial proportion of the US population is represented by admixed populations, including African Americans, Hispanic Americans (for example, Mexican Americans and Puerto Ricans) and Native Hawaiians1–4. Examples of admixed populations outside the United States include Latinos from throughout Latin America, the Uyghur population of Central Asia and a South African population who self-identify and are described in the literature as ‘South African Coloured’ (refs 4–6).
Population admixture has brought together genomes from continental populations that have diverged primarily because of genetic drift, but also because of different selective pressures. Although genetic differences between populations represent only a small fraction of genetic variation, many simple and complex diseases have a prevalence that varies sub-stantially with genetic ancestry owing to genetic and/or environmental factors7,8. Recently, therapeutic response in patients with acute lymphoblastic leukaemia has been reported to vary with proportion of Native American ancestry9. Studies of natural selection suggest that many genetic variants have been positively selected over the past several thousand years and that many of these are unique to particular continental groups10. Thus, recently admixed populations are likely to harbour a larger number of genetic variants that have functional effects. Although this increased population diversity can be an advantage, admixture leads to variation in genome-wide ancestry (FIG. 1a), which can confound association studies if it is not properly accounted for11.
Figure 1. Admixture leads to variation in genome-wide and local ancestry.

a ∣ The variation in genome-wide ancestry in individuals from admixed populations is illustrated by using EIGENSOFT software to apply principal components analysis to admixed individuals. The samples were derived from HapMap 3 and the Human Genome Diversity Project (HGDP). The HapMap 3 samples included: West African (YRI, Yoruba in Ibadan, Nigeria), European (CEU, Utah residents with northern and western European ancestry from the CEPH collection), African American (ASW, African ancestry in Southwest USA) and Mexican American (MXL, Mexican ancestry in Los Angeles, California). For Native Americans, HGDP samples were used. Analyses were restricted to the intersection of HapMap 3 and HGDP marker sets. The results confirm that most African Americans lie on a cline of African and European ancestry with an average of 80% African and 20% European ancestry1,2,29. The results also confirm that Mexican Americans lie on a cline of European and Native American ancestry with low levels of African ancestry: an average of 50% European, 45% Native American and 5% African ancestry4,14,15. We caution that the positions of Native American individuals on this plot are complicated by recent European admixture (especially in Pima and Maya) and by population-specific drift (especially in Colombian, Karitiana and Surui populations). b ∣ Here, the variation in local ancestry in African Americans is illustrated by showing an individual (NA19919) from the ASW population as analysed by HAPMIX software29 to estimate local ancestry on chromosome 1. The lengths of chromosomal segments of 0, 1 or 2 copies of European ancestry are consistent with previous estimates of an average of six generations since admixture in this population1,2,29. We note that Latino populations have an average of 10–15 generations since admixture, leading to shorter chromosomal segments4,14,15.
Importantly, admixture between different continental populations also creates mosaic chromosomes containing segments of distinct ancestry, which we refer to as local ancestry (FIG. 1b). A causal risk allele with large allele frequency differences between ancestral populations — such as those that may exist for a disease with varying prevalence among populations — leads to deviations in local ancestry at the causal locus. Thus, local ancestry estimates can be used for admixture mapping, in which disease cases from an admixed population are scanned for loci with unusual deviations in local ancestry7,12. Local ancestry was historically inferred using ancestry-informative markers (AIMs)1,2, but the advent of genome-wide association studies (GWASs) has led to new techniques for local ancestry inference and raises some additional challenges, such as combining SNP and admixture association signals, optimizing genotype imputation and fine-mapping causal variants13. Below, we review the basic concepts, recent progress and future challenges spanning all of these topics.
Methods using AIM panels
Local ancestry inference
Initial efforts to infer local ancestry in admixed chromosomes have relied on panels of roughly 1,500–5,000 AIMs chosen to have high population differentiation between ancestral populations and to be unlinked in each ancestral population1,2,14,15. These AIM panels are designed to model two-way admixture, which is appropriate for African Americans and may suffice for some Latino populations. Hidden Markov model (HMM) approaches for inferring local ancestry from AIMs have produced reasonably accurate local ancestry estimates and are implemented in several software packages, including ADMIXMAP, ANCESTRYMAP and MALDsoft (reviewed in refs 7,12). The local ancestry of disease cases can be compared either to the local ancestry of controls at the same locus (case–control approach) or to the local ancestry of the same disease cases elsewhere in the genome (case-only approach)7,12. The case-only approach is generally more powerful, as there is no statistical noise introduced from controls. However, its robustness against false-positive admixture associations requires that no null loci exist with deviations in inferred local ancestry due to selection since admixture, linkage disequilibrium (LD) between markers or inaccurate ancestral populations16,17.
Admixture mapping
Admixture mapping studies using AIM panels, together with follow-up genotyping at a denser scale (which is necessary to provide better localization of admixture signals than that provided by the coarse scale of local-ancestry segments), have been successful in identifying and localizing genetic risk loci affecting susceptibility to disease and other human traits3,18–22. Many of these studies relied heavily on the analysis of admixed populations, as the underlying variants were rare or monomorphic in one or more ancestral populations. For example, admixture mapping in African Americans provided a powerful and efficient approach for identifying the genetic locus responsible for a form of neutropaenia21. This locus was subsequently fine-mapped to a variant in Duffy blood group chemokine receptor (DARC) that has an allele frequency close to 100% in sub-Saharan Africans and close to 0% in other continental populations22. However, admixture mapping is not sufficiently powered to identify genetic variants with similar frequencies across ancestral populations. Even in the context of admixture mapping, AIM panels are less powerful than GWAS chip data as a means to infer local ancestry, although AIM panels may provide a saving in cost (BOX 1).
Box 1. Comparison of local-ancestry methods.
Local ancestry can be estimated using various algorithms and marker sets. Ancestry-informative marker (AIM) panels may provide a saving in cost relative to genome-wide association study (GWAS) chip data, but they are less powerful for inferring local ancestry. The cost–benefit trade-off may favour AIM panels if admixture association is the only statistical signal of interest, but is likely to favour GWAS chip data if both SNP association and admixture association are of interest, as in most studies. A comparison of selected local-ancestry inference methods is presented in the table below.
We used haplotypes from European (HapMap 3, CEU (Utah residents with northern and western European ancestry from the CEPH collection)) and West African (HapMap 3, YRI (Yoruba in Ibadan, Nigeria)) chromosomes to simulate N = 200 African American diploid samples assuming six generations of admixture with a continuous influx of African and European chromosomes with 80%/20% proportion of African/European ancestry. The analysis was restricted to 48,827 SNPs from chromosome 1 present on the Affymetrix 6.0 array. The ANCESTRYMAP, WINPOP and HAPMIX methods were compared. ANCESTRYMAP was run using 281 AIMs followed by interpolation of local ancestries to all SNPs, based on recommendations for Affymetrix 6.0 data21.
The table provides a summary of characteristics and accuracy of different local-ancestry inference methods. In it, we show the squared correlation (r2) between inferred and true local ancestries, the proportion of alleles with correctly assigned ancestry (haploid accuracy) as well as the proportion of genotypes for which both alleles have correctly inferred ancestry (diploid accuracy). All three of these methods attain high accuracy; HAPMIX attains the highest accuracy but at a cost of increased complexity and running time.
| Method | Information from ancestral populations |
Running time (N = 200, 1 CPU) |
Handles multi-way admixed populations |
Simulations of African Americans | ||
|---|---|---|---|---|---|---|
| r2 | Haploid accuracy (%) |
Diploid accuracy (%) |
||||
| ANCESTRYMAP | Allele frequencies at a set of AIMs |
2 min | No | 0.83 | 97.67 | 95.35 |
| WINPOP | Allele frequencies at GWAS SNPs |
3 min | Yes | 0.94 | 99.36 | 98.75 |
| HAPMIX | Phased haplotypes at GWAS SNPs |
7 h | No | 0.97 | 99.66 | 99.32 |
CPU, central processing unit.
Local ancestry using GWAS chip data
Approaches that do not model LD between markers
Genotyping using GWAS chips is an increasingly appealing alternative to AIM panels owing to the decreasing cost of chips. A baseline approach to local ancestry inference using GWAS chip data is to apply previous HMM-based methods to AIM panels consisting of maximally informative subsets of GWAS chip SNPs that are unlinked in ancestral populations23 (BOX 1). An alternative approach is to make ancestry predictions separately within short (relative to ancestry segment length) overlapping windows and then combine the results by majority vote. This approach was initially implemented in the LAMP method24, which infers ancestry within each window using a likelihood model that assumes no recombination since admixture and includes a pruning step to ensure that markers are unlinked in ancestral populations. A new approach within the same framework, WINPOP25, differs from LAMP in that it allows one ancestry transition within each window while adaptively choosing window sizes according to the local genetic structure of the ancestral populations. Our simulations indicate that WINPOP outperforms the baseline approach (BOX 1). Other recently developed approaches use principal components analysis to infer ancestry within each window4,26.
Approaches that model LD between markers
Local-ancestry inference methods that explicitly model LD in ancestral populations offer the potential for higher accuracy, both because allowing linked markers enables information from a larger set of SNPs to be used and because haplotypes are more differentiated between populations than individual SNPs. The SABER method27 accounts for LD in ancestral populations by using a Markov-hidden Markov model (MHMM) to model LD between consecutive markers. This first implementation of a method that models LD in ancestral populations was a key development in research on local-ancestry inference, although a potential concern is that of incomplete modelling of LD between non-consecutive markers17. Consequently, more recent HMM-based methods explicitly model entire haplotypes using phased haplotypes from ancestral reference populations that are provided as input. This approach has been implemented in HAPAA28 and HAPMIX29, both of which use a nested HMM that includes a large-scale HMM involving transitions between ancestry states7,12, as well as a small-scale HMM involving transitions between haplotypes within an ancestral population30. The two methods are similar, but HAPMIX (in contrast to HAPAA) permits small rates of miscopying from the ancestral haplotype, models unphased diploid data from the admixed population within the HMM and computes estimates of uncertainty in the inferred local-ancestry segments. However, a limitation of HAPMIX is that the current implementation does not support multi-way admixture. Our simulations indicate that HAPMIX performs well relative to other local-ancestry inference methods, albeit at a cost of increased complexity and running time (BOX 1). Finally, another approach that makes use of ancestral haplotypes, implemented in the GEDI-ADMX software31, is to assume homogeneous local ancestry within a window and to assign local ancestry according to the set of ancestral reference haplotypes that yields the highest imputation performance within each window.
Ongoing challenges
It is crucial that local-ancestry inference methods do not produce artefactual deviations — which we define as systematic deviations in inferred average local ancestry at a locus that do not reflect true local ancestry — because such deviations can lead to false-positive admixture associations. We recently reported that analyses of >6,000 unrelated African Americans using either ANCESTRYMAP or HAPMIX methods did not produce artefactual deviations in average local ancestry32. However, we believe that considerable challenges remain for other admixed populations, such as Latinos. Our simulations of two-way and three-way admixed Latino populations25 have shown that WINPOP and other methods provide estimates of local ancestry that are only somewhat less accurate than the results shown in BOX 1 (this is as expected, because the accuracy of local-ancestry inference is a function of genetic distance between ancestral populations25). However, our preliminary analyses of real Latino data produced artefactual deviations in average local ancestry (D. Reich, A.L.P. and colleagues, unpublished data). These deviations vary with the choice of ancestral populations, which is consistent with the well-known difficulties in choosing accurate ancestral populations for Latinos4,15. This is in contrast to African Americans, who are extremely well-modelled as a linear combination of African (YRI, Yoruba in Ibadan, Nigeria) and European (CEU, Utah residents with northern and western European ancestry from the CEPH collection) populations29. A final concern is that existing methods for multi-way, local-ancestry inferences show biases in their miscalled segments (for example, a true Native American segment is more likely to be miscalled as European than as African), which further complicates admixture scoring. Because of these challenges, admixture mapping studies in Latino populations have generally focused on case–control admixture association9,33 — but we caution that it is crucial to correct for genome-wide ancestry in case–control admixture association statistics to avoid spurious associations11.
GWASs in admixed populations
Combining SNP and admixture association
GWASs of >100,000 markers are an appealing alternative to admixture mapping owing to both the limited power of admixture mapping to identify genetic risk variants with similar frequencies across ancestral populations and to the decreasing cost of GWAS chips. GWASs have traditionally focused on homogeneous populations such as Europeans; however, GWASs in admixed populations offer the promise of probing additional genetic variation and making discoveries that would have been missed by exclusively studying European populations13. Accordingly, GWASs in African Americans, Latinos and other admixed populations are now underway34–36. Although GWASs and admixture mapping have historically been viewed as distinct approaches, SNP and admixture association signals contain independent information and can complement each other37. We have recently developed a new χ2 (1 degree of freedom (1 df)) test that combines these signals in the context of case–control studies (MIXSCORE software)32. The MIXSCORE approach requires local-ancestry estimates as input, which can be estimated by any method. The combined χ2(1 df) statistic aggregates evidence of case–control SNP association and case-only admixture association using the implied ancestry odds ratio (BOX 2). The combined test shows a substantial gain in power compared to other approaches, with a particularly large improvement for SNPs with large allele frequency differences between ancestral populations (BOX 2). This approach is likely to be useful in GWASs of African Americans, and future modifications may enable the incorporation of covariates. For other admixed populations, such as Latinos, ongoing challenges in local ancestry inference and resulting case-only admixture statistics merit caution in the use of the combined test, and our current recommendation is to compute case–control SNP association statistics with correction for genome-wide ancestry.
Box 2. Combining case–control SNP association and case-only admixture association.
Below we describe four statistical tests that have been used in studies of admixed populations. All four of these tests are implemented in the MIXSCORE software.
Armitage trend test (ATT)
This test is for case–control SNP association and computes a χ2 (1 degree of freedom (1 df)) statistic equal to
| (1) |
where N is the total number of individuals, G is a vector of genotypes, ϕ is a vector of phenotypes and ρ denotes correlation. The test can be generalized to correct for either genome-wide ancestry or local ancestry11. The ATT with correction for genome-wide ancestry is the method of choice when conducting association studies in admixed populations without harnessing the advantages of admixture association.
Case-only admixture association (ADM)
A χ2(1 df) likelihood ratio test can be used to assess the hypothesis of ancestry odds ratio Ω different from 1. The log-likelihood is defined as
| (2) |
where θ is the genome-wide European ancestry proportion in disease cases and NEur (NAfr) denotes the number of copies of European (African) local ancestry at the candidate locus in disease cases. A χ2(1 df) statistic is defined as twice the difference in log-likelihood between the causal model and the null model (Ω = 1). It is straightforward to generalize the test to incorporate a different value of genome-wide ancestry in each admixed individual7,32, and we note that the case-only statistic is more powerful than comparing local ancestry in cases versus controls, as there is no statistical noise introduced from controls7.
Sum of case–control SNP association and case-only admixture association (SUM)
SNP association and case-only admixture association tests can be summed to produce a χ2(2 df) statistic; however, in this case it is important that the SNP association test be corrected for local ancestry to ensure that the two signals are independent and the correct null distribution is obtained32,36. An alternative approach to summing SNP and admixture association statistics while preserving the correct null distribution is to model the 2 × 2 covariance of case–control SNP association and case–control admixture association signals37.
Combined case-only admixture and SNP case–control association (MIX)
The combined test relies on the relationship between the SNP odds ratio
| (3) |
where p+(p−) denotes the allele frequency of the SNP in cases (controls) and the ancestry odds ratio
| (4) |
where γ+(γ−) denotes the proportion of European local ancestry at the candidate locus in cases (controls). Assuming a single causal variant with the same odds ratio R for either European and African local ancestry, the implied ancestry odds ratio is equal to
| (5) |
where pEur(pAfr) denotes the allele of the SNP in European (African) controls.
It follows that a χ2(1 df) likelihood ratio test can be used to assess the joint hypothesis of odds ratio R and implied ancestry odds ratio Ω(R) different from 1. The log-likelihood is defined as
| (6) |
where Ladmx(Ω(R)) is as defined above and LEur(R) and LAfr(R) are case–control SNP likelihood ratios specific to European or African local ancestry, which allow for different allele frequencies pEur and pAfr in controls but assume the same SNP odds ratio R for each local ancestry.
Comparison of scoring statistics
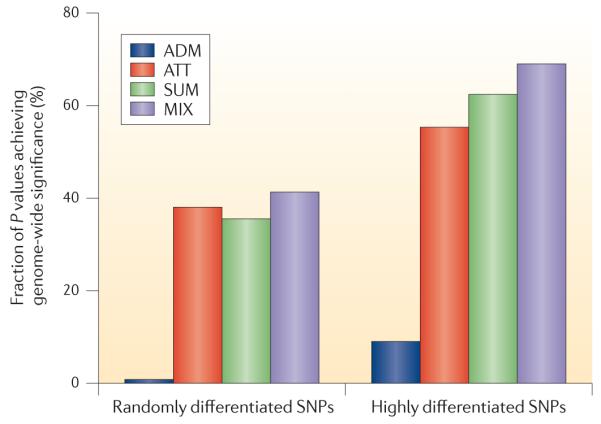
We computed the power of each method to attain genome-wide significance, which is defined based on a P value threshold of 5 × 10⁻⁸ for ATT, SUM and MIX and 1 × 10⁻⁵ for ADM (which has a decreased multiple hypothesis testing burden based on the lengths of chromosomal segments)32,36 (see the figure). Our results are based on simulations of causal SNPs that are either randomly differentiated or highly differentiated (allele frequency difference >40% between Europeans and Africans). The simulations were performed starting with 100,000 random autosomal SNPs extracted from real genotypes in 6,209 African Americans32. Using a causal model with a genotypic odds ratio of 1.5, a total of 1,000 cases and 1,000 controls were simulated. As shown in the figure, MIX versus ATT produces a modest increase in power (41.3% versus 38%; 9% improvement) for randomly differentiated SNPs and a large increase in power (69.0% versus 55.3%; 25% improvement) for highly differentiated SNPs.
Additional considerations
Imputation in admixed populations
A key consideration is how to best use genotyping and sequencing data from the International HapMap Project and the 1000 Genomes Project to perform imputation in admixed populations13,38.
One approach is to impute SNPs in the admixed population using a combined reference panel of haplotypes from the ancestral populations36,38 or from all available reference populations. Current studies suggest that using all of the available disparate population information only increases the accuracy of imputation (J. Marchini and B. Howie, personal communication; M.F.S., unpublished data). An alternative approach is to use local ancestry to guide the choice of reference haplotypes, which, in limited analyses, has been shown to give a marginal improvement in imputation accuracy32. Additional studies will be necessary to determine the ideal method, which may depend on the choice of admixed population, the accuracy of local-ancestry assignment and the size of the available reference panels. A final concern for imputation in admixed populations is differences in imputation quality across segments of different ancestries. For example, European chromosomes are imputed more accurately than African chromosomes in African Americans, which can induce artificial heterogeneity in effect size at imputed causal SNPs. This can occur even when the true effect size is homogeneous across populations but can be addressed by adjusting the observed effect sizes for differences in imputation quality32.
Fine-mapping of causal variants
An area of research in which admixed populations have yet to show their full potential is the fine-mapping of causal variants at associated loci from GWASs. Populations of distinct ancestry are valuable for localization of causal variants owing to their different LD patterns39, and empirical fine-mapping studies have already taken advantage of LD differences between continental populations to help localize causal variants40. However, the development of fine-mapping statistics to optimally leverage different LD patterns at the level of chromosomal segments in admixed populations remains an open research direction. A pertinent question is whether causal variants have similar effect sizes in different populations, as suggested by recent studies of some traits41,42. Fine-mapping studies in admixed populations must account for the fact that, when not adjusting for local ancestry, admixture LD can produce associations involving variants that are distant from the causal variant43. The semantic point of whether such associations should be viewed as spurious associations or as true associations arising from admixture LD is immaterial to the choice of statistical test. We note that admixture association can actually be used to improve fine-mapping resolution by checking whether the level of admixture association that would be expected based on the population differentiation of a putatively causal SNP is actually observed.
Potential effects of epistasis
It is possible that epistasis may have an impact on the effect size of a genetic variant, depending on the genetic background of different population groups. At present, there is little evidence of such effects in studies of human traits41,42, but studies in mice suggest that epistasis may prove important to understanding complex-trait genetics44. In this case, it will be particularly important to study the genetics of complex disease in admixed populations in which the epistatic interactions may be unique and, potentially, to identify novel associations that would not be evident in the original populations.
Conclusion
We have highlighted recent progress in the development of methods to study complex-disease genetics in admixed populations. The rapid expansion of public resources, including genotype and sequence data from diverse ancestral populations and continued development of statistical methodology, bodes well for the future of genetic studies in admixed population groups. As we have discussed, the increased genetic diversity in admixed populations may enhance the identification of genetic risk variants underlying disease phenotypes. Thus, studies in admixed populations will complement studies in homogenous populations with ancestry from a single continent.
Acknowledgements
The authors are grateful to N. Patterson, D. Reich, A. Williams and N. Zaitlen for helpful discussions. This work was funded by US National Institutes of Health grants RC1 GM091332 (B.P. and A.L.P.), R01 AR050267 and R01 DK071185 (M.F.S.).
Glossary
- Admixture mapping
A technique for mapping a risk locus for a specific trait based on a statistical signal of unusual local ancestry at the risk locus.
- Ancestry-informative markers
(AIMs). Markers with large differences in allele frequency between two or more populations that can be used to infer genetic ancestry.
- Cline
A continuum of genetic ancestry formed by migration or admixture between two populations.
- Genome-wide ancestry
The overall genetic ancestry of an individual as determined from SNP genotypes or other data distributed across autosomal chromosomes.
- Hidden Markov model
(HMM). A generalization of a mixture model in which data are generated as a function of unknown (hidden) states, with transitions between states governed by a Markov process.
- Imputation
The inference of genotypes of markers that have not been directly genotyped by making use of information from haplotype reference panels such as the HapMap or 1000 Genomes panels.
- Local ancestry
The genetic ancestry of an individual at a particular chromosomal location, defined as 0, 1 or 2 copies from each ancestral population considered.
- Multi-way admixture
We use this term to indicate admixture between more than two continental population groups, such as in Latinos who descend from admixture between Europeans, Native Americans and West Africans.
- Principal components analysis
A dimensionality reduction technique used to infer continuous axes of variation in genetic data, often representing genetic ancestry.
- Two-way admixture
In this article, this term indicates admixture between two continental population groups, such as in African Americans who descend from admixture between Europeans and West Africans.
Footnotes
Competing interests statement The authors declare no competing financial interests.
FURTHER INFORMATION
Michael F. Seldin’s homepage: http://www.ucdmc.ucdavis.edu/biochem/our-team/seldin.html Alkes L. Price’s homepage: http://www.hsph.harvard.edu/faculty/alkes-price
DATABASES
1000 Genomes Project: http://www.1000genomes.org Human Genome Diversity Project genotypes: http://hagsc.org/hgdp/files.html International HapMap Project and International HapMap 3 Project: http://www.hapmap.org
SOFTWARE
ADMIXMAP software: http://www.homepages.ed.ac.uk/pmckeigu/software.html
ANCESTRYMAP software: http://genepath.med.harvard.edu/~reich/Software.htm
EIGENSOFT software: http://www.hsph.harvard.edu/faculty/alkes-price/software
GEDI-ADMX software: http://dna.engr.uconn.edu/software
HAPAA software: http://hapaa.stanford.edu/Code.html
HAPMIX software: http://www.stats.ox.ac.uk/~myers/software.html
LAMP and WINPOP software: http://lamp.icsi.berkeley.edu/lamp
MALDsoft software: http://pritch.bsd.uchicago.edu/software.html
MIXSCORE software: http://www.hsph.harvard.edu/faculty/alkes-price/software
SABER software: http://med.stanford.edu/tanglab/software
ALL LINKS ARE ACTIVE IN THE ONLINE PDF
References
- 1.Smith MW, et al. A high-density admixture map for disease gene discovery in African Americans. Am. J. Hum. Genet. 2004;74:1001–1013. doi: 10.1086/420856. [DOI] [PMC free article] [PubMed] [Google Scholar]
- 2.Tian C, et al. A genomewide single-nucleotide-polymorphism panel with high ancestry information for African American admixture mapping. Am. J. Hum. Genet. 2006;79:640–649. doi: 10.1086/507954. [DOI] [PMC free article] [PubMed] [Google Scholar]
- 3.Haiman CA, et al. Multiple regions within 8q24 independently affect risk for prostate cancer. Nature Genet. 2007;39:638–644. doi: 10.1038/ng2015. [DOI] [PMC free article] [PubMed] [Google Scholar]
- 4.Bryc K, et al. Colloquium paper: genome-wide patterns of population structure and admixture among Hispanic/Latino populations. Proc. Natl Acad. Sci. USA. 2010;107(Suppl. 2):8954–8961. doi: 10.1073/pnas.0914618107. [DOI] [PMC free article] [PubMed] [Google Scholar]
- 5.Xu S, Huang W, Qian J, Jin L. Analysis of genomic admixture in Uyghur and its implication in mapping strategy. Am. J. Hum. Genet. 2008;82:883–894. doi: 10.1016/j.ajhg.2008.01.017. [DOI] [PMC free article] [PubMed] [Google Scholar]
- 6.de Wit E, et al. Genome-wide analysis of the structure of the South African Coloured population in the Western Cape. Hum. Genet. 2010;128:145–153. doi: 10.1007/s00439-010-0836-1. [DOI] [PubMed] [Google Scholar]
- 7.Smith MW, O’Brien SJ. Mapping by admixture linkage disequilibrium: advances, limitations and guidelines. Nature Rev. Genet. 2005;6:623–632. doi: 10.1038/nrg1657. [DOI] [PubMed] [Google Scholar]
- 8.Florez JC, et al. Strong association of socioeconomic status with genetic ancestry in Latinos: implications for admixture studies of type 2 diabetes. Diabetologia. 2009;52:1528–1536. doi: 10.1007/s00125-009-1412-x. [DOI] [PMC free article] [PubMed] [Google Scholar]
- 9.Yang JJ, et al. Ancestry and pharmacogenomics of relapse in acute lymphoblastic leukemia. Nature Genet. 2011;43:237–241. doi: 10.1038/ng.763. [DOI] [PMC free article] [PubMed] [Google Scholar]
- 10.Grossman SR, et al. A composite of multiple signals distinguishes causal variants in regions of positive selection. Science. 2010;327:883–886. doi: 10.1126/science.1183863. [DOI] [PubMed] [Google Scholar]
- 11.Price AL, Zaitlen NA, Reich D, Patterson N. New approaches to population stratification in genome-wide association studies. Nature Rev. Genet. 2010;11:459–463. doi: 10.1038/nrg2813. [DOI] [PMC free article] [PubMed] [Google Scholar]
- 12.Seldin MF. Admixture mapping as a tool in gene discovery. Curr. Opin. Genet. Dev. 2007;17:177–181. doi: 10.1016/j.gde.2007.03.002. [DOI] [PMC free article] [PubMed] [Google Scholar]
- 13.Rosenberg NA, et al. Genome-wide association studies in diverse populations. Nature Rev. Genet. 2010;11:356–366. doi: 10.1038/nrg2760. [DOI] [PMC free article] [PubMed] [Google Scholar]
- 14.Price AL, et al. A genomewide admixture map for Latino populations. Am. J. Hum. Genet. 2007;80:1024–1036. doi: 10.1086/518313. [DOI] [PMC free article] [PubMed] [Google Scholar]
- 15.Tian C, et al. A genomewide single-nucleotide-polymorphism panel for Mexican American admixture mapping. Am. J. Hum. Genet. 2007;80:1014–1023. doi: 10.1086/513522. [DOI] [PMC free article] [PubMed] [Google Scholar]
- 16.Tang H, et al. Recent genetic selection in the ancestral admixture of Puerto Ricans. Am. J. Hum. Genet. 2007;81:626–633. doi: 10.1086/520769. [DOI] [PMC free article] [PubMed] [Google Scholar]
- 17.Price AL, et al. Long-range LD can confound genome scans in admixed populations. Am. J. Hum. Genet. 2008;83:132–135. doi: 10.1016/j.ajhg.2008.06.005. author reply 135–139. [DOI] [PMC free article] [PubMed] [Google Scholar]
- 18.Zhu X, et al. Admixture mapping for hypertension loci with genome-scan markers. Nature Genet. 2005;37:177–181. doi: 10.1038/ng1510. [DOI] [PubMed] [Google Scholar]
- 19.Freedman ML, et al. Admixture mapping identifies 8q24 as a prostate cancer risk locus in African-American men. Proc. Natl Acad. Sci. USA. 2006;103:14068–14073. doi: 10.1073/pnas.0605832103. [DOI] [PMC free article] [PubMed] [Google Scholar]
- 20.Kao WH, et al. MYH9 is associated with nondiabetic end-stage renal disease in African Americans. Nature Genet. 2008;40:1185–1192. doi: 10.1038/ng.232. [DOI] [PMC free article] [PubMed] [Google Scholar]
- 21.Nalls MA, et al. Admixture mapping of white cell count: genetic locus responsible for lower white blood cell count in the Health ABC and Jackson Heart studies. Am. J. Hum. Genet. 2008;82:81–87. doi: 10.1016/j.ajhg.2007.09.003. [DOI] [PMC free article] [PubMed] [Google Scholar]
- 22.Reich D, et al. Reduced neutrophil count in people of African descent is due to a regulatory variant in the Duffy antigen receptor for chemokines gene. PLoS Genet. 2009;5:e1000360. doi: 10.1371/journal.pgen.1000360. [DOI] [PMC free article] [PubMed] [Google Scholar]
- 23.Tandon A, Patterson N, Reich D. Ancestry informative marker panels for African Americans based on subsets of commercially available SNP arrays. Genet. Epidemiol. 2011;35:80–83. doi: 10.1002/gepi.20550. [DOI] [PMC free article] [PubMed] [Google Scholar]
- 24.Sankararaman S, Sridhar S, Kimmel G, Halperin E. Estimating local ancestry in admixed populations. Am. J. Hum. Genet. 2008;82:290–303. doi: 10.1016/j.ajhg.2007.09.022. [DOI] [PMC free article] [PubMed] [Google Scholar]
- 25.Pasaniuc B, Sankararaman S, Kimmel G, Halperin E. Inference of locus-specific ancestry in closely related populations. Bioinformatics. 2009;25:i213–i221. doi: 10.1093/bioinformatics/btp197. [DOI] [PMC free article] [PubMed] [Google Scholar]
- 26.Pugach I, Matveyev R, Wollstein A, Kayser M, Stoneking M. Dating the age of admixture via wavelet transform analysis of genome-wide data. Genome Biol. 2011;12:R19. doi: 10.1186/gb-2011-12-2-r19. [DOI] [PMC free article] [PubMed] [Google Scholar]
- 27.Tang H, Coram M, Wang P, Zhu X, Risch N. Reconstructing genetic ancestry blocks in admixed individuals. Am. J. Hum. Genet. 2006;79:1–12. doi: 10.1086/504302. [DOI] [PMC free article] [PubMed] [Google Scholar]
- 28.Sundquist A, Fratkin E, Do CB, Batzoglou S. Effect of genetic divergence in identifying ancestral origin using HAPAA. Genome Res. 2008;18:676–682. doi: 10.1101/gr.072850.107. [DOI] [PMC free article] [PubMed] [Google Scholar]
- 29.Price AL, et al. Sensitive detection of chromosomal segments of distinct ancestry in admixed populations. PLoS Genet. 2009;5:e1000519. doi: 10.1371/journal.pgen.1000519. [DOI] [PMC free article] [PubMed] [Google Scholar]
- 30.Li N, Stephens M. Modeling linkage disequilibrium and identifying recombination hotspots using single-nucleotide polymorphism data. Genetics. 2003;165:2213–2233. doi: 10.1093/genetics/165.4.2213. [DOI] [PMC free article] [PubMed] [Google Scholar]
- 31.Pasaniuc B, Kennedy J, Mandoiu I. Imputation-based local ancestry inference in admixed populations. Lect. Notes Comp. Sci. 2009;5542:221–233. [Google Scholar]
- 32.Pasaniuc B, et al. Enhanced statistical tests for GWAS in admixed populations: assessment using African Americans from CARe and a breast cancer consortium. PLoS Genet. 2011;7:e1001371. doi: 10.1371/journal.pgen.1001371. [DOI] [PMC free article] [PubMed] [Google Scholar]
- 33.Adler S, et al. Mexican-American admixture mapping analyses for diabetic nephropathy in type 2 diabetes mellitus. Semin. Nephrol. 2010;30:141–149. doi: 10.1016/j.semnephrol.2010.01.005. [DOI] [PMC free article] [PubMed] [Google Scholar]
- 34.Hancock DB, et al. Genome-wide association study implicates chromosome 9q21.31 as a susceptibility locus for asthma in Mexican children. PLoS Genet. 2009;5:e1000623. doi: 10.1371/journal.pgen.1000623. [DOI] [PMC free article] [PubMed] [Google Scholar]
- 35.Adeyemo A, et al. A genome-wide association study of hypertension and blood pressure in African Americans. PLoS Genet. 2009;5:e1000564. doi: 10.1371/journal.pgen.1000564. [DOI] [PMC free article] [PubMed] [Google Scholar]
- 36.Lettre G, et al. Genome-wide association study of coronary heart disease and its risk factors in 8090 African Americans: the NHLBI CARe Project. PLoS Genet. 2011;7:e1001300. doi: 10.1371/journal.pgen.1001300. [DOI] [PMC free article] [PubMed] [Google Scholar]
- 37.Tang H, Siegmund DO, Johnson NA, Romieu I, London SJ. Joint testing of genotype and ancestry association in admixed families. Genet. Epidemiol. 2010;34:783–791. doi: 10.1002/gepi.20520. [DOI] [PMC free article] [PubMed] [Google Scholar]
- 38.Marchini J, Howie B. Genotype imputation for genome-wide association studies. Nature Rev. Genet. 2010;11:499–511. doi: 10.1038/nrg2796. [DOI] [PubMed] [Google Scholar]
- 39.Zaitlen N, Pasaniuc B, Gur T, Ziv E, Halperin E. Leveraging genetic variability across populations for the identification of causal variants. Am. J. Hum. Genet. 2010;86:23–33. doi: 10.1016/j.ajhg.2009.11.016. [DOI] [PMC free article] [PubMed] [Google Scholar]
- 40.Udler MS, et al. FGFR2 variants and breast cancer risk: fine-scale mapping using African American studies and analysis of chromatin conformation. Hum. Mol. Genet. 2009;18:1692–1703. doi: 10.1093/hmg/ddp078. [DOI] [PMC free article] [PubMed] [Google Scholar]
- 41.Teslovich TM, et al. Biological, clinical and population relevance of 95 loci for blood lipids. Nature. 2010;466:707–713. doi: 10.1038/nature09270. [DOI] [PMC free article] [PubMed] [Google Scholar]
- 42.Waters KM, et al. Consistent association of type 2 diabetes risk variants found in europeans in diverse racial and ethnic groups. PLoS Genet. 2010;6:e1001078. doi: 10.1371/journal.pgen.1001078. [DOI] [PMC free article] [PubMed] [Google Scholar]
- 43.Wang X, et al. Adjustment for local ancestry in genetic association analysis of admixed populations. Bioinformatics. 2011;27:670–677. doi: 10.1093/bioinformatics/btq709. [DOI] [PMC free article] [PubMed] [Google Scholar]
- 44.Shao H, et al. Genetic architecture of complex traits: large phenotypic effects and pervasive epistasis. Proc. Natl Acad. Sci. USA. 2008;105:19910–19914. doi: 10.1073/pnas.0810388105. [DOI] [PMC free article] [PubMed] [Google Scholar]