Abstract
Comprehensive identification of DNA cis-regulatory elements is crucial for a predictive understanding of transcriptional network dynamics. Strong evidence suggests that these DNA sequence motifs are highly conserved between related species, reflecting strong selection on the network of regulatory interactions that underlie common cellular behavior. Here, we exploit a systems-level aspect of this conservation—the network-level topology of these interactions—to map transcription factor (TF) binding sites on a genomic scale. Using network-level conservation as a constraint, our algorithm finds 71% of known TF binding sites in the yeast Saccharomyces cerevisiae, using only 12% of the sequence of a phylogenetic neighbor. Most of the novel predicted motifs show strong features of known TF binding sites, such as functional category and/or expression profile coherence of their corresponding genes. Network-level conservation should provide a powerful constraint for the systematic mapping of TF binding sites in the larger genomes of higher eukaryotes.
Efficient identification of DNA cis-regulatory elements is a central challenge of post-genome biology. The confluence of wholegenome DNA sequence data, high-throughput technologies, and novel algorithms is rapidly advancing our ability to identify and characterize transcriptional regulatory elements (Eisen et al. 1998; Tavazoie et al. 1999; Bussemaker et al. 2001; Lee et al. 2002). However, these approaches have inherent limitations. For example, the success of hybrid methods which use geneexpression clustering and cis-regulatory motif discovery is limited by the range of physiological perturbations used in the laboratory. The same is true for in vivo approaches such as chip-based chromatin immunoprecipitation (ChIP), where DNA–protein interactions, by the very virtue of their regulatory role, only occur under specific environmental conditions (Lee et al. 2002). These limitations are even more severe for metazoan eukaryotes, where the experimental data are more difficult to acquire.
An alternative approach for identifying functional regulatory elements is to infer them from noncoding DNA-sequence conservation between closely related species. This strategy, termed phylogenetic footprinting (Tagle et al. 1988; Gumucio et al. 1992), has been successfully applied to single genomic loci (Aparicio et al. 1995; Cliften et al. 2001). The availability of whole-genome DNA sequence data for a large number of bacterial species has facilitated the mapping of whole genomes for such elements (McGuire et al. 2000; McCue et al. 2001; Li et al. 2002; Rajewsky et al. 2002). An elegant approach to mapping conserved sites, which does not depend on global alignments and which makes use of the phylogenetic relationship between the species, was presented by Blanchette and Tompa (2002). The recent sequencing of multiple yeast species has allowed the whole-genome extension of these methods to simple eukaryotes, and two recent studies have shown that a significant fraction of known TF binding sites can be identified by looking for conservation of small regions within multiple alignments of upstream regulatory regions (Cliften et al. 2003; Kellis et al. 2003). An assumption crucial to the success of these methods is that regulatory regions can be robustly aligned by multiple-sequence alignment algorithms such as CLUSTAL W (Thompson et al. 1994). In the studies above, this requirement is generally satisfied—given the modest divergence of these species, and the use of multiple sequences. However, more distant phylogenetic comparisons will generally not meet this requirement, given the relatively short length of functional binding sites (∼10 bp) and the large number of insertion/deletion events within regulatory regions. These limitations are exacerbated as we aim to apply these approaches to the much larger genomes of multicellular organisms, where orthologous regulatory elements can be found tens of kilobases away from the gene. For example, a cogent case can be made for identifying conserved binding sites between distant vertebrates with noncoding regions that are vastly diverged in sequence and differ in size by an order of magnitude (e.g., Fugu rubripes vs. H. sapiens; Gilligan et al. 2002). To address these limitations, we present a novel whole-genome algorithm for finding conserved TF binding sites. Our approach does not depend on global alignments, or even the availability of sequences from multiple species. We exploit the well established notion that each transcription factor regulates the expression of many (20–400) genes in the genome, and that the conservation of global gene expression between two closely related species requires most of these targets to maintain their regulation. This “network-level” conservation represents a systems-level constraint on functional TF binding sites. Here, we show strong evidence for this conservation, and use it to generate high-confidence predictions of TF binding sites on a genomic scale. Unlike previous approaches, our method requires only a fraction (12%) of the sequence of another species, and generates a large number of predictions with strong evidence for biological significance.
RESULTS
Identifying Candidate Motif Predictions
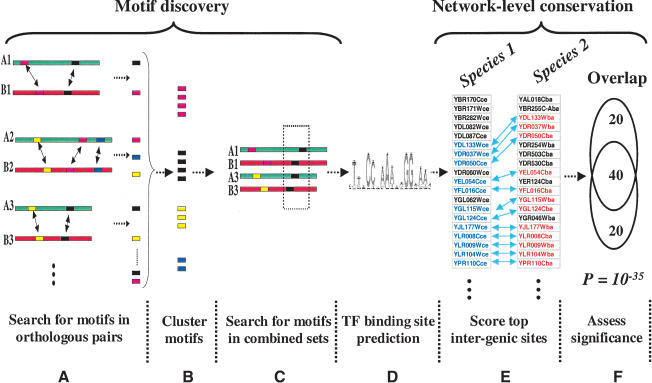
We gathered and assembled partial shotgun DNA sequence data from 13 hemiascomycetous yeast species, kindly provided by the Genolevures consortium (Souciet et al. 2000). We used reciprocal best BLAST (Altschul et al. 1990) matches to identify pairs of orthologous genes between Saccharomyces cerevisiae and all other species. The partial sequence data of Saccharomyces bayanus provided us with 715 orthologous pairs of genes with 200 bp or greater 5′ upstream sequences. The regulatory (upstream) regions of orthologous gene-pairs were then used to search for significant motifs using the Gibbs-sampling algorithm (Lawrence et al. 1993; Roth et al. 1998) in the AlignACE software package (Fig. 1A). On average, each pair of orthologs yielded ∼17 motifs, providing 12,047 total primary predictions. Many identical or very similar motifs were generated by AlignACE. To remove redundancy, and to expand motif-containing sequences from pairs of orthologs to larger sets, the motifs were clustered (Fig. 1B) using a previously developed motif similarity measure called CompareACE (J. Hughes et al. 2000; also see Methods). In order to develop a more informative definition of each motif, a second round of motif searching was performed on the combined set of upstream regions which contributed motifs to each motif cluster (Fig. 1C). We reasoned that this second iteration of motif searching would yield a better definition of the underlying binding site because multiple instances of the motif were present. The distribution of orthologous pairs per search ranged from 2–58. As expected, these searches identified many more motifs (∼40 per search) than were found in the first round, yielding ∼80,000 total motif predictions. Among this large set of predictions were many motifs representing known TF binding sites. However, a large fraction of these motifs likely arose from nonfunctional local sequence conservation and had to be filtered out (Fig. 1D).
Figure 1.
Schematic representation of the algorithm. (A) Upstream sequences from orthologous pairs of genes are searched to identify motifs using Gibbs-sampling. (B) Motif predictions are pooled and clustered by similarity. (C) The pairs of upstream sequences which yielded similar motifs (within a motif cluster) are combined and searched again for motifs using a second round of Gibbs-sampling. (D) A large number of motif predictions which need to be pruned. (E) To test for network-level conservation, the genes containing the top intergenic (5′ upstream) matches to each motif are identified in the two species. (F) The statistical significance of overlap between the two sets of genes is determined using the hypergeometric distribution.
Constraining Motif Predictions by Network-Level Conservation
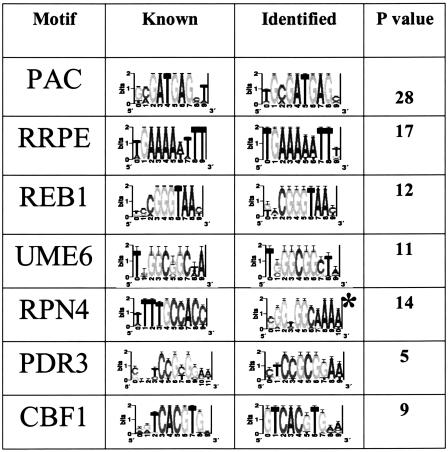
A crucial component of our approach was to exploit network-level conservation to identify high-confidence predictions (Fig. 1E,F). We reasoned that DNA-binding sites which fulfill orthologous regulatory function should be found upstream of the same set of genes in the two organisms. Network-level conservation demands that each motif prediction identify strong matches upstream of a significant number of common genes between the two organisms (see Methods). The statistical significance of this conservation was assessed by using the hypergeometric distribution (see Methods). We found a large number of motifs with extremely high significance (P-values below 10-10) which had particularly high similarity to known binding sites. At the top of this set, we found strong matches to the two motifs named PAC and RRPE, with P-values of 10-28 and 10-17, respectively. These motifs, originally named M3a and M3b, were identified from expression-clustering and motif analysis (Tavazoie et al. 1999) and have been shown to co-occur upstream of a large number of genes involved in transcribing and processing ribosomal RNAs (Tavazoie et al. 1999; J. Hughes et al. 2000; Sudarsanam et al. 2002).
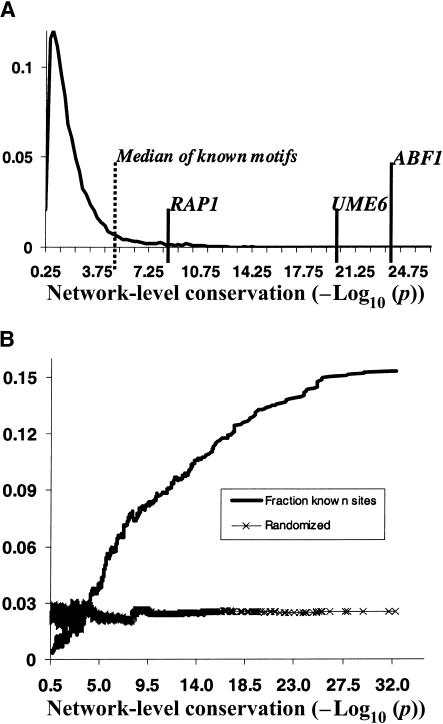
An important question was the distribution of hypergeometric P-values for random motifs. We were curious to what extent the common ancestry of two species contributed to the generation of significant network-level conservation due to background nonfunctional sequence conservation alone. To this end, we randomly permuted the weight-matrix columns of a set of 10,000 identified motifs, and looked at the distribution of hypergeometric P-values for network-level conservation. As can be seen in Figure 2A, the bulk of this distribution lies to the left of 3 (P > 10-3; the threshold we chose for significant network-level conservation). This constraint automatically excluded the majority of the original predictions, leaving 16% (∼12,000) behind. After filtering out low-complexity motifs (poly A/T sequences), we were left with 7673 motif predictions which contained significant amounts of redundancy (many AlignACE runs produced very similar motifs). These motifs were then hierarchically clustered by motif similarity using the CompareACE algorithm, yielding 1269 motif clusters which ranged in size from 2–89 members each (see Methods). From each of these clusters, a motif (chosen to have the most significant network-level conservation; lowest P-value) was selected as an exemplar. In deciding the parameters of motif clustering, we had to balance competing demands: (1) reducing the total number of motif predictions, and (2) not merging motifs which may be biologically distinct. In the end, we chose to retain more diversity, at the cost of maintaining a larger number of predictions.
Figure 2.
Most significantly conserved motifs are highly enriched in known TF binding sites. (A) The distribution of network-level conservation significance (-Log10(p)) for a set of 10,000 random motifs. The median value for the 48 known TF binding sites is 4.5 (vertical dashed line). A representative set of conserved known TF binding sites is highlighted on the tail of the distribution. (B) The fraction of strong matches to known TF binding sites in a 2000 wide sliding window across the entire P-value distribution of all the 80,000 secondary motifs.
Validation
To assess the algorithm's success in identifying real binding sites, we compared our motif predictions against a set of 48 weight-matrices which correspond to known S. cerevisiae binding sites. We found that the algorithm identified 71% (34/48) of these sites at a stringent level of similarity (CompareACE score above 0.75). In many cases, a known binding site had high similarity to multiple predictions, reflecting residual redundancy in the set. From this roughly threefold redundancy, we estimate that the 1269 motifs represent approximately 400 actual binding sites. Table 1 shows some of these motifs using their sequence logo representation (Schneider and Stephens 1990).
Table 1.
Identification of Known Binding Sites
Columns: (1) binding site (motif) name, (2) sequence-logo representation of known binding site, (3) sequence-logo representation of the best phylogenetically mapped motif (* reverse complement), (4) P-value for network-level conservation (Log10(p)) of the best matching phylogenetically mapped motif.
To get a better sense of the relationship between network-level conservation P-value and propensity for being a real TF binding site, we quantified the fraction of strong matches to known motifs in a 2000 wide sliding window across the P-value distribution of the entire set of ∼80,000 secondary motifs. As can be seen in Figure 2B, there is a strong correlation between network-level conservation P-value and the fraction of known TF binding sites. In fact, at the most significant P-values, more than 15% of phylogenetically mapped motifs match known TF binding sites. Interestingly, the binding site for the global transcription factor PHO4 was not among our predictions. We were interested in whether our incomplete coverage of known binding sites reflected lack of conservation, or whether some systematic aspect of our approach excluded them from discovery. To this end, each of the 48 known motifs was tested for network-level conservation between S. cerevisiae and S. bayanus. The median network-level conservation P-value for the entire set was 4.5 (see Fig. 2A), with many motifs (e.g., RAP1, UME6, ABF1) scoring much better (25% had P-values < 10-8). As expected, there was significant concordance between the known motifs exhibiting network-level conservation and those that our algorithm identified de novo. Consistent with our de novo approach, the binding site for PHO4 was not significantly conserved between S. cerevisiae and S. bayanus. With the exception of the binding sites for CAD1, MCM1, MIG1, SUM1, YAP1, and ZAP1, the algorithm identified all known conserved binding sites, giving an overall sensitivity of 82%.
Biological Significance of Binding Site Predictions
Functional Coherence
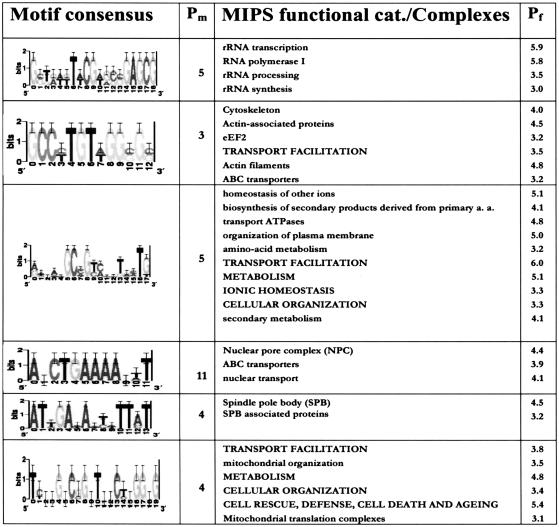
We and others have shown that, in general, transcriptionally coregulated genes are statistically enriched for genes within the same functional category, or biological function (Eisen et al. 1998; Spellman et al. 1998; Tavazoie et al. 1999). In the absence of any further experimental work, data sets of gene function and phenotype (e.g., MIPS, Mewes et al. 2002; G.O., Hill et al. 2002) can be used as a preliminary and systematic means of assessing biological significance of putative transcription factor binding sites. By observing significant overlap between a set of motifcontaining genes and each of 476 gene-function and molecular complex classes from MIPS, we were able to assign biological significance, and in some cases, a putative biological role to 618 motif predictions. As expected, many of these motifs show functional coherence in categories with previously unknown transcriptional regulatory mechanisms. Table 2 shows some of these motifs, in their sequence logo format.
Table 2.
Novel Putative Binding Sites With Functional Category Enrichment
Columns: (1) sequence-logo representation of motif, (2) Network-level conservation P-value (Log10)), (3) MIPS function and complexes categories which are significantly enriched, (4) P-value for functional enrichment, determined from the hypergeometric distribution (Log10(p); not corrected for multiple testing).
Expression Coherence
We used three independent sets of publicly available expression data (Cho et al. 1998; T. Hughes et al. 2000; Causton et al. 2001) to test whether the genes harboring any of our predicted binding sites were significantly correlated with each other. Because many genes are regulated by multiple TFs (Lee et al. 2002), the genes which are defined by having any one of the TF binding sites are unlikely to be strongly coexpressed. However, these genes are coexpressed enough to exhibit statistically significant correlation under the relevant conditions. Although the sets of mRNA expression data are severely limited in their physiological breadth, they nevertheless span important cellular processes (Cho et al. 1998), stressful stimuli (Causton et al. 2001), and randomly sampled genetic perturbations (T. Hughes et al. 2000). We used the average correlation between all of the members of a set of motif-containing genes to assess their transcriptional coexpression. Statistical significance was assessed by the distribution of randomly permuted data. Nonparametric analysis of the distributions gave consistent results. Out of a set of 1269 top predicted motifs, we found 365 to give statistically significant correlations in at least one of the three mRNA expression data sets. We expect that this represents a lower limit on the number of motifs with expression coherence, because the expression data cover a limited range of physiology. Interestingly, the 300-gene knockout dataset (T. Hughes et al. 2000) produced the largest number of significant motifs, perhaps reflecting a broader coverage of the network due to the largely random nature of the perturbations.
Characteristic Features of Conserved Motifs
Conservation of Binding Affinity
There is evidence from bacterial and eukaryotic systems that binding affinity is an important feature of TF binding sites, with different affinities providing context-dependent differences in function. We asked whether in addition to the presence of a high-scoring binding site in an orthologous pair, there was evidence that their weight-matrix scores (a proxy for binding affinity; Stormo and Fields 1998) was also significantly similar, as compared with the intra-genomic motif-score dispersion. In fact, we found a highly significant correlation between network-level conservation of a motif and the extent to which the motif score was similar between its occurrences upstream of the orthologs. We used scaled RMS-deviation of motif scores between orthologous pairs as an overall measure of motif-sequence deviation between the pairs (see Methods). To get significant statistics, our analysis was limited to sets of orthologous pairs with six or more members each. Figure 3A compares the distribution of this deviation measure for the entire set of initial ∼80,000 motif predictions against a subset of the most highly conserved motifs (network-level conservation P-value < 10-10). As can be seen, the most conserved motifs have much lower score-dispersion. As expected, this is also true for the set of known TF binding sites (median score dispersion of 0.1). Although limited to a single phylogenetic neighbor, these observations support the hypothesis that motif elements not only preserve their specific distribution of occurrences upstream of genes, but may also be under strong selection to preserve their specific binding affinities.
Figure 3.
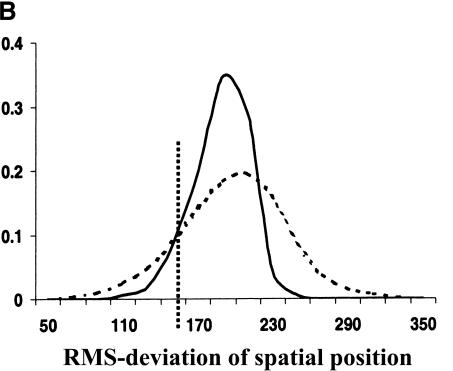
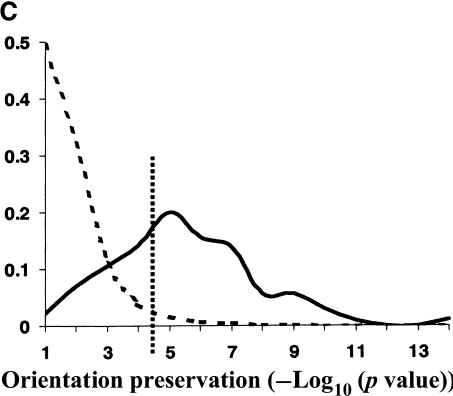
Evolutionary conservation of motif attributes. (A) Distribution of normalized RMS-deviation of motif scores for all 80,000 secondary motifs (dashed line) compared to the top motif predictions (network-level conservation P-value < 10-10; solid line). (B) Distribution of RMS-deviation in spatial position upstream of translational start for all the motifs (dashed line) compared to the most highly conserved (P < 10-10; solid line). (C) Distribution of P-values (binomial) for conservation of motif orientation for all of the 80,000 secondary motif predictions (dashed line), compared to the most highly conserved (P < 10-10; solid line). Vertical dashed line is the median value for strong matches to the 48 known TF binding sites.
Conservation of Position and Orientation
Two other characteristics of a TF binding site are its relative position and orientation with respect to the gene. There is accumulating evidence that these characteristics play a key role in the specific programming of regulatory logic within noncoding regions. We used RMS-deviation of motif position (relative to translational start) between the two pairs of orthologs as a measure of spatial dispersion. As can be seen in Figure 3B, there is statistically significant reduction in spatial dispersion among the most highly conserved motifs. Also, as expected, the set of known TF binding sites have significantly lower spatial dispersion than background—as shown by their median value in Figure 3B. However, contrary to our expectations, highly conserved motifs (among them many known binding sites) still suffered large spatial deviations (∼150–200 bp) in their positions. It is important to note that the spatial dispersions may be overestimated here, because we include any orthologous S. bayanus gene with 200 bp or more 5′ upstream sequences. Complete genomic sequence data for multiple close relatives of S. cerevisiae should tighten our estimates and establish the evolutionary dynamics of these spatial dispersions. For example, do they arise from many small insertion/deletion events, or a few large ones? We also observed a strong tendency for the conservation of motif orientation relative to a gene's direction of transcription. The significance of conserved motif orientations was assessed against a null model, expressed as a binomial distribution, in which the two possible orientations were equally probable. Figure 3C shows the distribution of P-values for conservation of orientation. As can be seen, the orientation of the most highly conserved motifs are much better preserved (more significant P-values) than the entire set of primary predictions. Also, as shown by the median P-value of the set of known TF binding sites, their orientations are very highly conserved over background.
More Divergent Yeast Species
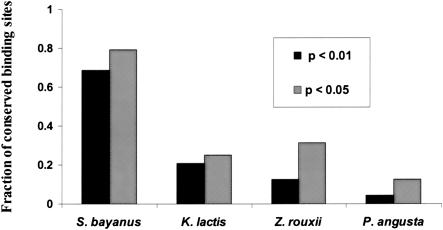
We were interested in how well more distant yeast species would perform in our phylogenetic footprinting scheme. Again, we used partial sequence data, of comparable coverage, from Zygosaccharomyces rouxii, Kluyveromyces lactis, and Pichia angusta (Souciet et al. 2000). By applying our algorithm to these species, we found significantly fewer conserved motif predictions, with many fewer known binding sites among them. As can be seen in Figure 4, the conservation of known binding sites across these species is roughly related to their phylogenetic distance from S. cerevisiae, with S. bayanus performing far better than the rest. Two binding sites (for RPN4 and RRPE) showed strong conservation across all four species (separated by ∼150 Myrs). RPN4 is a DNA-binding protein recently identified as a transcriptional regulator of the proteasome complex (Jelinsky et al. 2000; Xie and Varshavsky 2001). RRPE is one of the motifs—which together with PAC—is thought to regulate the expression of genes involved in rRNA synthesis and processing (Tavazoie et al. 1999; J. Hughes et al. 2000; Sudarsanam et al. 2002). PAC, along with RAP1, GCN4, HSF1, SWI4, and CIN5 belongs to the next most highly conserved group of binding sites, being present in the three closest S. cerevisiae species, S. bayanus, K. lactis, and Z. rouxii. Interestingly, multiple motifs which were not conserved in S. bayanus showed strong conservation in one of the more distant species. The binding sites for LYS14 and GAL4 showed strong conservation in K. lactis only. More surprisingly, the binding site for PHO4, a major global transcription factor in S. cerevisiae, was only preserved in the most distantly related yeast, P. angusta. Although partial sequence data and the resulting sparse coverage of the genome are a major impediment to detecting all phylogenetically conserved binding sites, ecological niche specialization and concomitant loss of selection on the regulatory system is an appealing interpretation of these findings, at least in the case of some of the binding sites.
Figure 4.
Conservation of 48 known S. cerevisiae binding sites across four yeast species. Fraction of conserved binding sites at network-level conservation; P-values of <0.05 and <0.01 (not corrected for multiple testing).
Global Organization of Transcription Networks
Although incomplete, the large set of binding site predictions allowed us the opportunity to explore global statistical features of transcriptional networks in the hope that they provide insights into the general principles of their organization. An important feature of these networks is their connectivity distribution, simply determined as the number of incoming connections per gene. For this analysis, we chose 700 of our predictions with significant functional or expression pattern coherence. As discussed previously, this set contains many redundant forms of the same actual binding site, such that connectivities are overestimated by a factor of ∼3. Although the number of genes regulated by any particular TF can vary from tens to hundreds, in the absence of experimental data, we chose to set this number equal (ranging from 50 to 300 in each case) across all of our binding site predictions. Our findings did not depend on the exact value of this parameter.
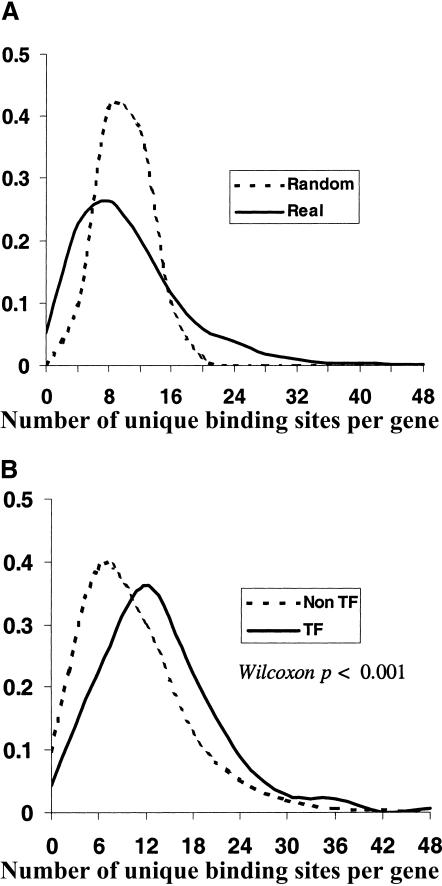
We found that the connectivity distribution was significantly different from that predicted for randomly connected networks. As can be seen in Figure 5A, there was an unexpectedly large number of genes with high connectivity, reflecting vast potential for combinatorial regulation. We were interested in whether the distribution of connectivities was significantly different among genes of different functional classes. In particular, we wondered whether the subnetwork of TF–TF gene interactions had statistically higher connectivity. In fact, as can be seen in Figure 5B, the distribution of connectivities for the TF–TF subnetwork is noticeably shifted to the right. Interestingly, the regulatory (upstream) regions of these genes have expanded in size— perhaps in order to accommodate more TF binding sites. In the case of these TF genes, this higher connectivity arises from a combination of larger regulatory regions, and higher density of binding sites. These observations are consistent with recent in vivo results from chromatin immunoprecipitation of yeast transcription factors (Lee et al. 2002). Our findings suggest an extensive and highly connected network of TFs at the top of the regulatory hierarchy. Such organization may be a general feature of cellular networks for integrating signals, computing processes, and orchestrating cellular behavior.
Figure 5.
Connectivity distribution. (A) Distribution of the number of binding sites per upstream region for the 700 known and putative TF binding sites (solid line), and the same distribution for a randomly permuted connectivity matrix (dashed line). (B) The distribution for non-TF genes (dashed line), and for TF genes (solid line).
DISCUSSION
In this report we describe the application of a novel wholegenome phylogenetic footprinting algorithm for mapping and characterizing conserved transcriptional regulatory elements in yeast. The top 1269 motif predictions show significant conservation between S. cerevisiae and S. bayanus, and the majority of these motifs show strong evidence of biological significance (with respect to both gene functional classes and mRNA expression coherence). It is also evident that selection has maintained more than just their genomic distributions, but has also statistically preserved their positions, motif scores (proxy for binding affinity), and orientations. These preliminary findings, with the partial sequence data of S. bayanus, suggest that mechanistic constraints, such as those involved in combinatorial interactions, may be deduced directly from comparative genomic analysis of regulatory regions.
We have shown that a network-level conservation criterion can significantly enhance our ability to identify real TF binding sites. The recent whole-genome phylogenetic footprinting approaches require global alignments of multiple, nearly complete sequenced genomes from closely related species (Cliften et al. 2003; Kellis et al. 2003). Here, we have introduced a general scheme for phylogenetic mapping of TF binding sites, making no assumptions about the conservation of binding sites within global alignments. We achieve results (in terms of finding known and novel putative TF binding sites) quite similar to those described in the two recent reports (Cliften et al. 2003; Kellis et al. 2003). However, instead of multiple, nearly complete genomes, we use only a fraction of the sequence of another species. The success of our approach relies on the increasingly accepted view that most TFs regulate the expression of many (∼30–200) genes in the genome. The homologous function of the whole regulatory system demands that the genes regulated by a TF in one organism should also be regulated by the same TF in the closely related and physiologically similar phylogenetic neighbor. This is the essence of our network-level conservation constraint. Although this condition is not satisfied in every case, for example where the TF only regulates a small number of genes, the majority of known TFs in S. cerevisiae show this characteristic when phylogenetically mapped against S. bayanus.
Many factors could influence our ability to map binding sites. The algorithm for finding the candidate motifs likely influences our success. For example, the Gibbssampling algorithm may not be as sensitive to detection of some motifs. We expect that sequence coverage is a strong determinant of success, especially for TFs that regulate a small number of genes in the genome. However, given that only 12% of the sequence of S. bayanus yields an estimated 70% of binding sites, we expect near-complete coverage of a single genome to achieve close to comprehensive identification of all TF binding sites. Metabolic and physiologic similarity is also a major factor. Although S. cerevisiae and S. bayanus are very similar organisms, nevertheless, our failure to detect some of the ∼30% of known binding sites may reflect physiological divergence and niche specialization, followed by concomitant inactivation of the TF, and the erosion of its binding sites. This process may explain why the binding sites for LYS14 and GAL4 were not detected as conserved in S. bayanus, but were found in the more distant S. lactis and S. rouxii. The lack of conservation of PHO4 binding site in S. bayanus was especially surprising, especially in light of the central importance of this factor for the regulation of phosphate balance (Oshima 1997). An alternative model for explaining incomplete conservation of known sites is that the binding sites for some of these TFs have diverged too far to be detected as conserved by our approach. Many of these questions, including the choice of alternative models of regulatory network evolution, will benefit significantly from complete genomes of multiple closely related species (Cliften et al. 2003; Kellis et al. 2003). It is important to note that our approach here has focused on identification of genome-wide conserved binding sites. Given the large and accumulating amount of yeast sequence data, future work will undoubtedly focus on specific evolutionary models by which regulatory regions evolve.
The relative expansion of noncoding regions in higher eukaryotes makes phylogenetic footprinting much more difficult than in bacteria or yeast. This characteristic, compounded with relative sparsity of related genomes for each organism, makes alternative approaches for whole-genome phylogenetic footprinting a high priority. We have shown that network-level conservation (conservation of intragenomic occurrences of binding sites) is a powerful constraint for pulling out real binding sites from a large set of predictions. This approach will be especially relevant to higher eukaryotes, where whole-genome approaches may identify an overwhelmingly large number of predictions which need to be efficiently prioritized for experimental validation.
All of the motifs, and corresponding evidence regarding their biological significance, are included in the Supplemental material available at www.genome.org, and can also be downloaded from our Web site: (www.molbio.princeton.edu/labs/tavazoie/Supplementary%20Data.htm).
METHODS
Sequence Assembly and Mapping of Orthologous Genes
For each yeast, the sequence data (EMBL accession numbers AL392203 to AL441602; Souciet et al. 2000) were assembled into contigs using Phrap (www.phrap.org) under default parameters. To map orthologous gene pairs, all of the S. cerevisiae proteincoding sequences were compared against the assembled contigs of each species using BLASTX (Altschul et al. 1990). Reciprocal best matches, with E-values below 10-10, were considered orthologous ORFs. In our case, because one of the genomes is only partially sequenced, orthology mapping may identify paralogs instead. Although this may affect the overall sensitivity of our approach, it does not invalidate the general statistical framework. Orthologous upstream sequences 200 bp or longer were used for subsequent analysis. The four species with comparable sequence coverage, S. bayanus (4.7 Mb total sequence), Z. rouxii (4.5 Mb), K. lactis (5.6 Mb), and P. angusta (4.7 Mb) provided 715, 412, 625, and 369 orthologous pairs, respectively.
Motif Searching and Comparison
We used the Gibbs-sampling algorithm (Lawrence et al. 1993; Neuwald et al. 1995), implemented in the AlignACE software package (Roth et al. 1998; Tavazoie et al. 1999; J. Hughes et al. 2000) to search for motif patterns within unaligned input sequences. In the first round of motif discovery, upstream sequences longer than 200 bp (from pairs of orthologous genes of the two species) were used to search for an expected number of 10 motifs of 10-bp width. In the case of S. bayanus, this constituted 715 AlignACE searches producing a total of 12,047 motif predictions. To generate a larger set of upstream regions containing a motif, this set was hierarchically clustered by motif similarity using the CompareACE algorithm (J. Hughes et al. 2000). The CompareACE algorithm uses a similarity score based on the Pearson correlation coefficient of nucleotide frequencies between the two motifs. Only the six most informative positions of each motif are used, and the final score is the maximum value of correlation coefficients over all possible alignments. Here, we used a similarity cutoff of 0.75 to define clusters which ranged in size from 2–58 members each. All of the original input upstream regions from each cluster were then used for the next round of motif searching, resulting in 1919 AlignACE runs. Because there are many more instances of each motif in this second iteration of Gibbs-sampling, more informative motif definitions are generated. The roughly 80,000 motifs so generated are then pruned in the next step by the requirement for network-level conservation.
Network-Level Conservation Criterion
Due to likely errors in orthology mapping, and allowing for some evolutionary divergence in binding sites, our requirement for network-level conservation was not absolute. We asked for a statistically significant overlap between the sets of orthologous genes containing a high-scoring match to a particular weight-matrix (motif prediction). For each of the two species, the top 30 and 60 genome-wide upstream motif occurrences were found using the standard weight-matrix scoring scheme implemented in ScanACE (J. Hughes et al. 2000). Two different depths were used because our estimate for the number of actual binding sites in the genome ranged from 200–400 for each TF. Given that due to partial sequence data, S. bayanus had only 12% of its upstream regions available to us, we felt 30 and 60 covered a reasonable range of actual binding sites within the 715 orthologous sets of genes. To look for significant intra-genomic conservation of binding sites, we used the hypergeometric distribution (Tavazoie et al. 1999) to assess the significance of overlap between the set of genes which harbor the top scoring motifs in the two species (network-level conservation P-value). We determined the background distribution of these P-values for 10,000 randomized (random permutation of columns) predicted weight matrices.
Validation
Known Transcription Factor Binding Sites
We assembled a set of weight matrices corresponding to 45 well characterized S. cerevisiae TFs. These matrices were constructed from a mix of experimentally determined binding sites, augmented with extensive expression and chromatin IP-derived data (Lee et al. 2002). To this list, we added three weight matrices (PAC, RRPE, A/T_repeat) which had strong computational evidence for being real TF binding sites. We estimate this set to represent binding sites for 15%–25% of all TFs in S. cerevisiae. The entire set can be downloaded from our Web site (www.molbio.princeton.edu/labs/tavazoie).
Functional Coherence
The MIPS functional category and molecular complexes groups (Mewes et al. 2002) were used to test whether a set of genes containing a motif within their upstream regions were statistically enriched for genes of similar function, or contained significant members of a molecular complex. Each of the 1269 putative binding site motifs was used to find its top 200 upstream occurrences throughout the genome. For each motif, its corresponding genes were then tested for overlap with any of the 476 functional and molecular complex groups. Statistically significant overlap was assessed by the hypergeometric distribution (Tavazoie et al. 1999). The reported P-values are not corrected for multiple testing.
Expression Coherence
To look for evidence of transcriptional coexpression, we looked for significant positive shifts (as measured by the mean) in the distribution of correlation coefficients of a set of motifcontaining genes. We used oligonucleotide array (Cho et al. 1998; Causton et al. 2001), and cDNA microarray expression data (T. Hughes et al. 2000) from previously published work. All of the 1269 top motif predictions were tested for significant expression coherence (P-values of 10-2 and 10-3; not corrected for multiple hypotheses) across all three data sets. Significance was assessed by repeating the procedure on 1000 randomly permuted data sets. Nonparametric analysis of shifts in the distribution was also performed and was found to give similar results.
Statistical Characterization of Motif Attributes
We calculated root mean square deviation (RMSD) of a motif's score (as quantified by the ScanACE weight matrix score) between its top occurrences in an orthologous pair, across all of the orthologous pairs in which the motif co-occurred. To account for motif-to-motif differences in the range of motif scores, this RMS-deviation was normalized by the square root of the product of the mean motif scores in the two species:
 |
Here, N is the total number of orthologous pairs in which a motif is found to co-occur. Si1 and Si2 are the specific motif scores of the top two matches in a pair of orthologous upstream regions, and bars over variables denote their average.
A similar analysis was performed to quantify inter-ortholog dispersion in the position of a motif across all of the pairs of upstream regions in which the motif co-occurred.
 |
Again, N is the total number of orthologous pairs in which the motif is found to co-occur.
Xi1 and Xi2 are the positions of the motifs relative to the start of translation in a pair of orthologous upstream regions.
To quantify the extent of orientation-conservation between a motif's inter-ortholog co-occurrences, we simply calculated the binomial probability of obtaining the observed conservation by chance, assuming equal odds (P = 0.5).
Acknowledgments
We thank the members of the Tavazoie laboratory for helpful discussion and review of this work, and three anonymous referees for their many helpful comments. M.P. is supported by the Burroughs Wellcome Fund fellowship in Biological Dynamics. M.B. is a Lewis Thomas Fellow of Princeton University. S.T. is supported in part by grants from NSF CAREER, DARPA, and DOE.
The publication costs of this article were defrayed in part by payment of page charges. This article must therefore be hereby marked “advertisement” in accordance with 18 USC section 1734 solely to indicate this fact.
Article and publication are at http://www.genome.org/cgi/doi/10.1101/gr.1739204. Article published online before print in December 2003.
Footnotes
[Supplemental material is available online at www.genome.org.]
References
- Altschul, S., Gish, W., Miller, W., Myers, E.W., and Lipman, D.J. 1990. Basic local alignment search tool. Proc. Natl. Acad. Sci. 87: 5509-5513. [DOI] [PubMed] [Google Scholar]
- Aparicio, S., Morrison, A., Gould, A., Gilthorpe, J., Chaudhuri, C., Rigby, P., Krumlauf R., and Brenner, S. 1995. Detecting conserved regulatory elements with the model genome of the Japanese puffer fish, Fugu rubripes. Proc. Natl. Acad. Sci. 92: 1684-1688. [DOI] [PMC free article] [PubMed] [Google Scholar]
- Blanchette, M. and Tompa, M. 2002. Discovery of regulatory elements by a computational method for phylogenetic footprinting. Genome Res. 12: 739-748. [DOI] [PMC free article] [PubMed] [Google Scholar]
- Bussemaker, H., Li, H., and Siggia, E.D. 2001. Regulatory element detection using correlation with expression. Nat. Genet. 27: 167-171. [DOI] [PubMed] [Google Scholar]
- Causton, H.C., Ren, B., Koh, S.S., Harbison, C.T., Kanin, E., Jennings, E.G., Lee, T.I., True, H.L., Lander, E.S., and Young, R.A. 2001. Remodeling of yeast genome expression in response to environmental changes. Mol. Biol. Cell 12: 323-337. [DOI] [PMC free article] [PubMed] [Google Scholar]
- Cho, R.J., Campbell, M.J., Winzeler, E.A., Steinmetz, L., Conway, A., Wodicka, L., Wolfsberg, T.G., Gabrielian, A.E., Landsman, D., Lockhart, D.J., et al. 1998. A genome wide transcriptional analysis of the mitotic cell cycle. Mol. Cell 2: 65-73. [DOI] [PubMed] [Google Scholar]
- Cliften, P., Hillier, L.W., Fulton, L., Graves, T., Miner, T., Gish, W.R., Waterston, R.H., and Johnston, M. 2001. Surveying Saccharomyces genomes to identify functional elements by comparative DNA sequence analysis. Genome Res. 11: 1175-1186. [DOI] [PubMed] [Google Scholar]
- Cliften, P., Sudarsanam, P., Desikan, A., Fulton, L., Fulton, B., Majors, J., Waterston, R., Cohen B.A., and Johnston M. 2003. Finding functional features in Saccharomyces genomes by phylogenetic footprinting. Science 301: 71-76. [DOI] [PubMed] [Google Scholar]
- Eisen, M.B., Spellman, P.T., Brown, P.O., and Botstein, D. 1998. Cluster analysis and display of genome-wide expression patterns. Proc. Natl. Acad. Sci. 95: 14863-14868. [DOI] [PMC free article] [PubMed] [Google Scholar]
- Gilligan, P., Brenner, S., and Venkatesh, B. 2002. Fugu and human sequence comparison identifies novel human genes and conserved non-coding sequences. Gene 294: 35-44. [DOI] [PubMed] [Google Scholar]
- Gumucio, D.L., Heilstedt-Williamson, H., Gray, T.A., Tarle, S.A., Shelton, D.A., Tagle, D.A., Slightom, J.L., Goodman, M., and Collins, F.S. 1992. Phylogenetic footprinting reveals a nuclear protein which binds to silencer sequences in the human γ and ε globin genes. Mol. Cell Biol. 12: 4919-4929. [DOI] [PMC free article] [PubMed] [Google Scholar]
- Hill, D.P., Blake, J.A., Richardson, J.E., and Ringwald, M. 2002. Extension and integration of the gene ontology (GO): Combining GO vocabularies with external vocabularies. Genome Res. 12: 1982-1991. [DOI] [PMC free article] [PubMed] [Google Scholar]
- Hughes, J.D., Estep, P.W., Tavazoie, S., and Church, G.M. 2000. Computational identification of cis-regulatory elements associated with groups of functionally related genes in Saccharomyces cerevisiae. J. Mol. Biol. 296: 1205-1214. [DOI] [PubMed] [Google Scholar]
- Hughes, T.R., Marton, M.J., Jones, A.R., Roberts, C.J., Stoughton, R., Armour, C.D., Bennett, H.A., Coffey, E., Dai, H., He, Y.D., et al. 2000. Functional discovery via a compendium of expression profiles. Cell 102: 109-126. [DOI] [PubMed] [Google Scholar]
- Jelinsky, S.A., Estep, P., Church, G.M., and Samson, L.D. 2000. Regulatory networks revealed by transcriptional profiling of damaged Saccharomyces cerevisiae cells: RPN4 links base excision repair with proteasome. Moll. Cell. Biol. 20: 8157-8167. [DOI] [PMC free article] [PubMed] [Google Scholar]
- Kellis, M., Patterson, N., Endrizzi, M., Birren, B., and Lander, E.S. 2003. Sequencing and comparison of yeast species to identify genes and regulatory elements. Nature 423: 241-254. [DOI] [PubMed] [Google Scholar]
- Lawrence, C.E., Altschul, S.F., Boguski, M.S., Liu, J.S., Neuwald, A.F., and Wootton, J.C. 1993. Detecting subtle sequence signals: A Gibbs sampling strategy for multiple alignment. Science 262: 208-214. [DOI] [PubMed] [Google Scholar]
- Lee, T.I., Rinaldi, N.J., Roberts, F., Odom, D., Bar-Joseph, Z., and Gerber, G.K. 2002. Transcriptional regulatory networks in Saccharomyces cerevisiae. Science 298: 799-804. [DOI] [PubMed] [Google Scholar]
- Li, H., Rhodius, V., Gross, C., and Siggia, E.D. 2002. Identification of the binding sites of regulatory proteins in bacterial genomes. Proc. Natl. Acad. Sci. 99: 11772-11777. [DOI] [PMC free article] [PubMed] [Google Scholar]
- McCue, L., Thompson, W., Carmack, C., Ryan, M.P., Liu, J.S., Derbyshire, V., and Lawrence, C.E. 2001. Phylogenetic footprinting of transcription factor binding sites in proteobacterial genomes. Nucleic Acids Res. 29: 774-782. [DOI] [PMC free article] [PubMed] [Google Scholar]
- McGuire, A.M., Hughes, J.D., and Church, G.M. 2000. Conservation of DNA regulatory motifs and discovery of new motifs in microbial genomes. Genome Res. 10: 744-757. [DOI] [PubMed] [Google Scholar]
- Mewes, H.W., Frishman, D., Guldener, U., Mannhaupt, G., Mayer, K., Mokrejs, M., Morgenstern, B., Munsterkotter, M., Rudd, S., and Weil, B. 2002. MIPS: A database for genomes and protein sequences. Nucleic Acids Res. 30: 31-34. [DOI] [PMC free article] [PubMed] [Google Scholar]
- Neuwald, A.F., Liu, J.S., and Lawrence, C.E. 1995. Gibbs motif sampling: Detection of bacterial outer membrane protein repeats. Protein Sci. 4: 1618-1632. [DOI] [PMC free article] [PubMed] [Google Scholar]
- Oshima, Y. 1997. The phosphatase system in Saccharomyces cerevisiae. Genes Genet. Syst. 72: 323-334. [DOI] [PubMed] [Google Scholar]
- Rajewsky, N., Socci, N.D., Zapotocky, M., and Siggia, E.D. 2002. The evolution of DNA regulatory regions for proteo-γ bacteria by interspecies comparisons. Genome Res. 12: 298-308. [DOI] [PMC free article] [PubMed] [Google Scholar]
- Roth, F.P., Hughes, J.D., Estep, P.W., and Church, G.M. 1998. Finding DNA-regulatory motifs within unaligned noncoding sequences clustered by whole-genome mRNA quantitation. Nat. Biotechnol. 16: 949-945. [DOI] [PubMed] [Google Scholar]
- Schneider, T.D. and Stephens, R.M. 1990. Sequence logos: A new way to display consensus sequences. Nucleic Acids Res. 18: 6097-6100. [DOI] [PMC free article] [PubMed] [Google Scholar]
- Souciet, J., Aigle, M., Artiguenave, F., Blandin, G., Bolotin-Fukuhara, M., Bon, E., Brottier, P., Casaregola, S., de Montigny, J., Dujon, B., et al. 2000. Genomic exploration of the hemiascomycetous yeasts: 1. A set of yeast species for molecular evolution studies. FEBS Lett. 487: 3-12. [DOI] [PubMed] [Google Scholar]
- Spellman, P.T., Sherlock, G., Zhang, M.Q., Iyer, V.R., Anders, K., Eisen, M.B., Brown, P.O., Botstein, D., and Futcher, B. 1998. Comprehensive indentification of cell cycle-regulated genes of the yeast Saccharomyces cerevisiae by microarray hybridization. Mol. Biol. Cell 9: 3273-3297. [DOI] [PMC free article] [PubMed] [Google Scholar]
- Stormo, G. and Fields, D. 1998. Specificity, free energy and information content in protein-DNA interactions. Trends Biochem. Sci. 23: 109-113. [DOI] [PubMed] [Google Scholar]
- Sudarsanam, P., Pilpel, Y., and Church, G.M. 2002. Genome-wide co-occurrence of promoter elements reveals a cis-regulatory cassette of rRNA transcription motifs in Saccharomyces cerevisiae. Genome Res. 12: 1723-1731. [DOI] [PMC free article] [PubMed] [Google Scholar]
- Tagle D.A., Koop B.F., Goodman M., Slightom J.L., Hess D.L., and Jones R.T. 1988. Embryonic ε and γ globin genes of a prosimian primate (Galago crassicaudatus). Nucleotide and amino acid sequences, developmental regulation and phylogenetic footprints. J. Mol. Biol. 203: 439-455. [DOI] [PubMed] [Google Scholar]
- Tavazoie, S., Hughes, J.D., Campbell, M.J., Cho, R.J., and Church, G.M. 1999. Systematic determination of genetic network architecture. Nat. Genet. 22: 281-285. [DOI] [PubMed] [Google Scholar]
- Thompson, J., Higgins D.G., and Gibson, T.J. 1994. CLUSTAL W: Improving the sensitivity of progressive multiple sequence alignment through sequence weighting, position-specific gap penalties and weight matrix choice. Nucleic Acids Res. 22: 4673-4680. [DOI] [PMC free article] [PubMed] [Google Scholar]
- Xie, Y. and Varshavsky, A. 2001. RPN4 is a ligand, substrate, and transcriptional regulator of the 26S proteasome: A negative feedback circuit. Proc. Natl. Acad. Sci. 98: 3056-3061. [DOI] [PMC free article] [PubMed] [Google Scholar]


