

Abstract
Gap junction coupling synchronizes activity among neurons in adult neural circuits, but its role in coordinating activity during development is less known. The developing retina exhibits retinal waves—spontaneous depolarizations that propagate among retinal interneurons and drive retinal ganglion cells (RGCs) to fire correlated bursts of action potentials. During development, two connexin isoforms, connexin36 (Cx36) and Cx45, are expressed in bipolar cells and RGCs, and therefore provide a potential substrate for coordinating network activity. To determine whether gap junctions contribute to retinal waves, we compared spontaneous activity patterns using calcium imaging, whole-cell recording, and multielectrode array recording in control, single-knock-out (ko) mice lacking Cx45 and double-knock-out (dko) mice lacking both isoforms. Wave frequency, propagation speed, and bias in propagation direction were similar in control, Cx36ko, Cx45ko, and Cx36/45dko retinas. However, the spontaneous firing rate of individual retinal ganglion cells was elevated in Cx45ko retinas, similar to Cx36ko retinas (Hansen et al., 2005; Torborg and Feller, 2005), a phenotype that was more pronounced in Cx36/45dko retinas. As a result, spatial correlations, as assayed by nearest-neighbor correlation and functional connectivity maps, were significantly altered. In addition, Cx36/45dko mice had reduced eye-specific segregation of retinogeniculate afferents. Together, these findings suggest that although Cx36 and Cx45 do not play a role in gross spatial and temporal propagation properties of retinal waves, they strongly modulate the firing pattern of individual RGCs, ensuring strongly correlated firing between nearby RGCs and normal patterning of retinogeniculate projections.
Introduction
Gap junction coupling is found throughout the developing nervous system, where it has been postulated to play a number of roles (Cook and Becker, 2009) including regulation of spontaneous firing patterns (Roerig and Feller, 2000; Personius et al., 2007). Here, we explore the role of gap junction coupling in retinal waves, the spontaneous propagating activity generated in the retina before the maturation of vision. Pharmacological blockade of gap junctions produces different effects on waves depending on the species, age, and particular antagonist used (for review, see Blankenship and Feller, 2010), and therefore, the role of gap junction coupling in mediating retinal waves remains unresolved.
The role of gap junction coupling in the propagation of retinal waves during the second postnatal week is of particular interest. During this time, waves are mediated by glutamate release from bipolar cells (BCs) (Blankenship and Feller, 2010). However, bipolar cells have narrow axonal arborizations and are not known to form synapses with one another, so it remains a mystery how retinal waves propagate laterally among them. Gap junctions present a potential source of coupling among neighboring retinal neurons.
Since pharmacological blockers of gap junctions have several nonspecific effects, knock-out mice lacking specific connexins have proven to be a powerful tool for elucidating the role of gap junction coupling in circuit function (Connors and Long, 2004). Bipolar cells express connexin isoforms that could couple bipolar cells directly (Arai et al., 2010) or indirectly via interneurons (for review, see Söhl et al., 2005; Bloomfield and Völgyi, 2009). In the mouse retina, bipolar cells express two different connexin proteins, connexin45 (Cx45) and Cx36, which form homologous and heterologous gap junctions with interneurons (Güldenagel et al., 2000; Söhl et al., 2000; Feigenspan et al., 2001, 2004; Han and Massey, 2005; Lin et al., 2005; Maxeiner et al., 2005; Dedek et al., 2006; Pan et al., 2010). In addition, Cx36 and Cx45 are required for gap junction coupling in multiple but not all retinal ganglion cell (RGC) subtypes (Schubert et al., 2005a; Völgyi et al., 2005; Dedek et al., 2006; Bloomfield and Völgyi, 2009; Müller et al., 2010; Pan et al., 2010). Both Cx36 (Belluardo et al., 2000; Hansen et al., 2005; Torborg et al., 2005) and Cx45 (Kihara et al., 2006) are expressed during development and are therefore in a position to influence spontaneous firing patterns. Previously, it was found that in contrast to WT mice, in which RGCs fire correlated bursts of spikes separated by silence (Meister et al., 1991; Wong et al., 1993; McLaughlin et al., 2003), Cx36ko (Cx36 knock-out) mice (Deans and Paul, 2001; Deans et al., 2002) exhibit an increase in the number of tonically firing RGCs (Hansen et al., 2005; Torborg et al., 2005). The role of Cx45 in retinal waves is unknown.
Here, we used knock-out mice lacking Cx45 or both Cx36 and Cx45 to determine whether these connexins are required to coordinate the depolarization of RGCs during waves. Specifically, we used multielectrode array (MEA) recordings to characterize firing patterns of individual RGCs, calcium imaging to characterize propagation properties of waves, and whole-cell recording to compare the synaptic circuits that mediate spontaneous activity.
Materials and Methods
Animals.
All procedures were approved by the Institutional Animal Care and Use Committees at the University of California, Berkeley and the University of California, San Diego. Because germline deletion of Cx45 is embryonic lethal (Krüger et al., 2000; Kumai et al., 2000), we used a mouse line in which the endogenous Cx45 gene has been replaced by a loxP site-flanked Cx45 coding sequence followed downstream by an EGFP coding sequence (Cx45fl; Maxeiner et al., 2005). Cre-mediated recombination of this allele generates the Cx45del allele in which EGFP is expressed under control of regulatory elements of the Cx45 promoter. To prevent embryonic lethality, Cx45fl/fl mice were crossed with mice expressing Cre recombinase under control of the neuron-directed Nestin promoter (Nestin-cre mice) (Tronche et al., 1999), yielding Cx45fl/fl:Nestin-cre mice, which we will refer to as Cx45ko. [Note, this mouse was previously referred to as “Cx45del” (Maxeiner et al., 2005) to distinguish this targeted knock-out from the constitutive knock-out (Krüger et al., 2000).] Thus, Cx45ko mice lack Cx45 protein wherever the Nestin promoter has been active.
Cx36ko mice were a generous gift from David Paul (Harvard Medical School, Boston, MA). In these mice, the Cx36 coding sequence is replaced by a LacZ-IRES-PLAP reporter cassette (Deans et al., 2001), generating the “Cx36−” allele.
Mice lacking both Cx36 and Cx45 were generated by breeding Cx45fl/fl; Cx36−/− or Cx45fl/fl;Cx36+/− females with Cx45fl/fl;Cx36+/−:Nestin-cre males, to yield Cx45fl/fl;Cx36−/−:Nestin-cre mice (Cx36/45dko). There was an exceptionally low yield of double-knock-out (dko) mice with ∼20 dko pups generated in four years of breeding. Throughout the paper, Cx45fl/fl, Cx36+/−, Cx45fl/fl;Cx36+/−, and wild-type mice are referred to as “control” (Ctr); Cx36+/−;Cx45fl/fl:Nestin-cre mice are referred to as Cx45ko; and Cx45fl/fl;Cx36−/− mice are referred to as Cx36ko.
Retinal preparation.
Mice of either sex between postnatal day 1 (P1) and P13 were deeply anesthetized with isoflurane and decapitated. Eyes were removed, and retinas isolated in artificial CSF (ACSF) (containing, in mm: 119.0 NaCl, 26.2 NaHCO3, 11 glucose, 2.5 KCl, 1.0 K2HPO4, 2.5 CaCl2, 1.3 MgCl2). For calcium imaging and whole-cell recording, retinas were mounted RGC layer up on filter paper (Millipore).
Immunofluorescence.
Frozen sections of retinas were prepared as described previously (Hansen et al., 2005). Briefly, retinas were immersion fixed at 4°C in 4% paraformaldehyde overnight, cryoprotected in 30% sucrose at 4°C, frozen in OCT compound in a cryomold biopsy chamber (27181; Ted Pella, Inc), and cut into 16 μm sections with a cryostat. Next, sections were washed in 0.01 m PBS, blocked for nonspecific binding [blocking solution: 1% bovine serum albumin (BSA) in 0.01 m PBS] for 30 min at room temperature, and incubated overnight at room temperature with primary antibody (in 1% BSA, 0.3% Triton X-100, 0.03% sodium azide in 0.01 m PBS solution).
The primary antibodies used were goat anti-choline acetyltransferase (ChAT) (1:200, Millipore, AB144P) and rabbit anti-GFP (1:500, Invitrogen, A-11122). We detected β-gal as described previously (Hansen et al., 2005). Sections were incubated for 2 h at room temperature in secondary antibodies including Alexa Fluor 568-conjugated donkey anti-goat 1:200 (Invitrogen, A-11057) and Alexa Fluor 488-conjugated donkey anti-rabbit 1:500 (Invitrogen, A21206).
Images were acquired using a Zeiss microscope (Axioskop) using a CCD camera (Optronics). Two-color images were acquired using a confocal microscope (Zeiss 510 META NLO AxioImager Confocal). Digital images were processed in Adobe Photoshop (Adobe Systems) to enhance color and contrast.
Multielectrode recordings and analysis.
The retina was placed ganglion cell side down onto a 60-electrode array (Multichannel Systems). The electrodes are each 10 μm in diameter, arranged in an 8 × 8 grid (minus four corners) with 100 μm interelectrode spacing. The retina was held in place on the array with a weighted piece of dialysis membrane and superfused continuously with oxygenated ACSF (∼3 ml/min, pH 7.4, gassed with 95% O2 and 5% CO2) maintained at 32°C.
The voltage trace on each electrode was sampled at 20 kHz and stored for offline analysis. The traces were then bandpass filtered between 120 and 2000 Hz. Spikes that crossed a threshold of four times the root mean square of the noise were sorted according to the first two principal components of their voltage waveforms. A t-distribution-based Expectation-Maximization algorithm was then used to sort spike clusters into individual units. To verify that each unit identified by this algorithm corresponded to a single cell, units were inspected manually. Furthermore, those that lacked a refractory period in their autocorrelation function were considered contaminated by other neurons and excluded from the analysis.
The mean spike rate, r, was calculated by dividing the total number of spikes for each unit by the recording duration, and units whose mean spike rate was < of the mean firing rate of all cells were excluded from further analysis to reduce influence from low-spiking cells, which were generally the result of poor contact with the array. This constituted <10% of the units identified per retina. After this cut, 55–90 units were identified per retina.
Bursts were then identified for each neuron using a modified Poisson Surprise method. In this method, spike trains of a minimum of three spikes whose interspike interval (ISI) was less than half of the mean ISI of that unit were identified. The probability that such a spike train would occur given a Poisson spike distribution was then calculated from the following:
 |
where t is the duration of the spike train (time between the first and last spike under investigation), C is the number of spikes in the burst, and r is the unit's mean spike rate. The spike train was accepted as a burst when its probability of occurrence was Pc < 10−4. Upon identification of bursts, the interburst interval (time between end of one burst and start of the next), burst duration (t), firing rate (C/t), and the percentage of time firing (sum of t for all bursts/total length of recording) were computed and averaged for each unit. The start of a wave was identified when 8% or more of identified cells were bursting simultaneously, and the end of the wave was identified when 2.5% of cells were still bursting.
The correlation index was calculated for all cell pairs in each retina using a method described previously (Wong et al., 1993; Torborg and Feller, 2005). The correlation index (CI) is a measure of the likelihood relative to chance that a pair of neurons fire together within a given time window, Δt = 0.1 s. It is calculated from the following:
 |
where NAB is the number of spike pairs for which cell B fires within a time ±Δt from cell A, NA and NB are the total number of spikes fired by cells A and B, respectively, during the entire recording, T is total time of recording, and Δt is the correlation time window. The distance between cells was approximated to be the distance between the electrodes on which the cells' activity was recorded. The cell pairs were grouped according to their intercellular distance, and the median and quartile correlation indices were computed over all cell pairs in a given distance group, for each age and genotype. The median correlation index was then plotted as a function of increasing intercellular distance.
We determined functional connectivity maps between spontaneously firing units. Here, we used functional connectivity as a quantitative measure to characterize the spatial organization of pairs of RGCs that have a high correlation index. First, we computed the correlation index between all pairs of units (see Fig. 2D). We designated a pair “connected” if its correlation index was in the top 5% of all correlation indices in its retina. Any units that were not connected to at least one other unit were not further analyzed. Each correlation matrix was then binarized into an adjacency matrix (data not shown), in which each pair is identified as either connected or not connected. Using the adjacency matrix, we determined the connectivity value for each unit, i.e., how many connections each unit made divided by the total number of possible connections for that unit. The distribution of connectivity values obeyed a power-law, indicating that the most highly connected units (which are located in the tail of the distribution) are most informative (Clauset et al., 2009). We designated units that were connected to >15% of all of the units in the adjacency matrix as “highly connected” (see Fig. 2E, red units). We then mapped these units back onto the electrodes from which they were recorded and computed the distances between these highly connected units and the units to which they were connected (see Fig. 2E, blue lines).
Figure 2.

Tonic firing between waves is elevated in Cx45ko and Cx36/45dko mice. A, Raster plots of 10 single-unit spike trains over a 10 min interval, recorded from retinas isolated from P12 control, P11 Cx45ko, and P10 Cx36/45dko retinas. Purple shaded regions indicate waves. B, Pairwise correlation index as a function of intercellular distance for Ctr (black), Cx45ko (red), and Cx36/45dko (purple). Data points are averages of median values from individual retinas. Error bars are ±SD. Inset shows the same data normalized within each genotype to the maximum correlation index. C, Percentage of time cells fire above 1 Hz (left) and 10 Hz (right), based on 1 s time bins during inter-wave intervals. Percentages were obtained across all inter-wave intervals pooled within a genotype. Bars are mean ± SD. D, Correlation matrices for example retinas from each genotype. The correlation coefficient was computed as in B for every possible pair of cells in each retina. The x- and y-axes correspond to all single units isolated from that retina. Diagonals (i.e., autocorrelations) were set to zero. Because the distribution of correlation coefficients followed a power-law, they are plotted on a logarithmic scale. E, Connection matrices for example retinas shown in D. Circles correspond to locations of units identified by spike sorting, with the diameter of the circle scaled by the magnitude of the normalized correlation index, such that the largest circles correspond to the largest average correlation index found in the example retina. Units that were localized on the same electrode are slightly displaced. Red circles correspond to units that had connections (i.e., high correlation indices) with at least 15% of the other units (connections shown with blue lines). F, Cumulative distributions of the distances between the most highly connected RGCs and the units to which they are connected (see Materials and Methods).
Calcium imaging.
Retinas were loaded with Oregon Green 488 BAPTA-1 AM using the multicell bolus loading technique (Stosiek et al., 2003; Blankenship et al., 2009). Images were captured with cooled CCD cameras: either a Hamamatsu OrcaER or a QImaging QiCam. Imaging was performed using a 10× objective lens, yielding imaging fields with dimensions of 800 × 640 μm (OrcaER) or 644.5 × 481.5 μm (QiCam). Movies were recorded either in MetaMorph (Molecular Devices) or in μManager (Edelstein et al., 2010). Inter-wave interval and propagation speed were measured using MATLAB routines (MathWorks), as described previously (Blankenship et al., 2009). In some retinas, the signal-to-noise ratio was too low for automated analysis of waves. We verified by eye that waves were correctly identified for all retinas used to calculate inter-wave interval and wave propagation speed.
Wave direction was determined by measuring the nearest points of the binarized wavefronts across subsequent frames, which generates a vector in each image frame (Blankenship et al., 2009; Elstrott and Feller, 2010). A “bias index” was computed for each retina. The bias index is the vector sum of the individual wavefront vectors normalized by the total magnitude of the summed vectors. Hence, a vector sum of 0 would be the equivalent to waves propagating in all directions equally, while a value of 1 would be equivalent to all waves traveling in the same direction.
Whole-cell physiology.
Retinas were visualized on an upright microscope (Zeiss Axioskop 2 FS Plus or Olympus BX51WI) and were continually superfused with ACSF (32–34°C). RGCs were exposed by using a glass pipette to remove the inner limiting membrane over a small region of the retina. Recording pipettes (3–6 MΩ) were filled with internal solution containing either cesium gluconate (containing, in mm: 75 gluconic acid, 149.9 CsOH, 10 EGTA, 20 HEPES, 1 QX-314, 2 ATP-Mg, 0.3 GTP-Na, pH adjusted to 7.25 with CsOH) or potassium gluconate (containing, in mm: 128 K-gluconate, 10 HEPES, 12 KCl, 5 EGTA, 1 MgCl2, 0.5 CaCl2, 2 Na2ATP, and 0.5 Na-GTP, pH adjusted to 7.25 with KOH or, alternatively, 98.3 K-gluconate, 40 HEPES, 1.7 KCl, 0.6 EGTA, 5 MgCl2, 2 Na2ATP, and 0.3 Na-GTP, pH adjusted to 7.25 with KOH). 6,7-Dinitroquinoxaline-2,3-dione disodium salt (DNQX), d-(−)-2-amino-5-phosphonopentanoic acid (AP5), and dihydro-β-erythroidine (DHβE) were acquired from Tocris Bioscience; all other chemicals were acquired from Sigma or Fisher.
Wave-associated event frequency was determined by current-clamp and voltage-clamp recordings as previously described (Blankenship et al., 2009).
Intraocular injections and image analysis of retinogeniculate projections.
Animals were anesthetized with 3.5% isoflurane/2% O2. The eyelid was then opened with fine forceps to expose the eye, and 0.1–1 μl of Alexa 488- or Alexa 594-conjugated β-cholera toxin was injected using a fine glass micropipette with a Picospritzer (World Precision Instruments) generating 20 psi, 3-ms-long positive pressure. The cholera toxin was then allowed to transport for 24 h, which was sufficient time for clear labeling of axons and terminals. Brains were removed, immersion fixed in 4% paraformaldehyde (24 h), cryoprotected in 30% sucrose (18 h), and sectioned coronally (100 μm) on a freezing microtome.
Images were analyzed as described previously (Torborg and Feller, 2004). Briefly, eight-bit tagged image file format images were acquired for Alexa Fluor 488- or 594-labeled sections of the lateral geniculate nucleus (LGN) with a CCD camera (Optronics) attached to an upright microscope (Zeiss Axioscope 2) with a 10× objective (numerical aperture, 0.45). The three sections that contained the largest ipsilateral projection, corresponding to the central third of the LGN, were selected, and all analysis was performed on these sections using the side of the brain that was ipsilateral to the Alexa Fluor 594 injection, since the Cx45ko mice had a low level of background fluorescence because of GFP in the blood vessels in the dorsal LGN (dLGN). For each pixel, we computed the logarithm of the intensity ratio, r = log10(FI/FC), where FI is the ispilateral channel fluorescence intensity and FC is the contralateral channel fluorescence intensity. We then calculated the variance of the distribution of R values for each section, which was used to compare the width of the distributions across animals. A higher variance is indicative of a wider distribution of R values, which is in turn indicative of more contra- and ipsi-dominant pixels, and therefore more segregation.
Results
Developmental expression of Cx45 in the retina
In adult retinas, Cx45 is expressed in BCs, where it forms a part of the gap junction between AII amacrine cells and cone BCs (Han and Massey, 2005; Lin et al., 2005; Maxeiner et al., 2005; Dedek et al., 2006). It is also expressed in amacrine cells (Maxeiner et al., 2005; Dedek et al., 2006) and RGCs (Schubert et al., 2005b; for review, see Bloomfield and Völgyi, 2009). Cx45 antibodies produce strong labeling of mouse retinas from P1 to adulthood, and Cx45 mRNA levels are high at P1 and slowly decrease until adulthood (Kihara et al., 2006), similar to connexins that are transiently expressed in developing spinal cord (Chang et al., 1999). Identification of the cell types expressing Cx45 using antibody staining is difficult because Cx45 protein is punctate throughout the inner and outer plexiform layers. In addition, tracer coupling indicates the presence of gap junctions in the inner retina early in development (Penn et al., 1994; Singer et al., 2001).
We used mice in which the Cx45 coding sequence was replaced by GFP, a cytoplasmic reporter that labels cell somas as well as processes (Maxeiner et al., 2005), to determine the postnatal expression pattern of Cx45. At P4, GFP was predominantly detected in somas in the inner nuclear layer bordering the inner plexiform layer, indicating expression in amacrine cells at early ages, although a few RGCs were also detected (Fig. 1). By P10, adult-like expression is observed in bipolar cells, amacrine cells, and a few ganglion cells. Double immunolabeling in P11 Cx36/Cx45dko mice for anti-β-gal, to identify cells that express Cx36, and anti-GFP, to identify cells that express Cx45, confirmed that both connexins are expressed in the inner retina during glutamatergic waves (Fig. 1B). These results indicate that Cx45 is expressed in the developing retina and may influence patterns of spontaneous activity.
Figure 1.
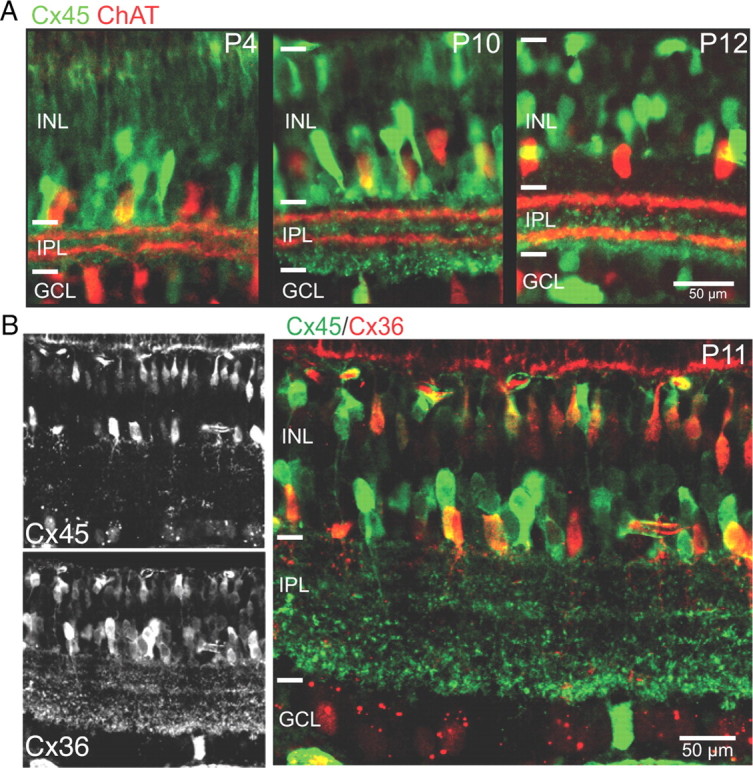
Cx45 is strongly expressed throughout postnatal development. A, GFP (green) expressed under the Cx45 promoter at P4, P10, and P12. ChAT (red) is shown for reference. B, P11 Cx36/45dko retinas double labeled with antibodies to β-gal (red) and GFP (green) show partial colocalization of Cx45 and Cx36 in bipolar cells and distinct labeling of amacrine and retinal ganglion cells. INL, Inner nuclear layer; IPL, inner plexiform layer; GCL, retinal ganglion cell layer. Scale bar, 50 μm.
Cx45ko and Cx36/45dko mice have altered spontaneous firing patterns
To characterize the firing patterns of connexin knock-out retinas, we used a multielectrode array to record extracellularly from many RGCs simultaneously. In control mice, RGCs fire bursts of action potentials during waves that are correlated with action potentials from neighboring cells and are followed by long periods of silence (see Fig. 2A, top) (Meister et al., 1991; Wong et al., 1993). In contrast, Cx45ko RGCs exhibit an increase in asynchronous firing in between the correlated bursts associated with waves (Fig. 2A, middle), a pattern reminiscent of that observed in Cx36ko mice (Hansen et al., 2005; Torborg et al., 2005). This increase in asynchronous firing was even more dramatic in the Cx36/45dko (Fig. 2A, bottom).
We quantified the temporal properties of spontaneous firing patterns by monitoring the percentage of time individual RGCs spend firing above 1 Hz and 10 Hz (Fig. 2C). In control mice, RGCs fire primarily in correlated high-frequency bursts during waves with very few asynchronous action potentials in between waves. In contrast, Cx45ko RGCs had a significant increase in the percentage of time firing above 1 Hz between waves (Kruskal–Wallis test, p < 0.001; Ctr, 1.2 ± 0.3%, n = 214 wave intervals/4 mice; Cx45ko 4.1 ± 0.2%, n = 324/4; Cx36/45dko, 25.4 ± 1%, n = 567/6; differences found between all groups, Tukey–Kramer post hoc tests), consistent with our findings of increased asynchronous firing in Cx36ko mice (Hansen et al., 2005; Torborg and Feller, 2005). Cx36/45dko RGCs also had a significant increase in percentage of time firing above 10 Hz and, in contrast to either Cx36ko (Torborg et al., 2005) or Cx45ko (Fig. 2C), there was also a significant increase in the amount of time spent bursting above 10 Hz between waves (Kruskal–Wallis test, p < 0.001; Ctr, 0.39 ± 0.05%, n = 214 wave intervals/4 mice; Cx45ko, 0.55 ± 0.07%, n = 324/4; Cx36/45dko, 3.87 ± 0.3%, n = 567/6; difference found only between Cx36/45dko and other groups, Tukey–Kramer post hoc test).
To quantify the effects of increased asynchronous action potential firing on the spatial correlations of waves, we computed the correlation index as a function of distance between cells (Fig. 2B). Nearest-neighbor correlations are higher for nearby cells than for distant cells, an indicator of propagating waves, although asynchronous action potentials reduce the sensitivity of this measure in Cx36ko mice by reducing the correlation index at all distances (Torborg et al., 2005). For Cx45ko and Cx36/45dko mice, in general, the magnitude of the correlation index was lower at all distances than in control retinas. However, similar to control and Cx36Ko mice, the correlation index was highest for nearby neurons, and then decreased as a function of distance for all genotypes, consistent with the persistence of propagating waves (Fig. 2B, inset). However, for Cx36/45dko mice, the correlation index dropped off more slowly. If we restricted the analysis only to action potentials fired during waves, the values of the correlation indices increased overall, but the fall-off with distance remained more gradual for Cx36/45dko (data not shown).
The finding that Cx36/45dko mice are more correlated over longer distances suggests that the absence of these connexins has altered the underlying network that determines the firing pattern of RGCs. To further explore the spatial properties of correlated neurons, we computed “functional connectivity” maps for the pairs of neurons with the highest correlation indices (Bonifazi et al., 2009; Bullmore and Sporns, 2009; Feldt et al., 2011). Functional connectivity maps are a means to quantitatively describe complex network organization, and they have recently been applied to developing neural circuits (Bonifazi et al., 2009).
To establish functional connectivity maps, we first computed correlation matrices to determine the strength of correlations across all RGCs in a given recording (Fig. 2D). After selecting the most strongly correlated units, we then determined which were most highly connected, i.e., the RGCs that are correlated with the firing of the most other RGCs (Fig. 2E, red units; see Materials and Methods). For both control and Cx45ko retinas, RGCs had the highest connectivity to nearby RGCs, whereas in Cx36/45dko retinas, RGCs had the highest connectivity with RGCs that were more dispersed (Fig. 2E blue lines, F). Again, if we restricted the analysis only to action potentials that fired during waves, we found an increase in correlation index but no change to the distribution of distances between highly connected cell pairs. Hence, as indicated both by the correlation index (Fig. 2B) as a function of distance, and by the functional connectivity maps (Fig. 2F), gap junctions serve to ensure that RGCs are most strongly correlated with nearby RGCs.
Propagation properties of retinal waves are normal in Cx36ko, Cx45ko, and Cx36/45dko mice
The high level of asynchronous firing detected in MEA recordings from connexin knock-outs blurs the distinction between bursts of activity correlated with and independent of waves. Thus, to determine whether Cx45- or Cx36-containing gap junctions in the inner retina play a role in shaping glutamatergic retinal waves, we performed calcium imaging. Calcium transients in RGCs during waves are driven by depolarization and therefore can be used to monitor depolarization in many cells simultaneously. In addition, calcium imaging functions as a spatial and temporal filter on spiking patterns, making it easier to detect correlated increases in firing rate. This method has been used extensively to monitor the spatial and temporal properties of retinal waves (Wong et al., 1995; Sernagor et al., 2000; Syed et al., 2004; Blankenship et al., 2009).
Whole-mount retinas from Cx36ko, Cx45ko, and Cx36/45dko mice were bolus-loaded with Oregon Green 488 BAPTA-1 AM, and fluorescence was monitored over time across large areas of the ganglion cell layer. P10–P13 retinas displayed waves in all genotypes (Cx36ko, n = 17 retina pieces/6 mice; Cx45ko, n = 20/7; Cx36/45dko, n = 22 of 23 retina pieces/8 mice; Fig. 3). Although waves were visible in all but one retina, the magnitude of the change in fluorescence during waves was very small in some Cx36/45dko retinas (n = 12 retinas from 5 mice), precluding analysis of propagation properties on these retinas. We postulate that the source of this low signal-to-noise ratio in calcium imaging was the high baseline firing between waves (Fig. 2).
Figure 3.

Spatiotemporal properties of retinal waves are similar in control, Cx36ko, Cx45ko, and Cx36/45dko. A, Examples of waves recorded in different genotypes. Each grayscale value represents an active area in one frame, with darker shades corresponding to later points in time during the wave. The red line represents the path of the wave and the circles represent the points along the wave where the vectors were measured to determine the direction of wave propagation. B, Time course of ΔF/F in gap junction knock-out retinas before and during application of the ionotropic glutamate receptor antagonists DNQX (10 μm) and AP5 (50 μm). C, Polar plots showing the propagation bias from the example retinas shown in A (red arrow) as determined by summation of individual vectors representing movement of local wavefront (gray arrows). Individual vectors are the velocities measured between red dots in the example waves shown in A and in all other waves from these four retinas. D, Summary of wavefront propagation speed. Open circles, Mean speeds for individual retinas; closed circles, mean of all retinas; error bars are SD. The shaded circles are the example retinas in A. E, Cumulative probability histogram of inter-wave intervals (IWIs) from all P10–P13 retinas. Shaded areas are ±SEM. F, Summary of propagation bias index recorded in all retinas from all genotypes. Open circles are the normalized magnitudes of the propagation direction bias for individual retinas; closed circles are means ± SD from all retinas in a genotype; shaded circles are the example retinas shown in A and C.
Waves were blocked in most P10–P13 retinas by ionotropic glutamate receptor antagonists (Fig. 3B; 10 μm DNQX and 50 μm AP5; 9 of 10 Cx36ko retinas, 8 of 10 Cx45ko retinas, 7 of 12 Cx36/45dko retinas), and not blocked by nicotinic acetylcholine receptor antagonists (8 μm DHβE; n = 3 Cx36ko retinas, n = 5 Cx36/45dko retinas). A combination of DHβE, DNQX, and AP5 (after either DNQX/AP5 alone or DHβE alone) blocked waves in all cases (n = 3 retinas in Cx36ko; n = 1 in Cx45ko; n = 7 in Cx36/45dko; Fig. 3B).
We also compared the propagation speed and initiation frequency of waves (Blankenship et al., 2009) across genotypes. There was no difference in propagation speed among genotypes (Fig. 3D; one-way ANOVA, p = 0.17; Control, n = 9 retinas/5 mice; Cx36ko, n = 17/6; Cx45ko, n = 15/6; Cx36/45dko, n = 10/6). The distribution of wave initiations was shifted slightly to the left (shorter inter-wave intervals) in Cx36/45dko retinas compared with Cx36ko, Cx45ko, and control retinas (Fig. 3E; Table 1). These findings suggest that Cx36- and Cx45-containing gap junctions modulate wave initiation, but are not required for glutamatergic wave propagation.
Table 1.
Summary of the spatiotemporal properties of retinal waves as assayed with calcium imaging
| Genotype | Wave stage | Age | nretinas | nmice | Inter-wave interval (s) | Speed (μm/s) |
|---|---|---|---|---|---|---|
| Control | 2 | P4–P6 | 11 | 4 | 96.8 ± 54.6 | 160.4 ± 15.5 |
| 3 | P10–P13 | 9 | 5 | 94.7 ± 54.9 | 135.9 ± 29.3 | |
| Cx36ko | 2 | — | — | — | — | — |
| 3 | P10–P13 | 17 | 6 | 69.9 ± 49.8 | 132.9 ± 33.8 | |
| Cx45ko | 2 | P4–P6 | 15 | 6 | 147.4 ± 35.9 | 167.8 ± 22.4 |
| 3 | P10–P13 | 15 | 6 | 54.1 ± 50.6 | 154.0 ± 39.8 | |
| Cx36/45dko | 2 | P6 | 7 | 2 | 61.4 ± 41.1 | 181.4 ± 27.6 |
| 3 | P10–P13 | 10 | 6 | 34.7 ± 22.8 | 141.4 ± 21.5 |
Mean inter-wave intervals (IWIs) were computed as the average of median IWIs per retina; Speed values are means of means per retina. Both are ±SD. Stage 2 waves are referred to as cholinergic waves throughout the text; Stage 3 waves are referred to as glutamatergic waves (Syed et al., 2004; Bansal et al., 2000). We did not perform experiments on stage 2 Cx36ko retinas (–).
Retinal waves exhibit a propagation bias in that there are more waves propagating in the temporal-to-nasal direction (Stafford et al., 2009; Elstrott and Feller, 2010). The mechanisms underlying this bias are not understood. To test whether Cx36 or Cx45 contributes to this propagation bias, we compared the propagation bias in waves recorded with calcium imaging in control, Cx45ko, and Cx36/45dko mice. Using binarized images of retinal waves (Fig. 3A), the direction of propagation of the wave front was determined for each imaging frame (example retinas shown in Fig. 3C). These individual vectors were summed, and a single vector was computed to represent the bias for each retina (Fig. 3C, red arrows). The magnitude of the bias in wave propagation was variable from retina to retina (Fig. 3F), but there was no difference in distribution across genotypes (Kruskal–Wallis test, p = 0.35; control, n = 9 retinas/5 mice; Cx36ko, n = 17/6; Cx45ko, n = 15/6; Cx36/45dko, n = 10/6). Hence, the correlations that are mediated by gap junctions do not influence the bias in propagation direction.
Glutamate release during retinal waves is normal in Cx45ko mice
To confirm that the waves detected in Cx45ko and Cx36/45dko mice are mediated by a circuit containing bipolar cells, we performed whole-cell voltage-clamp recordings from RGCs. Compound EPSCs (cEPSCs) recorded from RGCs are reliable markers of network activation during retinal waves (Blankenship et al., 2009). During the second postnatal week, Cx45 is expressed in bipolar cells as well as amacrine cells, which modulate glutamate release from BCs (Fig. 1). RGCs in all genotypes received wave-associated compound EPSCs (Fig. 4; P10–P13; frequency of cEPSC clusters per minute given as median, lower quartile/upper quartile: Ctr, 0.49, 0.20/0.62, n = 16 cells/6 mice; Cx45ko, 0.31, 0.05/0.98, n = 35/13; Cx36/45dko, 0.75, 0.63/0.95, n = 9/3). There was no difference in cEPSC cluster frequency among genotypes (Kruskal–Wallis test, p = 0.14). Using simultaneous dual whole-cell voltage-clamp recordings from neighboring RGCs, we also found that Cx45ko RGCs receive correlated compound IPSCs (cIPSCs) during waves (Cx45ko, n = 3 pairs; Cx36/45dko, n = 2 pairs; Fig. 4A). Note that a small number of cells did not receive cEPSCs (Cx45ko, n = 8 of 35 cells in 4 of 13 mice; control n = 3 of 16 cells in three of six mice).
Figure 4.

Normal wave-associated synaptic inputs in Cx45ko and Cx36/45dko. A, Simultaneous whole-cell voltage-clamp recordings from two neighboring RGCs in a P10 Cx45ko mouse showing cIPSCs (top) and cEPSCs (bottom). Left, Control ACSF; right, 20 μm DNQX + 50 μm AP5. B, Same as A, from a P10 Cx36/45dko mouse. Calibration in A applies to A and B. C, Average cEPSC cluster frequency. Open circles are individual cells, closed circles are medians of all cells per genotype, and bars are quartiles. D, Raster plot of 10 single-unit spike trains from a P11 Cx36/45dko retina before and after application of 20 μm DNQX + 50 μm AP5. Recordings in each condition are 5 min long. E, Average firing rate of individual RGCs in MEA recordings in the absence and presence of 20 μm DNQX + 50 μm AP5. Open circles are single units, closed circles are means of all units; error bars are obscured by the data points.
To confirm that the cEPSCs are glutamatergic, we applied glutamate receptor antagonists while performing whole-cell recordings. cEPSCs were blocked in control retinas (n = 3 cells in two mice) and in Cx36/45dko retinas (n = 6 cells in two mice), and were blocked in 10 of 12 cells in Cx45ko retinas (frequency reduced from 1.15 ± 0.47 to 0.01 ± 0.04 cEPSC clusters/min, n = 12 cells in four mice). Hence, excitatory input to RGCs in Cx45ko and Cx36/45dko mice was mediated by glutamate release from bipolar cells as in WT mice.
To determine whether the increase in action potential firing (Fig. 1A) is influenced by activation of ionotropic glutamate receptors, we repeated MEA recordings in the absence and presence of ionotropic glutamate receptor antagonists. We observed a significant reduction in the average firing rate in Cx36/45dko retinas in the presence of antagonists (Fig. 4D,E; Wilcoxon rank-sum test p < 0.001; n = 37 units from two retinas from two P11 mice). These results indicate that glutamate receptor activation is at least partially responsible for the increase in action potential firing observed in Cx36/45dko RGCs.
Cholinergic retinal waves are normal in Cx36/45dko mice
Cx45 is also expressed in amacrine cells during the first postnatal week (Fig. 1) and therefore could potentially influence cholinergic retinal waves, which are inhibited by gap junction blockers (Catsicas et al., 1998; Singer et al., 2001). [Note, other studies have found varying effects of gap junction blockers on cholinergic waves (Syed et al., 2004; Stacy et al., 2005).] Cx36ko mice exhibit normal cholinergic waves (Hansen et al., 2005). To determine whether Cx45 alone or Cx36 and Cx45 together are required for cholinergic wave propagation, we performed calcium imaging. We observed waves that were blocked by the nicotinic acetylcholine receptor antagonist DHβE (8 μm) in all retina pieces (Fig. 5A; control n = 8 retinas/4 mice, Cx45ko n = 15/6, Cx36/45dko n = 6/3). The distribution of inter-wave intervals in Cx45ko retinas was shifted slightly to the right compared with control and Cx36/45dko retinas (Fig. 5B; Table 1). Propagation speed was not different among genotypes (ANOVA, p = 0.15; Fig. 5C; Table 1).
Figure 5.

Cholinergic waves persist in connexin knock-out mice. A, Time course of ΔF/F in gap junction knock-out retinas before and during application of the nicotinic acetylcholine receptor antagonist DHβE (8 μm). B, Cumulative probability histogram of inter-wave intervals (IWIs) from all P4–P6 retinas. C, Graph of wavefront propagation speed. Open circles, Mean speeds for individual retinas; closed circles, mean of all retinas; error bars are SD.
We also performed whole-cell voltage-clamp recordings from control and Cx45ko RGCs during cholinergic waves (data not shown). There was no difference in cEPSC frequency between genotypes (P1–P8; frequency in Cx45ko, 0.63 ± 0.25 cEPSC clusters/min, n = 11 cells in 6 mice; control, 0.5 ± 0.2 cEPSC clusters/min, n = 12 cells in 6 mice; t test, p = 0.19). Similar to our observations in older retinas, we recorded from some cells that did not receive cEPSCs during cholinergic waves (Cx45ko, n = 1 of 11 cells; control n = 1 of 12 cells). These results indicate that gap junctions are not required for cholinergic waves.
Eye-specific segregation of retinogeniculate afferents was reduced in Cx36/45dko mice
Spontaneous retinal activity is required for retinal projections from the two eyes to segregate into eye-specific regions in the lateral geniculate nucleus of the thalamus. Whether the pattern of action potential firing generated by retinal waves is instructive for this process remains controversial (Huberman et al., 2008; Chalupa, 2009; Feller, 2009). We have found that although the gross spatial and temporal properties of retinal waves are normal in Cx36/45dko mice (Fig. 3), during the second postnatal week the nearest-neighbor correlations among RGCs were reduced (Fig. 2), and there was a significant increase in asynchronous firing, with a pronounced increase in high-frequency firing (Fig. 2C).
To test directly whether altered patterns of activity drive eye-specific segregation, we compared retinogeniculate projections across control, Cx45ko, and Cx36/45dko mice (Torborg and Feller, 2004). We calculated segregation indices for all three genotypes and compared differences using a one-way ANOVA followed by a Tukey–Kramer test to compare means between individual genotypes (n = 5 control mice; n = 8 Cx45ko; n = 5 Cx36/45dko; ANOVA, p < 0.01; significance level set at p < 0.05 for multiple-comparisons test). Similar to Cx36ko mice (Torborg et al., 2005), Cx45ko mice had segregation similar to that of control mice. However, Cx36/45dko mice had significantly less segregation than either control or Cx45 mice (Fig. 6). These findings suggest that the increase in asynchronous bursting or the change in the spatial distribution of correlations during waves generated in Cx36/45dko retinas during the second postnatal week perturbs normal eye-specific segregation of retinogeniculate afferents.
Figure 6.

Cx36/45dko mice have reduced eye-specific segregation of retinogeniculate projections. A, Fluorescence images of dLGN sections in control (top) and Cx36/45dko (bottom) mice. Left, Fluorescence of Alexa 488-labeled, contralateral-projecting retinogeniculate axons; middle, fluorescence of Alexa 594-labeled, ipsilateral-projecting retinogeniculate axons; right, pseudocolor images based on the logarithm of the intensity ratio (r = log(FI/FC)) for each pixel. Scale bar, 200 μm. B, Summary of the variance of the distribution of the R values for all the pixels in the images in each brain. The broader the distribution of R values is for a given dLGN, the greater the extent of segregation. Closed circles are mean ± SEM; open circles are individual brains; shaded circles are the examples shown in A. SEM for Cx36/45dko is obscured by the data point. *p < 0.05; **p < 0.01.
Discussion
We have examined the role of gap junctions in shaping spontaneous firing patterns in the developing mouse retina. Cx45 expression increases during postnatal development, achieving adult-like expression patterns by eye-opening. Cx45ko and Cx36/45dko exhibit retinal waves with initiation rates and propagation speeds similar to those of controls. In addition, connexin knock-out RGCs received glutamate receptor-mediated cEPSCs during retinal waves, indicating that gap junctions do not dramatically shape RGC inputs in the developing retina. However, Cx45ko mice do differ from WT mice in the number of asynchronous action potentials that occur between waves, a result that is significantly enhanced in the Cx36/45dko mouse. Cx36/45dko mice also exhibited more spatially dispersed correlations between RGCs and reduced eye-specific segregation of retinogeniculate afferents. These results show that Cx45 and Cx36 are not required for global retinal wave propagation but shape the local firing patterns and correlation structure of individual RGCs that participate in those waves.
Comparison with results of pharmacological manipulations of gap junctions
In this study, we used knock-out mice to determine a role for specific connexin isoforms in modulating spontaneous firing patterns in the developing retina. In the absence of both Cx45 and Cx36, there was an increase in the frequency of retinal waves and asynchronous action potentials between waves, while wave propagation remained unaffected.
These effects are distinct from those described by application of gap junction blockers. Carbenoxolone blocked waves measured by calcium imaging in chick (Wong et al., 1998). However, carbenoxolone had no effect on cholinergic or glutamatergic waves as measured by multielectrode array recordings in mice (Stacy et al., 2005; Kerschensteiner and Wong, 2008), whereas it slightly reduced cholinergic wave frequency (Stacy et al., 2005). In rabbit, carbenoxolone had no effect on waves measured by calcium imaging (Syed et al., 2004). Similarly, mixed results have been seen with related compounds 18-α- and 18-β-glycyrrhetinic acid in rabbit (Syed et al., 2004), mouse (Singer et al., 2001), and chick (Wong et al., 1998). Octanol blocked cholinergic waves measured by calcium imaging in rabbit (Syed et al., 2004) and dramatically reduced wave frequency in embryonic day 9–10 chick (Catsicas et al., 1998). Finally, meclofenamic acid (Harks et al., 2001; Connors and Long, 2004; Pan et al., 2007) increased glutamatergic wave frequency in mice as measured with multielectrode array recordings (Kerschensteiner and Wong, 2008).
One interpretation of the finding that gap junction antagonists suppress activity while knock-out mice have enhanced activity is that gap junction blockers have nonspecific effects, as described in several studies (Wu et al., 2001; Connors and Long, 2004; Cruikshank et al., 2004; Vessey et al., 2004; Takeda et al., 2005; Sheu et al., 2008; Tovar et al., 2009; Veruki and Hartveit, 2009). A second interpretation is that there is a role for non-Cx36- or Cx45-containing gap junctions in wave generation (Dermietzel et al., 2000; Willecke et al., 2002; Massey et al., 2003). Our data argue against a role for coupling of bipolar cells in wave generation since, thus far, Cx36 and Cx45 are the only connexins identified in bipolar cells. However, other neuronal connexins are expressed in other cell types of the retina during development (Güldenagel et al., 2000; Söhl et al., 2000; Kihara et al., 2008). For example, Cx50 and Cx57 are expressed exclusively in horizontal cells (Deans and Paul, 2001; Hombach et al., 2004; Huang et al., 2005; O'Brien et al., 2006), an interneuron in the outer retina that has not yet been implicated in retinal waves (Firth et al., 2005). There is some evidence that BCs are coupled via gap junctions (Cuenca et al., 1993; Jacoby and Marshak, 2000; Arai et al., 2010), although the connexins mediating this coupling are not yet defined. Another intriguing possibility is release of an excitatory agent from hemichannels composed of pannexins (Scemes et al., 2007), which are transiently expressed in the retina during development (Ray et al., 2005; Dvoriantchikova et al., 2006).
A third possible explanation for our finding that Cx36/45dko retinas exhibit normal retinal waves is that constitutive deletion of Cx36 and Cx45 caused compensatory expression of other circuit components. Recent studies have showed that knockdown or knock-out of some connexins leads to increased expression of mRNA for other connexins (Iacobas et al., 2003, 2007; Spray and Iacobas, 2007). However, available data suggest that compensatory expression of other gap junctions does not take place in Cx36ko or Cx45ko retinal neurons. Deletion of Cx36 causes most classes of ganglion cells to lose gap junction coupling (Pan et al., 2010), arguing that compensation does not take place in RGCs after deletion of Cx36. Similarly, deficits in gap junction coupling have been observed in retinas lacking Cx45 protein in specific cell classes (Maxeiner et al., 2005; Dedek et al., 2009). Because these studies were performed in single-knock-out mice, we cannot rule out the possibility that expression of other gap junction proteins is increased when both Cx36 and Cx45 are absent. Furthermore, gap junction protein knock-out has also been shown to cause upregulation of a number of ion channels (Iacobas et al., 2003, 2007), which could provide an alternative means for waves to propagate in the absence of Cx36 and Cx45. However, waves in Cx36/45dko mice were nearly indistinguishable from waves in control retinas (Figs. 3–5), indicating that if compensation has occurred, it enabled a circuit to mediate waves that is remarkably similar to the endogenous circuit.
Role of connexins in shaping spontaneous firing patterns
Our results indicate that the two known neuronal connexins expressed in bipolar cells are not required for wave generation. However, these connexins do act to suppress action potential firing between waves. Our finding that ionotropic glutamate receptor antagonists dramatically decrease the average firing rate of RGCs in Cx36/45dko mice (Fig. 4D,E) demonstrates that glutamate receptor activation is largely responsible for action potential firing in Cx36/45dko RGCs. This increase in asynchronous firing could be due to several changes in the circuit induced by the absence of Cx45 and Cx36. First, there could be an increase in excitability in bipolar cell terminals. In mammals, ON bipolar cells form strong gap junctions with AII amacrine cells, and the bipolar cell-to-AII amacrine cell gap junction is perturbed in Cx45ko retinas (Maxeiner et al., 2005). A lack of coupling in bipolar cell terminals could cause an increase in input resistance, making the terminals more excitable (Deans et al., 2001; Long et al., 2002). In this scenario, spontaneous depolarization in bipolar cells may lead to glutamate release between waves, causing the action potential firing in RGCs. Alternatively, an absence of neuronal connexins in RGCs may increase the input resistance of RGCs, causing them to be more excitable. The absence of gap junctions throughout development in constitutive knock-out mice could also cause long-term changes in cell excitability due to differential expression of a variety of ion channels (Iacobas et al., 2003, 2007).
Implications for the role of patterned activity in eye-specific segregation of retinogeniculate afferents
Several genetic and pharmacological manipulations in mice and ferrets have been used to determine the role of retinal waves in segregation of retinogeniculate afferents into eye-specific regions (for review, see Guido, 2008; Huberman et al., 2008). Some manipulations altered segregation, while others did not, which has led to the hypothesis that only some features of retinal waves are critical for driving segregation (for review, see Torborg and Feller, 2005). Here, we found that segregation was normal in Cx45ko mice, but reduced in Cx36/45dko mice (Fig. 6B). Cx45ko and Cx36/45dko had similar wave propagation speed and inter-wave intervals. However, there were three significant differences between the firing patterns of these two mice: (1) an elevation in asynchronous firing in the Cx36/45dko relative to the Cx45ko (Fig. 2C), which was most pronounced in the percentage of time firing above 10 Hz; (2) a reduction in the nearest-neighbor correlations; and (3) a more dispersed map of functionally connected RGCs. These differences were found when taking into account either only spikes fired during retinal waves or all spikes. From these observations we hypothesize that increased asynchronous bursting and/or reduced correlations of nearby cells disrupted the segregation process despite normal gross patterns of activity.
Both Cx36 and Cx45 (Belluardo et al., 2000; Maxeiner et al., 2003; Söhl et al., 2005; Torborg et al., 2005; Lee et al., 2010; Zlomuzica et al., 2010) are expressed in the dLGN and may contribute to the process of activity-dependent refinement of retinogeniculate axons. Both Cx36 (Torborg et al., 2005) and Cx45 (Fig. 6) knock-out mice have normal eye-specific segregation, suggesting that the absence of either connexin does not inhibit the segregation process. However, whether the absence of both connexins in the dLGN is detrimental to eye-specific segregation is not known.
In summary, we have demonstrated that the two isoforms of connexins expressed in retinal neurons play an unexpected role in regulating spontaneous firing patterns in the developing retina. Connexin 36 and 45 do not alter the spatial and temporal properties of spontaneous activity as determined by the coarse sampling afforded by calcium imaging. Instead, these connexins alter the correlations as assayed on the finer time scales of action potential firing. These data suggest that gap junction-mediated interactions modulate the highly correlated firing of nearby RGCs necessary for normal eye-specific segregation of retinogeniculate afferents.
Notes
Supplemental material for this article is available at http://mcb.berkeley.edu/labs/feller/Movies/Blankenship_etal_JNeurosci_2011.htm. This material has not been peer reviewed.
Footnotes
Support was contributed by NIH Grant RO1EY013528 (M.B.F.), NSF Grant IOS-0818983 (M.B.F.), and NIH Grant F31NS058167 (A.G.B.). Work in the Bonn laboratory was supported by a grant from the German Research Foundation Wi 270/22-3/4 to K.W. We thank Kevin Ford for help with calcium imaging analysis and Dr. Lars Holzhausen and the University of California, Berkeley Molecular Imaging Center for technical assistance.
References
- Arai I, Tanaka M, Tachibana M. Active roles of electrically coupled bipolar cell network in the adult retina. J Neurosci. 2010;30:9260–9270. doi: 10.1523/JNEUROSCI.1590-10.2010. [DOI] [PMC free article] [PubMed] [Google Scholar]
- Belluardo N, Mudò G, Trovato-Salinaro A, Le Gurun S, Charollais A, Serre-Beinier V, Amato G, Haefliger JA, Meda P, Condorelli DF. Expression of connexin36 in the adult and developing rat brain. Brain Res. 2000;865:121–138. doi: 10.1016/s0006-8993(00)02300-3. [DOI] [PubMed] [Google Scholar]
- Blankenship AG, Feller MB. Mechanisms underlying spontaneous patterned activity in developing neural circuits. Nat Rev Neurosci. 2010;11:18–29. doi: 10.1038/nrn2759. [DOI] [PMC free article] [PubMed] [Google Scholar]
- Blankenship AG, Ford KJ, Johnson J, Seal RP, Edwards RH, Copenhagen DR, Feller MB. Synaptic and extrasynaptic factors governing glutamatergic retinal waves. Neuron. 2009;62:230–241. doi: 10.1016/j.neuron.2009.03.015. [DOI] [PMC free article] [PubMed] [Google Scholar]
- Bloomfield SA, Völgyi B. The diverse functional roles and regulation of neuronal gap junctions in the retina. Nat Rev Neurosci. 2009;10:495–506. doi: 10.1038/nrn2636. [DOI] [PMC free article] [PubMed] [Google Scholar]
- Bonifazi P, Goldin M, Picardo MA, Jorquera I, Cattani A, Bianconi G, Represa A, Ben-Ari Y, Cossart R. GABAergic hub neurons orchestrate synchrony in developing hippocampal networks. Science. 2009;326:1419–1424. doi: 10.1126/science.1175509. [DOI] [PubMed] [Google Scholar]
- Bullmore E, Sporns O. Complex brain networks: graph theoretical analysis of structural and functional systems. Nat Rev Neurosci. 2009;10:186–198. doi: 10.1038/nrn2575. [DOI] [PubMed] [Google Scholar]
- Catsicas M, Bonness V, Becker D, Mobbs P. Spontaneous Ca2+ transients and their transmission in the developing chick retina. Curr Biol. 1998;8:283–286. doi: 10.1016/s0960-9822(98)70110-1. [DOI] [PubMed] [Google Scholar]
- Chalupa LM. Retinal waves are unlikely to instruct the formation of eye-specific retinogeniculate projections. Neural Dev. 2009;4:25. doi: 10.1186/1749-8104-4-25. [DOI] [PMC free article] [PubMed] [Google Scholar]
- Chang Q, Gonzalez M, Pinter MJ, Balice-Gordon RJ. Gap junctional coupling and patterns of connexin expression among neonatal rat lumbar spinal motor neurons. J Neurosci. 1999;19:10813–10828. doi: 10.1523/JNEUROSCI.19-24-10813.1999. [DOI] [PMC free article] [PubMed] [Google Scholar]
- Clauset A, Shalizi CR, Newman MEJ. Power-law distributions in empirical data. SIAM Rev. 2009;51:661–703. [Google Scholar]
- Connors BW, Long MA. Electrical synapses in the mammalian brain. Annu Rev Neurosci. 2004;27:393–418. doi: 10.1146/annurev.neuro.26.041002.131128. [DOI] [PubMed] [Google Scholar]
- Cook JE, Becker DL. Gap-junction proteins in retinal development: new roles for the “nexus.”. Physiology (Bethesda) 2009;24:219–230. doi: 10.1152/physiol.00007.2009. [DOI] [PubMed] [Google Scholar]
- Cruikshank SJ, Hopperstad M, Younger M, Connors BW, Spray DC, Srinivas M. Potent block of Cx36 and Cx50 gap junction channels by mefloquine. Proc Natl Acad Sci U S A. 2004;101:12364–12369. doi: 10.1073/pnas.0402044101. [DOI] [PMC free article] [PubMed] [Google Scholar]
- Cuenca N, Fernández E, García M, De Juan J. Dendrites of rod dominant ON-bipolar cells are coupled by gap junctions in carp retina. Neurosci Lett. 1993;162:34–38. doi: 10.1016/0304-3940(93)90553-w. [DOI] [PubMed] [Google Scholar]
- Deans MR, Paul DL. Mouse horizontal cells do not express connexin26 or connexin36. Cell Commun Adhes. 2001;8:361–366. doi: 10.3109/15419060109080754. [DOI] [PMC free article] [PubMed] [Google Scholar]
- Deans MR, Gibson JR, Sellitto C, Connors BW, Paul DL. Synchronous activity of inhibitory networks in neocortex requires electrical synapses containing connexin36. Neuron. 2001;31:477–485. doi: 10.1016/s0896-6273(01)00373-7. [DOI] [PubMed] [Google Scholar]
- Deans MR, Volgyi B, Goodenough DA, Bloomfield SA, Paul DL. Connexin36 is essential for transmission of rod-mediated visual signals in the mammalian retina. Neuron. 2002;36:703–712. doi: 10.1016/s0896-6273(02)01046-2. [DOI] [PMC free article] [PubMed] [Google Scholar]
- Dedek K, Schultz K, Pieper M, Dirks P, Maxeiner S, Willecke K, Weiler R, Janssen-Bienhold U. Localization of heterotypic gap junctions composed of connexin45 and connexin36 in the rod pathway of the mouse retina. Eur J Neurosci. 2006;24:1675–1686. doi: 10.1111/j.1460-9568.2006.05052.x. [DOI] [PubMed] [Google Scholar]
- Dedek K, Breuninger T, de Sevilla Müller LP, Maxeiner S, Schultz K, Janssen-Bienhold U, Willecke K, Euler T, Weiler R. A novel type of interplexiform amacrine cell in the mouse retina. Eur J Neurosci. 2009;30:217–228. doi: 10.1111/j.1460-9568.2009.06808.x. [DOI] [PubMed] [Google Scholar]
- Dermietzel R, Kremer M, Paputsoglu G, Stang A, Skerrett IM, Gomes D, Srinivas M, Janssen-Bienhold U, Weiler R, Nicholson BJ, Bruzzone R, Spray DC. Molecular and functional diversity of neural connexins in the retina. J Neurosci. 2000;20:8331–8343. doi: 10.1523/JNEUROSCI.20-22-08331.2000. [DOI] [PMC free article] [PubMed] [Google Scholar]
- Dvoriantchikova G, Ivanov D, Panchin Y, Shestopalov VI. Expression of pannexin family of proteins in the retina. FEBS Lett. 2006;580:2178–2182. doi: 10.1016/j.febslet.2006.03.026. [DOI] [PubMed] [Google Scholar]
- Edelstein A, Amodaj N, Hoover K, Vale R, Stuurman N. Computer control of microscopes using μManager. Curr Protoc Mol Biol Chapter. 2010;14:Unit14.20. doi: 10.1002/0471142727.mb1420s92. [DOI] [PMC free article] [PubMed] [Google Scholar]
- Elstrott J, Feller MB. Direction-selective ganglion cells show symmetric participation in retinal waves during development. J Neurosci. 2010;30:11197–11201. doi: 10.1523/JNEUROSCI.2302-10.2010. [DOI] [PMC free article] [PubMed] [Google Scholar]
- Feigenspan A, Teubner B, Willecke K, Weiler R. Expression of neuronal connexin36 in AII amacrine cells of the mammalian retina. J Neurosci. 2001;21:230–239. doi: 10.1523/JNEUROSCI.21-01-00230.2001. [DOI] [PMC free article] [PubMed] [Google Scholar]
- Feigenspan A, Janssen-Bienhold U, Hormuzdi S, Monyer H, Degen J, Söhl G, Willecke K, Ammermüller J, Weiler R. Expression of connexin36 in cone pedicles and OFF-cone bipolar cells of the mouse retina. J Neurosci. 2004;24:3325–3334. doi: 10.1523/JNEUROSCI.5598-03.2004. [DOI] [PMC free article] [PubMed] [Google Scholar]
- Feldt S, Bonifazi P, Cossart R. Dissecting functional connectivity of neuronal microcircuits: experimental and theoretical insights. Trends Neurosci. 2011;34:225–236. doi: 10.1016/j.tins.2011.02.007. [DOI] [PubMed] [Google Scholar]
- Feller MB. Retinal waves are likely to instruct the formation of eye-specific retinogeniculate projections. Neural Dev. 2009;4:24. doi: 10.1186/1749-8104-4-24. [DOI] [PMC free article] [PubMed] [Google Scholar]
- Firth SI, Wang CT, Feller MB. Retinal waves: mechanisms and function in visual system development. Cell Calcium. 2005;37:425–432. doi: 10.1016/j.ceca.2005.01.010. [DOI] [PubMed] [Google Scholar]
- Guido W. Refinement of the retinogeniculate pathway. J Physiol. 2008;586:4357–4362. doi: 10.1113/jphysiol.2008.157115. [DOI] [PMC free article] [PubMed] [Google Scholar]
- Güldenagel M, Söhl G, Plum A, Traub O, Teubner B, Weiler R, Willecke K. Expression patterns of connexin genes in mouse retina. J Comp Neurol. 2000;425:193–201. [PubMed] [Google Scholar]
- Han Y, Massey SC. Electrical synapses in retinal ON cone bipolar cells: subtype-specific expression of connexins. Proc Natl Acad Sci U S A. 2005;102:13313–13318. doi: 10.1073/pnas.0505067102. [DOI] [PMC free article] [PubMed] [Google Scholar]
- Hansen KA, Torborg CL, Elstrott J, Feller MB. Expression and function of the neuronal gap junction protein connexin 36 in developing mammalian retina. J Comp Neurol. 2005;493:309–320. doi: 10.1002/cne.20759. [DOI] [PubMed] [Google Scholar]
- Harks EG, de Roos AD, Peters PH, de Haan LH, Brouwer A, Ypey DL, van Zoelen EJ, Theuvenet AP. Fenamates: a novel class of reversible gap junction blockers. J Pharmacol Exp Ther. 2001;298:1033–1041. [PubMed] [Google Scholar]
- Hombach S, Janssen-Bienhold U, Söhl G, Schubert T, Büssow H, Ott T, Weiler R, Willecke K. Functional expression of connexin57 in horizontal cells of the mouse retina. Eur J Neurosci. 2004;19:2633–2640. doi: 10.1111/j.0953-816X.2004.03360.x. [DOI] [PubMed] [Google Scholar]
- Huang H, Li H, He SG. Identification of connexin 50 and 57 mRNA in A-type horizontal cells of the rabbit retina. Cell Res. 2005;15:207–211. doi: 10.1038/sj.cr.7290288. [DOI] [PubMed] [Google Scholar]
- Huberman AD, Feller MB, Chapman B. Mechanisms underlying development of visual maps and receptive fields. Annu Rev Neurosci. 2008;31:479–509. doi: 10.1146/annurev.neuro.31.060407.125533. [DOI] [PMC free article] [PubMed] [Google Scholar]
- Iacobas DA, Urban-Maldonado M, Iacobas S, Scemes E, Spray DC. Array analysis of gene expression in connexin-43 null astrocytes. Physiol Genomics. 2003;15:177–190. doi: 10.1152/physiolgenomics.00062.2003. [DOI] [PMC free article] [PubMed] [Google Scholar]
- Iacobas DA, Iacobas S, Spray DC. Connexin-dependent transcellular transcriptomic networks in mouse brain. Prog Biophys Mol Biol. 2007;94:169–185. doi: 10.1016/j.pbiomolbio.2007.03.015. [DOI] [PubMed] [Google Scholar]
- Jacoby RA, Marshak DW. Synaptic connections of DB3 diffuse bipolar cell axons in macaque retina. J Comp Neurol. 2000;416:19–29. doi: 10.1002/(sici)1096-9861(20000103)416:1<19::aid-cne3>3.0.co;2-h. [DOI] [PMC free article] [PubMed] [Google Scholar]
- Kerschensteiner D, Wong RO. A precisely timed asynchronous pattern of ON and OFF retinal ganglion cell activity during propagation of retinal waves. Neuron. 2008;58:851–858. doi: 10.1016/j.neuron.2008.04.025. [DOI] [PMC free article] [PubMed] [Google Scholar]
- Kihara AH, Mantovani de Castro L, Belmonte MA, Yan CY, Moriscot AS, Hamassaki DE. Expression of connexins 36, 43, and 45 during postnatal development of the mouse retina. J Neurobiol. 2006;66:1397–1410. doi: 10.1002/neu.20299. [DOI] [PubMed] [Google Scholar]
- Kihara AH, Paschon V, Akamine PS, Saito KC, Leonelli M, Jiang JX, Hamassaki DE, Britto LR. Differential expression of connexins during histogenesis of the chick retina. Dev Neurobiol. 2008;68:1287–1302. doi: 10.1002/dneu.20652. [DOI] [PMC free article] [PubMed] [Google Scholar]
- Krüger O, Plum A, Kim JS, Winterhager E, Maxeiner S, Hallas G, Kirchhoff S, Traub O, Lamers WH, Willecke K. Defective vascular development in connexin 45-deficient mice. Development. 2000;127:4179–4193. doi: 10.1242/dev.127.19.4179. [DOI] [PubMed] [Google Scholar]
- Kumai M, Nishii K, Nakamura K, Takeda N, Suzuki M, Shibata Y. Loss of connexin45 causes a cushion defect in early cardiogenesis. Development. 2000;127:3501–3512. doi: 10.1242/dev.127.16.3501. [DOI] [PubMed] [Google Scholar]
- Lee SC, Cruikshank SJ, Connors BW. Electrical and chemical synapses between relay neurons in developing thalamus. J Physiol. 2010;588:2403–2415. doi: 10.1113/jphysiol.2010.187096. [DOI] [PMC free article] [PubMed] [Google Scholar]
- Lin B, Jakobs TC, Masland RH. Different functional types of bipolar cells use different gap-junctional proteins. J Neurosci. 2005;25:6696–6701. doi: 10.1523/JNEUROSCI.1894-05.2005. [DOI] [PMC free article] [PubMed] [Google Scholar]
- Long MA, Deans MR, Paul DL, Connors BW. Rhythmicity without synchrony in the electrically uncoupled inferior olive. J Neurosci. 2002;22:10898–10905. doi: 10.1523/JNEUROSCI.22-24-10898.2002. [DOI] [PMC free article] [PubMed] [Google Scholar]
- Massey SC, O'Brien JJ, Trexler EB, Li W, Keung JW, Mills SL, O'Brien J. Multiple neuronal connexins in the mammalian retina. Cell Commun Adhes. 2003;10:425–430. doi: 10.1080/cac.10.4-6.425.430. [DOI] [PubMed] [Google Scholar]
- Maxeiner S, Krüger O, Schilling K, Traub O, Urschel S, Willecke K. Spatiotemporal transcription of connexin45 during brain development results in neuronal expression in adult mice. Neuroscience. 2003;119:689–700. doi: 10.1016/s0306-4522(03)00077-0. [DOI] [PubMed] [Google Scholar]
- Maxeiner S, Dedek K, Janssen-Bienhold U, Ammermüller J, Brune H, Kirsch T, Pieper M, Degen J, Krüger O, Willecke K, Weiler R. Deletion of connexin45 in mouse retinal neurons disrupts the rod/cone signaling pathway between AII amacrine and ON cone bipolar cells and leads to impaired visual transmission. J Neurosci. 2005;25:566–576. doi: 10.1523/JNEUROSCI.3232-04.2005. [DOI] [PMC free article] [PubMed] [Google Scholar]
- McLaughlin T, Torborg CL, Feller MB, O'Leary DD. Retinotopic map refinement requires spontaneous retinal waves during a brief critical period of development. Neuron. 2003;40:1147–1160. doi: 10.1016/s0896-6273(03)00790-6. [DOI] [PubMed] [Google Scholar]
- Meister M, Wong RO, Baylor DA, Shatz CJ. Synchronous bursts of action potentials in ganglion cells of the developing mammalian retina. Science. 1991;252:939–943. doi: 10.1126/science.2035024. [DOI] [PubMed] [Google Scholar]
- Müller LP, Dedek K, Janssen-Bienhold U, Meyer A, Kreuzberg MM, Lorenz S, Willecke K, Weiler R. Expression and modulation of connexin 30.2, a novel gap junction protein in the mouse retina. Vis Neurosci. 2010;27:91–101. doi: 10.1017/S0952523810000131. [DOI] [PubMed] [Google Scholar]
- O'Brien JJ, Li W, Pan F, Keung J, O'Brien J, Massey SC. Coupling between A-type horizontal cells is mediated by connexin 50 gap junctions in the rabbit retina. J Neurosci. 2006;26:11624–11636. doi: 10.1523/JNEUROSCI.2296-06.2006. [DOI] [PMC free article] [PubMed] [Google Scholar]
- Pan F, Mills SL, Massey SC. Screening of gap junction antagonists on dye coupling in the rabbit retina. Vis Neurosci. 2007;24:609–618. doi: 10.1017/S0952523807070472. [DOI] [PMC free article] [PubMed] [Google Scholar]
- Pan F, Paul DL, Bloomfield SA, Völgyi B. Connexin36 is required for gap junctional coupling of most ganglion cell subtypes in the mouse retina. J Comp Neurol. 2010;518:911–927. doi: 10.1002/cne.22254. [DOI] [PMC free article] [PubMed] [Google Scholar]
- Penn AA, Wong RO, Shatz CJ. Neuronal coupling in the developing mammalian retina. J Neurosci. 1994;14:3805–3815. doi: 10.1523/JNEUROSCI.14-06-03805.1994. [DOI] [PMC free article] [PubMed] [Google Scholar]
- Personius KE, Chang Q, Mentis GZ, O'Donovan MJ, Balice-Gordon RJ. Reduced gap junctional coupling leads to uncorrelated motor neuron firing and precocious neuromuscular synapse elimination. Proc Natl Acad Sci U S A. 2007;104:11808–11813. doi: 10.1073/pnas.0703357104. [DOI] [PMC free article] [PubMed] [Google Scholar]
- Ray A, Zoidl G, Weickert S, Wahle P, Dermietzel R. Site-specific and developmental expression of pannexin1 in the mouse nervous system. Eur J Neurosci. 2005;21:3277–3290. doi: 10.1111/j.1460-9568.2005.04139.x. [DOI] [PubMed] [Google Scholar]
- Roerig B, Feller MB. Neurotransmitters and gap junctions in developing neural circuits. Brain Res Brain Res Rev. 2000;32:86–114. doi: 10.1016/s0165-0173(99)00069-7. [DOI] [PubMed] [Google Scholar]
- Scemes E, Suadicani SO, Dahl G, Spray DC. Connexin and pannexin mediated cell-cell communication. Neuron Glia Biol. 2007;3:199–208. doi: 10.1017/S1740925X08000069. [DOI] [PMC free article] [PubMed] [Google Scholar]
- Schubert T, Degen J, Willecke K, Hormuzdi SG, Monyer H, Weiler R. Connexin36 mediates gap junctional coupling of alpha-ganglion cells in mouse retina. J Comp Neurol. 2005a;485:191–201. doi: 10.1002/cne.20510. [DOI] [PubMed] [Google Scholar]
- Schubert T, Maxeiner S, Krüger O, Willecke K, Weiler R. Connexin45 mediates gap junctional coupling of bistratified ganglion cells in the mouse retina. J Comp Neurol. 2005b;490:29–39. doi: 10.1002/cne.20621. [DOI] [PubMed] [Google Scholar]
- Sernagor E, Eglen SJ, O'Donovan MJ. Differential effects of acetylcholine and glutamate blockade on the spatiotemporal dynamics of retinal waves. J Neurosci. 2000;20:RC56. doi: 10.1523/JNEUROSCI.20-02-j0004.2000. (1–6) [DOI] [PMC free article] [PubMed] [Google Scholar]
- Sheu SJ, Bee YS, Chen CH. Resveratrol and large-conductance calcium-activated potassium channels in the protection of human retinal pigment epithelial cells. J Ocul Pharmacol Ther. 2008;24:551–555. doi: 10.1089/jop.2008.0013. [DOI] [PubMed] [Google Scholar]
- Singer JH, Mirotznik RR, Feller MB. Potentiation of L-type calcium channels reveals nonsynaptic mechanisms that correlate spontaneous activity in the developing mammalian retina. J Neurosci. 2001;21:8514–8522. doi: 10.1523/JNEUROSCI.21-21-08514.2001. [DOI] [PMC free article] [PubMed] [Google Scholar]
- Söhl G, Güldenagel M, Traub O, Willecke K. Connexin expression in the retina. Brain Res Brain Res Rev. 2000;32:138–145. doi: 10.1016/s0165-0173(99)00074-0. [DOI] [PubMed] [Google Scholar]
- Söhl G, Maxeiner S, Willecke K. Expression and functions of neuronal gap junctions. Nat Rev Neurosci. 2005;6:191–200. doi: 10.1038/nrn1627. [DOI] [PubMed] [Google Scholar]
- Spray DC, Iacobas DA. Organizational principles of the connexin-related brain transcriptome. J Membr Biol. 2007;218:39–47. doi: 10.1007/s00232-007-9049-5. [DOI] [PubMed] [Google Scholar]
- Stacy RC, Demas J, Burgess RW, Sanes JR, Wong RO. Disruption and recovery of patterned retinal activity in the absence of acetylcholine. J Neurosci. 2005;25:9347–9357. doi: 10.1523/JNEUROSCI.1800-05.2005. [DOI] [PMC free article] [PubMed] [Google Scholar]
- Stafford BK, Sher A, Litke AM, Feldheim DA. Spatial-temporal patterns of retinal waves underlying activity-dependent refinement of retinofugal projections. Neuron. 2009;64:200–212. doi: 10.1016/j.neuron.2009.09.021. [DOI] [PMC free article] [PubMed] [Google Scholar]
- Stosiek C, Garaschuk O, Holthoff K, Konnerth A. In vivo two-photon calcium imaging of neuronal networks. Proc Natl Acad Sci U S A. 2003;100:7319–7324. doi: 10.1073/pnas.1232232100. [DOI] [PMC free article] [PubMed] [Google Scholar]
- Syed MM, Lee S, Zheng J, Zhou ZJ. Stage-dependent dynamics and modulation of spontaneous waves in the developing rabbit retina. J Physiol. 2004;560:533–549. doi: 10.1113/jphysiol.2004.066597. [DOI] [PMC free article] [PubMed] [Google Scholar]
- Takeda Y, Ward SM, Sanders KM, Koh SD. Effects of the gap junction blocker glycyrrhetinic acid on gastrointestinal smooth muscle cells. Am J Physiol Gastrointest Liver Physiol. 2005;288:G832–G841. doi: 10.1152/ajpgi.00389.2004. [DOI] [PubMed] [Google Scholar]
- Torborg CL, Feller MB. Unbiased analysis of bulk axonal segregation patterns. J Neurosci Methods. 2004;135:17–26. doi: 10.1016/j.jneumeth.2003.11.019. [DOI] [PubMed] [Google Scholar]
- Torborg CL, Feller MB. Spontaneous patterned retinal activity and the refinement of retinal projections. Prog Neurobiol. 2005;76:213–235. doi: 10.1016/j.pneurobio.2005.09.002. [DOI] [PubMed] [Google Scholar]
- Torborg CL, Hansen KA, Feller MB. High frequency, synchronized bursting drives eye-specific segregation of retinogeniculate projections. Nat Neurosci. 2005;8:72–78. doi: 10.1038/nn1376. [DOI] [PMC free article] [PubMed] [Google Scholar]
- Tovar KR, Maher BJ, Westbrook GL. Direct actions of carbenoxolone on synaptic transmission and neuronal membrane properties. J Neurophysiol. 2009;102:974–978. doi: 10.1152/jn.00060.2009. [DOI] [PMC free article] [PubMed] [Google Scholar]
- Tronche F, Kellendonk C, Kretz O, Gass P, Anlag K, Orban PC, Bock R, Klein R, Schütz G. Disruption of the glucocorticoid receptor gene in the nervous system results in reduced anxiety. Nat Genet. 1999;23:99–103. doi: 10.1038/12703. [DOI] [PubMed] [Google Scholar]
- Veruki ML, Hartveit E. Meclofenamic acid blocks electrical synapses of retinal AII amacrine and on-cone bipolar cells. J Neurophysiol. 2009;101:2339–2347. doi: 10.1152/jn.00112.2009. [DOI] [PubMed] [Google Scholar]
- Vessey JP, Lalonde MR, Mizan HA, Welch NC, Kelly ME, Barnes S. Carbenoxolone inhibition of voltage-gated Ca channels and synaptic transmission in the retina. J Neurophysiol. 2004;92:1252–1256. doi: 10.1152/jn.00148.2004. [DOI] [PubMed] [Google Scholar]
- Völgyi B, Abrams J, Paul DL, Bloomfield SA. Morphology and tracer coupling pattern of alpha ganglion cells in the mouse retina. J Comp Neurol. 2005;492:66–77. doi: 10.1002/cne.20700. [DOI] [PMC free article] [PubMed] [Google Scholar]
- Willecke K, Eiberger J, Degen J, Eckardt D, Romualdi A, Güldenagel M, Deutsch U, Söhl G. Structural and functional diversity of connexin genes in the mouse and human genome. Biol Chem. 2002;383:725–737. doi: 10.1515/BC.2002.076. [DOI] [PubMed] [Google Scholar]
- Wong RO, Meister M, Shatz CJ. Transient period of correlated bursting activity during development of the mammalian retina. Neuron. 1993;11:923–938. doi: 10.1016/0896-6273(93)90122-8. [DOI] [PubMed] [Google Scholar]
- Wong RO, Chernjavsky A, Smith SJ, Shatz CJ. Early functional neural networks in the developing retina. Nature. 1995;374:716–718. doi: 10.1038/374716a0. [DOI] [PubMed] [Google Scholar]
- Wong WT, Sanes JR, Wong RO. Developmentally regulated spontaneous activity in the embryonic chick retina. J Neurosci. 1998;18:8839–8852. doi: 10.1523/JNEUROSCI.18-21-08839.1998. [DOI] [PMC free article] [PubMed] [Google Scholar]
- Wu SN, Jan CR, Chiang HT. Fenamates stimulate BKCa channel osteoblast-like MG-63 cells activity in the human. J Invest Med. 2001;49:522–533. doi: 10.2310/6650.2001.33629. [DOI] [PubMed] [Google Scholar]
- Zlomuzica A, Reichinnek S, Maxeiner S, Both M, May E, Wörsdörfer P, Draguhn A, Willecke K, Dere E. Deletion of connexin45 in mouse neurons disrupts one-trial object recognition and alters kainate-induced gamma-oscillations in the hippocampus. Physiol Behav. 2010;101:245–253. doi: 10.1016/j.physbeh.2010.05.007. [DOI] [PubMed] [Google Scholar]