

Abstract
We describe a comparative sequencing strategy that is based on matrix-assisted laser desorption/ionization time-of-flight mass spectrometry (MALDI-TOF MS) analyses of complete base-specific cleavage reactions of a target sequence. The target is converted to a DNA/RNA mosaic structure after PCR amplification using in vitro transcription. Cleavage with defined specificity is achieved by ribonucleases. The set of cleavage products is subjected to mass spectrometry without prior fractionation. The presented resequencing assay is particularly useful for single-nucleotide polymorphism (SNP) discovery. The combination of mass spectra from four complementary cleavage reactions detects approximately 98% of all possible homozygous and heterozygous SNPs in target sequences with a length of up to 500 bases. In general, both the identity and location of the sequence variation are determined. This was exemplified by the discovery of SNPs in the human gene coding for the cholesteryl ester transfer protein using a panel of 96 genomic DNAs.
The identification and scoring of polymorphisms and mutations are playing an increasingly important role in medical genetics. Single-nucleotide polymorphisms (SNPs) are, by virtue of their abundance and stability, the focus of attention in large-scale association studies and pharmacogenomics (Lander 1996; Risch and Merikangas 1996; McCarthy and Hilfiker 2000). Furthermore, many clinical diagnostic applications depend on the accurate analysis of specific genomic regions for known as well as unknown sequence variants (Forrest and Cotton 1990).
A variety of techniques are used to discover sequence variations. These include denaturing gradient gel electrophoresis (Sheffield et al. 1989), chemical or enzymatic cleavage at mismatch sites (Myers et al. 1985; Cotton et al. 1988; Youil et al. 1995), gel-electrophoretic detection of heteroduplexes as well as single stranded conformations (Orita et al. 1989; Glavac and Dean 1995), denaturing HPLC (O'Donovan et al. 1998), hybridization to oligonucleotide arrays (Chee et al. 1996; Hacia et al. 1996; Hacia 1999; Patil et al. 2001), and direct DNA sequencing (Gibbs et al. 1989; Kwok et al. 1994; Nickerson et al. 1997; Altshuler et al. 2000; Mullikin et al. 2000). Conventional dideoxy sequencing and, in principle, array hybridization offer the advantage of complete information about the nature and location of the sequence variation and are amenable to large-scale SNP discovery efforts by means of their massively parallel nature or implementation in high-throughput settings (Altshuler et al. 2000; Mullikin et al. 2000; Patil et al. 2001). With both technologies, however, base-calling errors can dominate the low rate of true SNPs, and certain quality thresholds have to be defined to obtain acceptable levels of false-positives (Nickerson et al. 1997; Altshuler et al. 2000; Mullikin et al. 2000; Patil et al. 2001). It appears that ∼20%-30% of the data obtained by single-pass sequencing or array-based analysis are of insufficient quality for reliable SNP detection (Altshuler et al. 2000; Patil et al. 2001). In addition, the identification of SNPs as heterozygotes is challenging using the chip-based system as well as automated gel-based sequencing (Nickerson et al. 1997; Hacia 1999; Altshuler et al. 2000).
In this report, we present a novel approach to comparative sequence analysis. The use of RNase-based approaches for detection of sequence variations by mass spectrometry has been proposed by our groups and others earlier (Rodi et al. 2002; Zabeau and Stanssens 2000; Hartmer et al. 2003; Krebs et al. 2003). Unlike previously reported MS-based methods to screen for posttranscriptional modifications (Kirpekar et al. 2000) or mutations (Elso et al. 2002; Hartmer et al. 2003; Krebs 2003), we report the first successful implementation of an approach that involves the analysis of all four base-specific end-digests of the target nucleic acid by matrix-assisted laser desorption/ionization time-of-flight mass spectrometry (MALDI-TOF MS). The method is sensitive in the detection of both homozygous and heterozygous base changes, permitting targeted discovery using amplicons rather than clones. The accuracy and the high signal-to-noise ratios of the mass spectrometric signals result in a low rate of false-positives. This is further supported by the multiplicity of mass signal changes observed in all four reactions, which may also significantly reduce false-negatives. Combined with the high data acquisition speed of MALDI-TOF MS, the method compares favorably with conventional sequencing in terms of throughput.
RESULTS AND DISCUSSION
Assay Concept
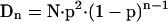
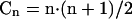
The method described here for the identification of sequence variations consists of four individual base-specific cleavage reactions, followed by analysis of each mixture of cleavage products by MALDI-TOF MS. Sequence variations are identified on the basis of discrepancies between the experimentally determined masses and predicted masses using in silico-generated mass spectra from a reference sequence. In the present study only qualitative spectral changes were considered, although in many cases normalized peak areas allow determination of the relative quantity of a fragment (Buetow et al. 2001; Bansal et al. 2002; Mohlke et al. 2002). It follows from the approximate size distribution of the cleavage products (Dn; equation 1) derived from a target sequence of total length N and the number of compositions that a given n-mer can adopt (Cn; equation 2) that coinciding fragments occur predominantly in the low mass region. The equations assume an infinite string with uniform probability (P = 0.25) for each nucleotide and also that the cleaved base remains with the fragment, as is the case for RNase cleavage described below. In equation 1, the term p2 measures the probability that a cleaved base is found at the beginning and end of a string; (1-p)n-1 accounts for n-1 bases that are not cleaved.
 |
1 |
 |
2 |
In practice, with target sequences of several hundred basepairs long, the mono-, di- and trinucleotides are noninformative as a consequence of the many coinciding fragments. Furthermore the mono- and dinucleotides are obscured by matrix-associated signals, irrespective of the length of the target sequence. Information may also be lost in the high mass region, because the sensitivity of detection decreases with the length of the fragment. Taken together, the utilizable mass range extends from 1100 Da to ∼10,000 Da. Fragments that fall within this window and that range in size from 4-mers to ∼30-mers can be calculated to cover ∼74% (Σn=4->30 Dn·n/N) of the target sequence. Thus, a single mass fingerprint generated by complete cleavage does not allow for a comprehensive screen for sequence variations. This deficiency is offset in the present methodology, where all four basespecific cleavage reactions are performed.
The significance of complementary base-specific cleavages extends beyond the mere increase in likelihood that a sequence variation is detected. Typically, the combination of the information in the four spectra also results in the identity of the substitution as well as its unambiguous localization. When ambiguity does occur, in most cases it is restricted to a small number of closely spaced positions (generally two adjacent identical bases; see below).
In essence, the combined information from all four base-specific cleavages already largely determines the sequence of the underlying target amplicon. The use of a reference sequence allows the resolution of ambiguities remaining after reconstruction of sequence candidates from the cleavage pattern. In most cases, initial ambiguities are the loss of orientation of a sequence stretch between inverted repeats.
Assay Development
The SNP discovery methodology presented here is schematically outlined in Figure 1. In essence, the four base-specific reactions are realized by enzymatic cleavage of transcripts where one specific base is present in the 2′-deoxy form. This mosaic structure permits cleavage in a definite base-specific manner with RNases, which generally do not exhibit sufficient base specificity. Such transcripts can be prepared with good efficiency using mutant T7 or SP6 RNA polymerase that has essentially lost its ability to discriminate rNTP and dNTP substrates (Sousa and Padilla 1995). To this end, the target sequences are first PCR-amplified using primers that incorporate the T7 and SP6 promoter sequences as nonannealing 5′-extensions. The use of PCR primers that carry different promoter sequences permits the transcription of both strands in two parallel strand-specific reactions. We chose to use a pyrimidine-specific enzyme, that is, RNase-A, in combination with either a dCMP- or dTMP/dUMP-containing transcript to cleave the target sequence after U- and C-residues, respectively. With this single enzyme, all four bases can be interrogated when the complementary strand is included in the analysis. A number of different cleavage schemes using alternative RNases are conceivable. One alternative scheme that we have utilized consists of the replacement of the dT/RNase-A reaction with a G-specific, RNase-T1-mediated digestion of the dC-transcript of the opposite strand (see Fig. 1). This scheme has the advantage that only one type of transcript (i.e., the dC-transcript) must be synthesized from each strand. It becomes the favored cleavage when the target sequence contains an extended run of A residues on the transcribed strand. We have observed that relatively short oligo(A) tracts (≥7-mer) can serve as termination sites for mutant T7 and SP6 polymerases when UTP is replaced by dTTP or dUTP substrate (data not shown). The use of RNase T1 would not require the incorporation of deoxynucleotides, as this RNase exclusively cleaves at G-residues. The mass difference between U and rC, however, is only 1 Da, whereas the mass difference between U and dC is 15 Da. Simulations such as those discussed below and previous experiments (Hartmer et al. 2003) demonstrate that the 1-Da mass difference between C and U typically results in the loss of a significant amount of information. The use of a dC-transcript for RNase T1 cleavage introduces a more favorable mass difference and avoids these issues.
Figure 1.

Schematic outline of the resequencing strategy using chip-based mass spectrometry. (A) The target region is first PCR-amplified with primers bearing bacteriophage T7 and SP6 RNA polymerase promoter sequences (dashed lines).(B) A mosaic transcript, with dCMP or dTMP/dUMP replacing the regular nucleoside, is derived from each strand of the amplicon (represented by the arrows) and base-specifically cleaved (see text for details).(C) Finally, the set of cleavage products, as a group, is analyzed by an array mass spectrometer.
For conditioning of the nucleic acid cleavage products prior to MALDI-MS analysis, two alternative procedures were used in the present study. In the first procedure, the transcript is allowed to hybridize onto an immobilized oligonucleotide that is complementary to the transcript's 3′-end. Note that all transcripts can be captured with a generic T7 and SP6 oligonucleotide (see Fig. 1). The captured transcript is extensively washed with ammonium to replace the metal ions and then digested with RNase under MALDI-MS-compatible conditions. In the second protocol, the transcription, cleavage, and sample conditioning are carried out as a series of add-on reactions in a single tube. This approach avoids the use of solid phases. Conditioning is realized through the addition of ammonium-loaded cation exchange resin to the reaction vessel, and the resultant mixture is directly applied onto a chip array for MALDI analysis.
Proof of Concept
Each single nucleotide substitution can in principle result in 10 mass spectral changes. For instance, a SNP that does not alter a cleavage site leads to two changes per spectrum, that is, the disappearance of a wild-type peak and the appearance of a peak associated with the sequence alteration. This occurs in two cleavages (hence force a total of four changes). For a SNP that alters a cleavage site, there are a total of six changes (three changes per cleavage reaction): In one cleavage reaction, the SNP introduces a new cleavage site and a single mass signal disappears and is replaced by two new peaks of lesser mass; in another cleavage, the SNP abolishes a cleavage site and two mass signals disappear and a new single peak appears at higher mass. All 10 spectral changes can only be observed in the case of homozygous sequence changes. The identification of SNPs as heterozygous genotypes is necessarily based on half that many observations (a maximum of five) because the peaks associated with the wild-type and the variant sequence are both present. In practice, not all spectral changes can be observed, because certain fragments fall outside the utilizable mass window; that is, the fragments are either too small or too large to be detected. Furthermore, the larger the interrogated target sequence the greater the occurrence of coinciding cleavage products of the same composition, generating so-called “silent mass signals”, which require quantitative analysis in order to be informative. Because only qualitative spectral changes were taken into account in this study, this results in loss of information.
Figure 2 illustrates the discovery of a G/A SNP in a 660-bp amplicon using the present methodology. The concept of multiple observations becomes evident when analyzing the mass signal changes in the four base-specific cleavage reactions. In a homozygous individual, the T-specific cleavage of the forward transcript reveals a missing signal of known identity at 2613.6 Da, whereas a new mass signal appears at 2597.6 Da. The most straightforward explanation for this observation is that one of the G residues on the 2613.6-Da fragment is replaced by an A, reducing its mass by 16 Da. For a heterozygous individual the spectrum would contain both peaks. The C-specific reaction on the forward transcript confirms the observation of a G/A substitution seen in the T-reaction, but does not help to further define the sequence variation; that is, the forward reactions, individually or in combination, do not allow one to pinpoint which of the four successive G residues is mutated. Unambiguous positioning of the G/A polymorphism can, however, be drawn from the complementary spectra. In the T- and C-specific reaction on the reverse strand, the G/A substitution would either create or eliminate a cleavage site, and the resultant spectral changes would permit the unequivocal localization of the polymorphism. In the T-reaction on mutant samples, a 2348.4-Da fragment is observed which can only be explained by assuming that the first of the four successive G′s is replaced. Substitution of the other G residues would have resulted in a fragment of 2637.6, 2926.8, or 3216.0 Da, all of which would have been visible as distinct mass signal peaks. The mass signal that appears in the mutant C (reverse)-spectrum yields confirmatory information. The mass signal at 3326.1 Da would normally be expected to disappear in the homozygous mutant sample. In this particular case, two cleavage products with identical nucleotide compositions (and thus identical masses) were generated from different regions of the target sequence. As a consequence, the sequence change leads only to a signal-to-noise reduction of the corresponding mass signal. Close inspection of all of the spectra shown in Figure 2 reveals that overall peak intensity correlates well with the relative amount of cleavage products; that is, most of the peaks that relate to the G/A sequence change have in the case of heterozygous substitution roughly half the intensity seen with homozygous samples. It should also be pointed out that the interrogated amplicon incorporates multiple SNPs (see Fig. 2 legend). In general, the presence of additional SNPs does not confound the analysis, although it becomes more difficult the more the test sequence diverges from the reference DNA. The identification of SNPs in the present study required visual interpretation of spectra (see the Methods section); proprietary software has since become available for automated SNP discovery based on the integration of the information in the four complementary spectra (Böcker 2003).
Figure 2.

Identification of a single-nucleotide replacement by MALDI-MS analysis of four complementary base-specific cleavages.Each panel details one of the cleavage reactions (i.e., C- and U-specific cleavage using RNase-A on dT- and dC-incorporating transcripts of both strands) and includes the spectral changes that result from the substitution of a G (wt allele) for an A (mutant allele) as well as a comparison of the corresponding portions of the spectra obtained for three samples with a different genotype (black, homozygous wt; blue, heterozygous; green, homozygous substitution).Arrows indicate the predicted spectral changes that can be observed in the display.The 3326.1-Da peak in the C-reverse reaction does not disappear, because two wild-type fragments coincide at that spectral position, only one of which is affected by the mutation. Further spectral changes visible in the C and T-specific reverse reaction relate to an additional sequence change present in the displayed sample amplicon.
Simulation Study
We performed a number of simulation studies to demonstrate the performance of the MS-based cleavage assays for the discovery of homozygous and heterozygous single-nucleotide changes (substitutions, insertions, and deletions) as well as to explore the effect of the length of the interrogated target sequence. To that end, a program was used that systematically introduced all possible single-nucleotide mutations in a given test sequence and categorized the sequence variations depending on the ability to detect them using the four cleavage reactions, the ability to determine the nature of the sequence change, and the ability to unambiguously localize them. In the simulations, only mass signals between 1100 Da and 10,000 Da were considered. We assumed a mass resolution (m/Δm) of 1000 in the 5-10-kDa region, a value routinely achieved with state-of-the-art equipment when desorbing nucleic acids from chip arrays. In the region below 5000 Da, we considered peaks detectable only when separated by ≥5 Da. Four alternative cleavage schemes were tested (Fig. 1): (1) RNase-A cleavage of the dC- and dU-transcripts of each strand, (2) RNase-A cleavage of the dC- and dT-transcripts of the two strands, (3) RNase-A and RNase-T1 cleavage of the dC-transcripts of both strands, and (4) RNase-A cleavage of the dC- and dU-transcripts of the top strand, RNase-T1 cleavage of the top strand dC-transcript, and RNase-A on the dC-transcript of the bottom strand. Details of the model system are given in the Methods section.
The results of the simulations where one of the above reaction sets is used for the identification of single-nucleotide substitutions are summarized in Table 1. The data obtained with alternative sets of cleavage reactions are not significantly different (data not shown). The results demonstrate that the MS-analyses of complementary cleavage reactions represent a very sensitive method; overall, >98% of all possible SNPs can be detected in target sequences with a length of up to 500 bases. Even with sequences of 1000 bases, over 95% of the SNPs can be observed. As discussed above, the sequence content of the mass spectra is considerable and the method, in general, also permits determination of the identity as well as the positions of the SNPs. The one other sizable category consists of SNPs that cannot be localized unambiguously. This almost invariably is the result of mutations at nearby (in most cases adjacent) positions yielding indistinguishable profiles. Taken together, more than 95% of the single-nucleotide substitutions in 500-bp target sequences can be identified and localized to a single position or within a few closely spaced identical bases. A further simulation study covering around 4 Mb of sequence in over 16 randomly selected gene regions (including coding and noncoding sequence) revealed detection rates equivalent to those obtained for the 64-kB region depicted in Table 1. This supports the notion that our original data set is not biased towards increased detection rates. A more extensive simulation study including a detailed account of sequence dependency of our method will be published elsewhere.
Table 1.
Effect of Amplicon Length and Zygosity on Assay Performance
| Amplicon length (bp) | Detection, characterization, and mappinga | Detection and characterizationb | Detectionc | No detection |
|---|---|---|---|---|
| Homozygous replacements | ||||
| 100 | 95.47 ± 3.64 | 4.40 ± 3.25 | 0.05 ± 0.38 | 0.08 ± 0.72 |
| 200 | 93.74 ± 2.90 | 6.01 ± 2.56 | 0.11 ± 0.37 | 0.14 ± 0.62 |
| 300 | 92.09 ± 2.51 | 7.43 ± 2.08 | 0.25 ± 0.46 | 0.23 ± 0.75 |
| 400 | 90.43 ± 2.72 | 8.88 ± 2.17 | 0.41 ± 0.52 | 0.29 ± 0.77 |
| 500 | 88.69 ± 2.70 | 10.30 ± 2.16 | 0.64 ± 0.62 | 0.38 ± 0.75 |
| 600 | 87.04 ± 2.73 | 11.56 ± 2.17 | 0.93 ± 0.75 | 0.49 ± 0.78 |
| 700 | 85.40 ± 2.40 | 12.77 ± 1.94 | 1.20 ± 0.71 | 0.64 ± 0.86 |
| 800 | 83.83 ± 2.26 | 13.85 ± 1.69 | 1.54 ± 0.90 | 0.77 ± 0.95 |
| 900 | 82.10 ± 2.58 | 14.90 ± 1.73 | 2.06 ± 1.04 | 0.94 ± 0.85 |
| 1000 | 80.72 ± 2.49 | 15.79 ± 1.64 | 2.40 ± 1.18 | 1.09 ± 1.04 |
| Heterozygous replacements | ||||
| 100 | 94.24 ± 4.25 | 5.28 ± 3.48 | 0.22 ± 0.97 | 0.26 ± 1.16 |
| 200 | 91.63 ± 3.43 | 7.23 ± 2.61 | 0.62 ± 1.09 | 0.51 ± 1.00 |
| 300 | 88.97 ± 3.11 | 8.93 ± 2.13 | 1.24 ± 1.27 | 0.88 ± 1.12 |
| 400 | 86.31 ± 3.26 | 10.42 ± 2.09 | 2.04 ± 1.36 | 1.24 ± 1.18 |
| 500 | 83.36 ± 3.20 | 11.81 ± 1.96 | 3.14 ± 1.59 | 1.68 ± 1.20 |
| 600 | 80.66 ± 3.49 | 12.71 ± 1.97 | 4.46 ± 1.79 | 2.17 ± 1.34 |
| 700 | 77.77 ± 3.31 | 13.54 ± 1.85 | 5.91 ± 1.95 | 2.78 ± 1.38 |
| 800 | 75.28 ± 3.13 | 14.25 ± 1.59 | 7.31 ± 1.92 | 3.17 ± 1.42 |
| 900 | 72.56 ± 3.71 | 14.75 ± 1.51 | 8.87 ± 2.36 | 3.82 ± 1.50 |
| 1000 | 70.43 ± 3.41 | 15.20 ± 1.49 | 10.08 ± 2.35 | 4.29 ± 1.66 |
% SNPs (±sd) that can be detected, characterized (i.e., determination of the nature of the substitution), and unambiguously mapped
% SNPs (±sd) that can be detected and characterized but not unambiguously positioned; typically, the ambiguity is restricted to a few (in many cases two) nearby positions
% SNPs (±sd) that can be detected but not characterized; only a minor fraction of these SNPs can be positioned (i.e., the one uncertainty is the nature of the substitute base)
Discovery of SNPs in the CETP Gene
A contiguous ∼5-kb region of the gene coding for CETP (cholesteryl ester transfer protein), running from exon 9to exon 11, was selected as a target sequence for the present SNP discovery study. Gene ENSG00000087237 (nucleotide position 11486-16410) from the Ensembl genomic database was taken as the reference sequence. The target region was divided into 10 amplicons ranging in size from 373 to 646 bp. DNA samples of 96 independent individuals of Caucasian ancestry were analyzed in duplicate using the captured transcript format and the homogeneous assay format (refer to the Methods section). The following cleavage reactions were performed (see also Fig. 1): an RNase-A digest of the dC-containing T7 transcript (i.e., T-reaction), an RNase-A digest of the dC- and dU-containing SP6-transcripts (i.e., A- and G-reactions), and RNase-T1 cleavage of the dC SP6-transcript (i.e., C-reaction). Thus, a total of 7680 spectra were acquired; the assay failure rate was ∼2%. A total of 27 candidate SNPs (Table 2) were discovered using the two assay formats; the results obtained with the two alternative procedures were only different when assay failure of indicative reactions occurred.
Table 2.
Discovery of SNPs in the CETP Gene
|
Base-specific cleavage results
|
Public SNPsa
|
||||
|---|---|---|---|---|---|
| Amplicon | # | Type | Positionb | Allele freq | SNP ID |
| Amplicon 1 | 1 | C to T | 11594/11597/11598 | 0.93/0.07 | rs5883 |
| 2 | T to G | 11690 | 0.85/0.15c | ||
| 3 | G to A | 11693/11694/11695 | 0.86/0.14c | rs289714 | |
| 4 | G to A | 11854/11855 | 0.47/0.53 | rs158477 | |
| Amplicon 2 | 5 | C to T | 11967 | 0.99/0.01 | |
| 6 | A to C | 11978 | 0.46/0.54 | rs158478 | |
| 7 | G to A | 12292 | 0.46/0.54 | rs158479 | |
| Amplicon 3 | 8 | G to A | 12469/12471 | 0.13/0.87 | rs158480 |
| 9 | A to G | 12530/12531 | 0.13/0.87 | rs158617 | |
| 10 | A to T | 12752 | 0.12/0.88 | rs289715 | |
| Amplicon 4 | T to G | 13439 | rs2303789d | ||
| 11 | A to G | 13490 | 0.995/0.005 | ||
| Amplicon 5 | 12 | T to A | 13620 | 0.29/0.71 | rs289716 |
| 13 | G to A | 13632 | 0.63/0.37 | rs289717 | |
| 14 | T to A | 14013 | 0.99/0.01c | rs736274 | |
| Amplicon 6 | 15 | C to T | 14176 | 0.30/0.70 | rs289718 |
| T to C | 14185 | rs289719d | |||
| 16 | T to C | 14229 | 0.67/0.33 | rs2033254 | |
| 17 | G to A | 14361 | 0.995/0.005 | ||
| 18 | C to T | 14476 | 0.89/0.11 | ||
| Amplicon 7 | 19 | T to G | 14626 | 0.92/0.08c | |
| 20 | C to T | 14730 | 0.98/0.02 | ||
| Amplicon 8 | 21 | A to G | 15072 | 0.68/0.32c | |
| 22 | T to G | 15192 | 0.10/0.90 | rs1968905 | |
| 23 | T to G | 15238 | 0.96/0.04 | ||
| Amplicon 9 | 24 | G to A | 15429/15430 | 0.63/0.37 | |
| 25 | G to A | 15696 | 0.63/0.37 | rs291044 | |
| Amplicon 10 | 26 | C to T | 16128/16131/16132 | 0.99/0.01 | |
| 27 | C to T | 16177/16179/16180 | 0.99/0.01 | rs891144 | |
| G to A | 16256 | rs5881d | |||
The reader is referred to http://www.ncbi.nlm.nih.gov/ for information on the public SNPs
Positional ambiguity was resolved by the MassEXTEND assay; the SNP position is underlined
The marked allele frequencies were calculated using the Hardy-Weinberg equation; in these cases, heterozygotes could not be distinguished from either wild-type or mutant homozygous samples
Three public SNPs (italics) were not identified using the base-specific cleavage assay. SNPs rs2303789 (found in an Asian population) and rs5881 (allele frequency = 0.025) are absent from our sample collection. rs289719 was missed because of its genetic linkage with and close proximity to rs289718; concurrence of the two SNPs is mass-neutral
Of the 27 SNPs, 16 were described previously. All of the SNPs identified by our approach were experimentally validated by means of MassEXTEND reactions. The ambiguity that remains after the cleavage reactions for particular SNPs does not present a problem. In fact, the primer extension assays could be designed such that they not only validate the candidate SNPs but, additionally, resolve the positional uncertainty, when present. Three public SNPs were not identified in the present study. Reexamination of the data set showed that two of these polymorphisms are absent from our sample collection. The third SNP, however, is present in some of our samples as evidenced by the MassEXTEND assays and is a clear case of a false negative. This SNP was missed because (1) of genetic linkage to another nearby SNP, and (2) the concurrence of both SNPs on a cleavage product is mass-neutral (Table 2; SNPs at position 14176 and 14185).
No false positives were identified in the present study. The robustness of the methodology rests primarily on the fact that a sequence variation is associated with one or more distinct and characteristic signals in the various cleavage reactions. To illustrate this feature, all base-specific cleavage patterns for a newly discovered CETP SNP are displayed in Figure 3. This G/A polymorphism was detected in a heterozygous sample. The sequence change generates in aggregate four additional mass signals.
Figure 3.

Base-specific cleavage spectra leading to the discovery of a G/A polymorphism at nucleotide position 13490 of the CETP gene (SNP #11 in Table 2).For each cleavage reaction, the spectral changes expected to result from the proposed SNP and the experimental results are shown.The spectra of a representative homozygous wt sample are matched with the spectra of the single heterozygous sample in which the mutation was found.Arrows indicate the wt and the mutation-specific peaks.
In principle, it should be possible to use sample pools to detect SNPs. This analysis was not explored in the present study, but preliminary experiments with samples consisting of various ratios of two allelic sequences suggest a detection threshold of ∼5%. As MALDI-TOF MS resequencing results in highly discernible new signals, this approach for SNP discovery using pooled samples should have a clear advantage over capillary electrophoresis (CE) sequencing methods, where SNP signals are coincident and often difficult to discern.
The base-specific cleavage assays described here, especially the homogeneous format, are readily amenable to automation. Combined with the chip-based MassARRAY platform, this allows high-throughput serial spectrum acquisition. At a rate of 14,592 cleavage reactions (38 × 384-chip elements) performed on about 500 base-pair-long target sequences, ∼1.8 Mb can be analyzed per day per instrument. This is comparable to the throughput achieved with conventional sequencing using new capillarybased instruments. Faster laser repetition rates (currently 20 Hz) will increase this number to easily over 3 Mb a day. We believe that the resequencing approach reported here is powerful in terms of sensitivity, accuracy as well as speed.
METHODS
Cleavage Assay
Captured Transcript Assay
The CETP regions of interest were first PCR-amplified starting from human genomic DNA using primers that incorporate T7 [5′-CAGTAATACGACTCACTATAGGGAGA] and SP6 [5′-CGATTTAGGAGACACTATAGAAGAG] promoter sequences. The PCR reactions were carried out in a total volume of 20 μL using 5 pmol of each primer, 200 μM dNTP, 0.1 μL Taq DNA polymerase (5 U/μL; Promega), 1.5 mM MgCl2, and a buffer supplied with the enzyme. Typically, 2 μL of the PCR reaction (25-250 ng amplicon) was directly used as template in a 10-μL transcription reaction. A mutant polymerase (25 units T7 or SP6 R&DNA polymerase; Epicentre) was used to incorporate either dCTP or dUTP/dTTP in the transcripts. Ribonucleotides were used at 1 mM and the dNTP substrate at 5 mM; other components in the reaction were as recommended by the supplier. The reaction additionally contained 10 μg streptavidin-coated paramagnetic beads (Seradyn) preloaded with a 5′-biotinylated oligonucleotide (sequence as shown above) that is complementary to the generic 3′-end of the T7- or SP6-transcripts. Incubation was performed at 37°C for 2 h. Following transcription, the mixture was heated and slowly cooled so as to allow the full-length in vitro transcripts to anneal to the immobilized oligonucleotide. Using an automated 96-channel pipetter equipped with a washing station and a magnetic particle collector, the captured transcript was washed twice with 5 M NH4Cl and once with 100 mM (NH4)3-citrate. The beads were finally resuspended in 10 μL of 30 mM (NH4)3-citrate containing an appropriate amount of RNase (Roche Diagnostics) and incubated at 37°C for about 30 min to digest the transcripts to completion.
Homogeneous Format
The protocol has been described in detail elsewhere (Hartmer et al. 2003). Briefly, following transcription, typically a 4-μL reaction, RNase is added to cleave the in vitro transcript. The mixture is then further diluted with H2O to a final volume of 27 μL. Finally, conditioning of the phosphate backbone is achieved by the addition of 6 mg CLEAN Resin (SEQUENOM).
MassEXTEND Assay
Candidate SNPs identified with base-specific cleavage were verified by means of a mini-sequencing reaction that is analyzed by MALDI-TOF-MS (MassEXTEND; SEQUENOM). The method was as described (Little et al. 1997; Rodi et al. 2002).
Mass Spectrometry Measurements
Fifteeen nl of the cleavage reactions was robotically dispensed onto silicon chips preloaded with matrix (SpectroCHIP; SEQUENOM). Mass spectra were collected using a MassARRAY mass spectrometer (Bruker-SEQUENOM).
Identification of SNPs
The mass spectra were further processed and analyzed by proprietary software for baseline correction, peak identification, and calibration. The software further compares each spectrum with the peak list predicted for the reference sequence and automatically identifies all of the possible single-nucleotide sequence variations that can account for an observed spectral change, that is, a fragment that either appears or disappears. From this, a list of candidate SNPs was assembled manually by examining the consistency among the complementary cleavage reactions and/or the recurrence of an indicative fragment in the sample set.
Simulations
A computational simulation analysis was performed to determine the success rate of the method for the identification of SNPs. The simulation software generates the theoretical mass fingerprints of a given reference sequence and identifies all of the detectable spectral changes associated with all possible single-nucleotide changes. The quantitative aspect of a mass spectrum (i.e., peak heights) was not taken into account in the present simulation study, and only the fragments that either appear or disappear as a result of the mutation, given certain settings for the resolution and the upper and lower detection boundary, were considered. The obtained table is than queried and the mutational changes classified depending on whether they can be detected, characterized, and mapped. Detection requires the presence of at least one diagnostic spectral change. Characterization implies that the spectral changes allow the deduction of the nature of the reference and substitute base; that is, no sequence variation of another nature, at either the same or a different position, yields the same spectral changes. Unambiguous mapping requires that no sequence variations at another position, of the same or a different nature, yield the same set of spectral changes. The simulations were performed on the ∼64-kb gene encoding Neural Wiskott-Aldrich Syndrome Protein (gene ENSG00000106299; http://www.ensembl.org).
Acknowledgments
We thank Dr. Charles Cantor for valuable discussions and Gabi Sperling and Julia Clemens for expert technical assistance.
The publication costs of this article were defrayed in part by payment of page charges. This article must therefore be hereby marked “advertisement” in accordance with 18 USC section 1734 solely to indicate this fact.
Article and publication are at http://www.genome.org/cgi/doi/10.1101/gr.1692304.
References
- Altshuler, D., Pollara, V.J., Cowles, C.R., Van Etten, W.J., Baldwin, J., Linton, L., and Lander, E.S. 2000. An SNP map of the human genome generated by reduced representation shotgun sequencing. Nature 407: 513-516. [DOI] [PubMed] [Google Scholar]
- Bansal, A., van den Boom, D., Kammerer, S., Honisch, C., Adam, G., Cantor, C.R., Kleyn, P., and Braun, A. 2002. Association testing by DNA pooling: An effective initial screen. Proc. Natl. Acad. Sci. 99: 16871-16874. [DOI] [PMC free article] [PubMed] [Google Scholar]
- Böcker S. 2003. SNP and mutation discovery using base-specific cleavage and MALDI-TOF mass spectrometry. Bioinformatics (Suppl.) 19: 44-53. [DOI] [PubMed] [Google Scholar]
- Buetow, K.H., Edmonson, M., MacDonald, R., Clifford, R., Yip, P., Kelley, J., Little, D.P., Strausberg, R., Koester, H., Cantor, C.R., et al. 2001. High-throughput development and characterization of a genome-wide collection of gene-based single nucleotide polymorphism markers by chip-based matrix-assisted laser desorption/ionization time-of-flight mass spectrometry. Proc. Natl. Acad. Sci. 98: 581-584. [DOI] [PMC free article] [PubMed] [Google Scholar]
- Chee, M., Yang, R., Hubbell, E., Berno, A., Huang, X.C., Stern, D., Winkler, J., Lockhart, D.J., Morris, M.S., and Fodor, S.P. 1996. Accessing genetic information with high-density DNA arrays. Science 274: 610-614. [DOI] [PubMed] [Google Scholar]
- Cotton, R.G., Rodrigues, N.R., and Campbell, R.D. 1988. Reactivity of cytosine and thymine in single-base mismatches with hydroxylamine and osmium tetroxide and its application to the study of mutations. Proc. Natl. Acad. Sci. 85: 4397-4401. [DOI] [PMC free article] [PubMed] [Google Scholar]
- Elso, C., Toohey, B., Reid, G.E., Poetter, K., Simpson, R.J., and Foote, S.J. 2002. Mutation detection using mass spectrometric separation of tiny oligonucleotide fragments. Genome Res. 12: 1428-1433. [DOI] [PMC free article] [PubMed] [Google Scholar]
- Forrest, S. and Cotton, R.G. 1990. Methods of detection of single base substitutions in clinical genetic practice. Mol. Biol. Med. 7: 451-459. [PubMed] [Google Scholar]
- Gibbs, R.A., Nguyen, P.N., McBride, L.J., Koepf, S.M., and Caskey, C.T. 1989. Identification of mutations leading to the Lesch-Nyhan syndrome by automated direct DNA sequencing of in vitro amplified cDNA. Proc. Natl. Acad. Sci. 86: 1919-1923. [DOI] [PMC free article] [PubMed] [Google Scholar]
- Glavac, D. and Dean, M. 1995. Applications of heteroduplex analysis for mutation detection in disease genes. Hum. Mutat. 6: 281-286. [DOI] [PubMed] [Google Scholar]
- Hacia, J.G. 1999. Resequencing and mutational analysis using oligonucleotide arrays. Nat. Genet. 21: 42-47. [DOI] [PubMed] [Google Scholar]
- Hacia, J.G., Brody, L.C., Chee, M.S., Fodor, S.P.A., and Collins, F.S. 1996. Detection of heterozygous mutations in BRCA1 using high density oligonucleotide arrays and two-colour fluorescence analysis. Nat. Genet. 14: 441-447. [DOI] [PubMed] [Google Scholar]
- Hartmer, R., Storm, N., Boecker, S., Rodi, C.P., Hillenkamp, F., Jurinke, C., and van den Boom, D. 2003. RNase T1 mediated base-specific cleavage and MALDI-TOF MS for high-throughput comparative sequence analysis. Nucleic Acids Res. 31: e47. [DOI] [PMC free article] [PubMed] [Google Scholar]
- Kirpekar, F., Douthwaite, S., and Roepstorff, P. 2000. Mapping posttranscriptional modifications in 5S ribosomal RNA by MALDI mass spectrometry. RNA 6: 296-306. [DOI] [PMC free article] [PubMed] [Google Scholar]
- Krebs, S., Medugorac, I., Seichter, D., and Förster, M. 2003. RNaseCut: A MALDI mass spectrometry-based method for SNP Discovery. Nucleic Acids Res. 31: e37. [DOI] [PMC free article] [PubMed] [Google Scholar]
- Kwok, P.Y., Carlson, C., Yager, T.D., Ankener, W., and Nickerson, D.A. 1994. Comparative analysis of human DNA variations by fluorescence-based sequencing of PCR products. Genomics 23: 138-144. [DOI] [PubMed] [Google Scholar]
- Lander, E.S. 1996. The new genomics: Global view of biology. Science 274: 536-539. [DOI] [PubMed] [Google Scholar]
- Little, D.P., Braun, A., O'Donnell, M.J., and Köster, H. 1997. Mass spectrometry from miniaturized arrays for full comparative DNA analysis. Nature Med. 3: 1413-1416. [DOI] [PubMed] [Google Scholar]
- McCarthy, J.J. and Hilfiker, R. 2000. The use of single-nucleotide polymorphism maps in pharmacogenomics. Nat. Biotechnol. 18: 505-508. [DOI] [PubMed] [Google Scholar]
- Mohlke, K.L., Erdos, M.R., Scott, L.J., Fingerlin, T.E., Jackson, A.U., Silander, K., Hollstein, P., Boehnke, M., and Collins, F.S. 2002. High-throughput screening for evidence of association by using mass spectrometry genotyping on DNA pools. Proc. Natl. Acad. Sci. 99: 16928-16933. [DOI] [PMC free article] [PubMed] [Google Scholar]
- Mullikin, J.C., Hunt, S.E., Cole, C.G., Mortimore, B.J., Rice, C.M., Burton, J., Matthews, L.H., Pavitt, R., Plumb, R.W., and Sims, S.K. 2000. An SNP map of human chromosome 22. Nature 407: 516-520. [DOI] [PubMed] [Google Scholar]
- Myers, R.M., Larin, Z., and Maniatis, T. 1985. Detection of single base substitutions by ribonuclease cleavage at mismatches in RNA: DNA duplexes. Science 230: 1242-1246. [DOI] [PubMed] [Google Scholar]
- Nickerson, D.A., Tobe, V.O., and Taylor, S.L. 1997. PolyPhred: Automating the detection and genotyping of single nucleotide substitutions using fluorescence-based resequencing. Nucleic Acids Res. 25: 2745-2751. [DOI] [PMC free article] [PubMed] [Google Scholar]
- O'Donovan, M.C., Oefner, P.J., Roberts, S.C., Austin, J., Hoogendoorn, B., Guy, C., Speight, G., Upadhyaya, M., Sommer, S.S., and McGuffin, P. 1998. Blind analysis of denaturing high-performance liquid chromatography as a tool for mutation detection. Genomics 52: 44-49. [DOI] [PubMed] [Google Scholar]
- Orita, M., Iwahana, H., Kanazawa, H., Hayashi, K., and Sekiya, T. 1989. Detection of polymorphisms of human DNA by gel electrophoresis as single-strand conformation polymorphisms. Proc. Natl. Acad. Sci. 86: 2766-2770. [DOI] [PMC free article] [PubMed] [Google Scholar]
- Patil, N., Berno, A.J., Hinds, D.A., Barrett, W.A., Doshi, J.M., Hacker, C.R., Kautzer, C.R., Lee, D.H., Marjoribanks, C., McDonough, D.P., et al. 2001. Blocks of limited haplotype diversity revealed by high-resolution scanning of human chromosome 21. Science 294: 1719-1723. [DOI] [PubMed] [Google Scholar]
- Risch, N. and Merikangas, K. 1996. The future of genetic studies of complex human diseases. Science 273: 1516-1517. [DOI] [PubMed] [Google Scholar]
- Rodi, C.P., Darnhofer-Patel, B., Stanssens, P., Zabeau, M., and van den Boom, D. 2002. A strategy for the rapid discovery of disease markers using the MassARRAY system. BioTechniques 32: S62-S69. [PubMed] [Google Scholar]
- Sheffield, V.C., Cox, D.R., Lerman, L.S., and Myers, R.M. 1989. Attachment of a 40-base-pair G+C-rich sequence (GC-clamp) to genomic DNA fragments by the polymerase chain reaction results in improved detection of single-base changes. Proc. Natl. Acad. Sci. 86: 232-236. [DOI] [PMC free article] [PubMed] [Google Scholar]
- Sousa, R. and Padilla, R. 1995. A mutant T7 RNA polymerase as a DNA polymerase. EMBO J. 14: 4609-4621. [DOI] [PMC free article] [PubMed] [Google Scholar]
- Youil, R., Kemper, B.W., and Cotton, R.G. 1995. Screening for mutations by enzyme mismatch cleavage with T4 endonuclease VII. Proc. Natl. Acad. Sci. 92: 87-91. [DOI] [PMC free article] [PubMed] [Google Scholar]
- Zabeau, M. and Stanssens, P. 2000. Diagnostic sequencing by a combination of specific cleavage and mass spectrometry. Patent Application No. PCT/EP0003904.2.