Abstract
The EnsMart system (www.ensembl.org/EnsMart) provides a generic data warehousing solution for fast and flexible querying of large biological data sets and integration with third-party data and tools. The system consists of a query-optimized database and interactive, user-friendly interfaces. EnsMart has been applied to Ensembl, where it extends its genomic browser capabilities, facilitating rapid retrieval of customized data sets. A wide variety of complex queries, on various types of annotations, for numerous species are supported. These can be applied to many research problems, ranging from SNP selection for candidate gene screening, through cross-species evolutionary comparisons, to microarray annotation. Users can group and refine biological data according to many criteria, including cross-species analyses, disease links, sequence variations, and expression patterns. Both tabulated list data and biological sequence output can be generated dynamically, in HTML, text, Microsoft Excel, and compressed formats. A wide range of sequence types, such as cDNA, peptides, coding regions, UTRs, and exons, with additional upstream and downstream regions, can be retrieved. The EnsMart database can be accessed via a public Web site, or through a Java application suite. Both implementations and the database are freely available for local installation, and can be extended or adapted to `non-Ensembl' data sets.
Databases of biological information have become a major driving force behind biological research. Many scientists have begun to shift their analyses away from the traditional, single-gene focus towards a genomic focus involving one or more organisms. Such data tend to be voluminous. Efficient, flexible, and scalable solutions are required to facilitate access to these data in a rapid and interactive manner.
Since the 1990s, data warehousing techniques have been used to handle large quantities of data. There are many examples of successful implementations in commercial organizations (Devlin 1997). However, such designs tend to be focused on numerical data, and are not easily applicable to biological data, which is primarily descriptive. In addition, the data cleansing and processing techniques generally used in data warehousing are not sufficient for the management of biological data, which requires a high level of domain-specific knowledge. Consequently, connecting information coming from disparate biological resources and reconciling frequently conflicting data in an efficient, scalable way have proven to be a major challenge.
The majority of biological databases are designed to facilitate the unambiguous storage and update of large amounts of data, and so by necessity have complex normalized schemas, which are specific for a given type of data. Consequently, largescale querying of the stored data is computationally expensive, must be designed specifically for a given database, and requires domain-specific software solutions. This represents a significant challenge for easy interrogation of existing data, and integration of additional data.
Described here is EnsMart, a system capable of organizing data from individual databases into one query-optimized system, using a data warehousing technique specifically designed for descriptive data. The system is based on the principle of creating a generic system from specific data sources, where disparate data can be integrated and interrogated in a flexible, efficient, unified, and domain-independent manner. The key features of this solution are scalability for large amounts of data, rapid and flexible data access, support for easy integration with third-party data and/or programs, and intuitive user interfaces. The solution is generic, and can be adapted to any database containing descriptive data, including but not limited to other biological databases.
In this paper, we describe the application of EnsMart to Ensembl databases. Ensembl is a typical example of a large biological resource. It provides a consistent genomic annotation across a variety of metazoan genomes, using a sophisticated, automated pipeline system for high-quality gene prediction and crossspecies analyses (Hubbard et al. 2002; Clamp et al. 2003). The amount of data stored in Ensembl is growing rapidly, and currently includes genomic annotation for nine species, distributed in numerous databases. EnsMart extends Ensembl genomic browser capabilities and allows for fast and flexible querying of this information-rich, genomic resource. The EnsMart system can be installed locally as a database, a stand-alone Web site, or a Java application suite. All software and data included in the project are freely available.
RESULTS
Data
The present implementation of the EnsMart system is built on the data in the Ensembl genome databases, extended with additional data sets. The data fall into three broad categories: genomic annotation (relating predominantly to genes and single nucleotide polymorphisms [SNPs]), functional annotation, and expression. All nine of the species in Ensembl are represented in EnsMart (currently Homo sapiens, Mus musculus, Rattus norvegicus, Danio rerio, Fugu rubripes, Anopheles gambiae, Drosophila melanogaster, Caenorhabditis briggsae, and Caenorhabditis elegans). In addition to Ensembl-generated data and the external data that are imported by Ensembl, for instance dbSNP, annotations for Drosophila melanogaster, Caenorhabditis elegans, and manually curated Vega genes (www.vega.sanger.ac.uk), the EnsMart database also includes Genomics Institute of the Novartis Research Foundation (GNF) and EST-based expression data sets accessible through a controlled expression vocabulary (eVOC; Kelso et al. 2003). A full listing of the data sets is given in Table 1. The cross-species analyses are listed in Table 2, and all external cross-references are listed in Table 3.
Table 1.
Data Sets in EnsMart An `(F)' Indicates Focus Data Set
| Species | Category | Data set | Primary source |
|---|---|---|---|
| Homo sapiens | Genomic | Ensembl genes (F) | Ensembl |
| EST genes (F) | Ensembl | ||
| Vega genes (F) | VEGA | ||
| SNP (F) | dbSNP/HGVbase | ||
| Markers | UCSC | ||
| Disease | OMIM morbid map | OMIM | |
| Expression | eVOC | SANBI | |
| GNF | Novartis | ||
| EST | dbEST | ||
| Protein annotation | InterPro | Ensembl | |
| Pfam | Ensembl | ||
| Prosite | Ensembl | ||
| PRINTS | Ensembl | ||
| PROFILE | Ensembl | ||
| FAMILY clusters | Ensembl | ||
| Mus musculus | Genomic | Ensembl genes (F) | Ensembl |
| EST genes (F) | Ensembl | ||
| SNP (F) | dbSNP | ||
| Markers | MGI | ||
| Protein annotation | As for Homo sapiens | Ensembl | |
| Rattus norvegicus | Genomic | Ensembl genes (F) | Ensembl |
| EST genes (F) | Ensembl | ||
| SNP (F) | MDC | ||
| Markers | RMR/WTCHG | ||
| Disease | QTL | RGD | |
| Protein annotation | As for Homo sapiens | Ensembl | |
| Caenorhabditis elegans | Genomic | WormBase Genes (F) | AceDB |
| Protein annotation | As for Homo sapiens | Ensembl | |
| Caenorhabditis briggsae | Genomic | Ensembl genes (F) | Ensembl |
| Protein annotation | As for Homo sapiens | Ensembl | |
| Danio rerio | Genomic | Ensembl genes (F) | Ensembl |
| Markers | EMBL STS | ||
| Protein annotation | As for Homo sapiens | Ensembl | |
| Fugu rubripes | Genomic | Ensembl genes (F) | IMCB |
| Protein annotation | As for Homo sapiens | Ensembl | |
| Anopheles gambiae | Genomic | Ensembl genes (F) | Ensembl |
| SNP (F) | Ensembl | ||
| Markers | Anobase | ||
| Protein annotation | As for Homo sapiens | Ensembl | |
| Drosophila melanogaster | Genomic | FlyBase genes (F) | FlyBase |
| Protein annotation | As for Homo sapiens | Ensembl |
Table 2.
Homolog and Conserved Region Data Available in EnsMart
| Species | Hs | Mm | Rn | Ce | Cb | Dr | Fr | Ag | Dm |
|---|---|---|---|---|---|---|---|---|---|
| Hs | HU | HU | H | H | |||||
| Mm | HU | HU | H | H | |||||
| Rn | HU | HU | H | H | |||||
| Dr | H | H | H | H | |||||
| Fr | H | H | H | H | |||||
| Ce | HU | ||||||||
| Cb | HU | ||||||||
| Ag | H | ||||||||
| Dm | H |
H, homolog pairs; U, conserved upstream regions; Hs, Homo sapiens; Mm, Mus musculus; Rn, Rattus norvegicus; Dr, Danio rerio; Fr, Fugu rubripes; Ce, Caenorhabditis elegans; Cb, Caenorhabditis briggsae; Ag, Anopheles gambiae; Dr, Drosophila melanogaster.
Table 3.
External Identifiers in EnsMart
| Microarray identifiers mapped by direct DNA/DNA sequence mapping | ||||||
| UMCU_Hsapiens_19Kv1 | AFFY_MG_U74v2 | AFFY_RT_U34 | Sanger_Mver1_1_1 | |||
| AFFY_HG_U133 | AFFY_Mu11Ksub | AFFY_RAE230 | ||||
| AFFY_HG_U95 | AFFY_RG_U34 | AFFY_MOE430 | ||||
| AFFY_MG_U74 | AFFY_RN_U34 | Sanger_Hver1_2_1 | ||||
| Gene/protein identifiers mapped by protein/protein mapping | ||||||
| SWISSPROT | SPTrEMBL | RefSeq | ||||
| Mappings derived by cross-referencing of identifiers | ||||||
| Anopheles_paper | EMBL | LocusLink | wormbase_pseudogene | |||
| Anopheles_symbol | flybase_gene | MarkerSymbol | ZFIN | |||
| BRIGGSAE_HYBRID | flybase_symbol | MIM | ZFIN_ID | |||
| Celera_Gene | flybase_transcript | PDB | ZFIN_AC | |||
| Celera_Pep | GKB | protein_id | ||||
| Celera_Trans | GO | wormbase_gene | ||||
| drosophila_gene_id | HUGO | wormbase_transcript | ||||
| DROS_ORTH | InterPro | wormpep_id | ||||
The EnsMart data are organized around central objects—foci (currently gene and SNP). The rest of the data is presented in relation to the above objects. It can be retrieved as additional annotations (e.g., Interpro descriptions), provide query criteria for the retrieval of those objects (e.g., markers) or both (e.g., diseases). From this perspective the system can be described as being focus-centric, that is, in the current implementation, gene and SNP-centric. The system could be extended to include additional foci.
User Interfaces
All of the data contained in EnsMart can be queried through simple and intuitive user interfaces: MartView (Web site), MartExplorer (stand-alone GUI application), and MartShell (text-based application). A development release of MartShell is available at the time of this writing, and MartExplorer will be released shortly.
MartView
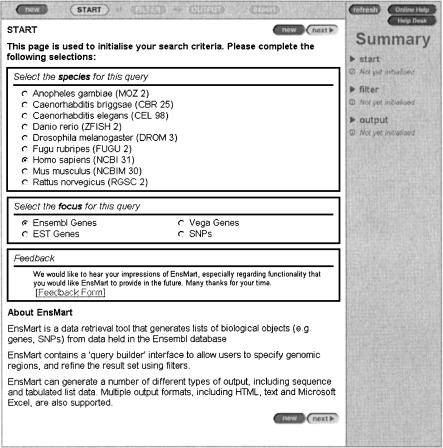
MartView implements the user-input abstractions using a “wizard” interface (Figs. 1, 2, 3, 4). Users navigate through a series of pages, each designed to gather input for one of the three required userinput abstractions. Each step is described in detail in a readily available online help window. Certain attributes, such as sequences, gene structure information, and SNP data are functionally separated from the other attributes to facilitate easier grouping of reasonable queries, and efficient server response. Finally, the user selects the output format, and exports the data. Throughout the process, the user interface provides feedback on the number of items that have been selected.
Figure 1.
MartView start page showing available species and foci. The availability of a particular focus depends on species. Eachavailable species is designated withan assembly version.
Figure 2.
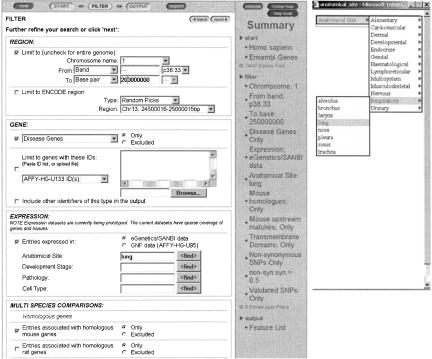
MartView filter page showing some of the available filters. A wide range of filter types can be applied, in any combination. The system supports batch querying, and a set of external identifiers can be uploaded directly from a file. A summary table provides feedback on the number of items that pass the currently selected filters, allowing users to modify their searches in an interactive way. The additional window shows the tool for finding terms in the expression vocabulary.
Figure 3.
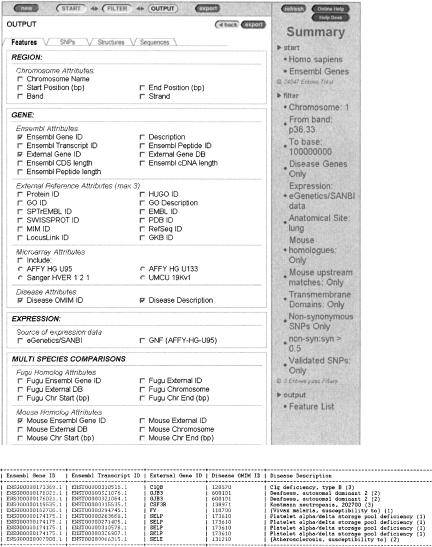
MartView output page and an example of a corresponding output in HTML format. `Tabs' at the top show the output topics available: With a gene focus as shown here, one chooses between features, SNPs, genomic structures, and sequences. A full description of eachoption is available in the online help. `Features' has been selected, and most of the available data types are shown.
Figure 4.
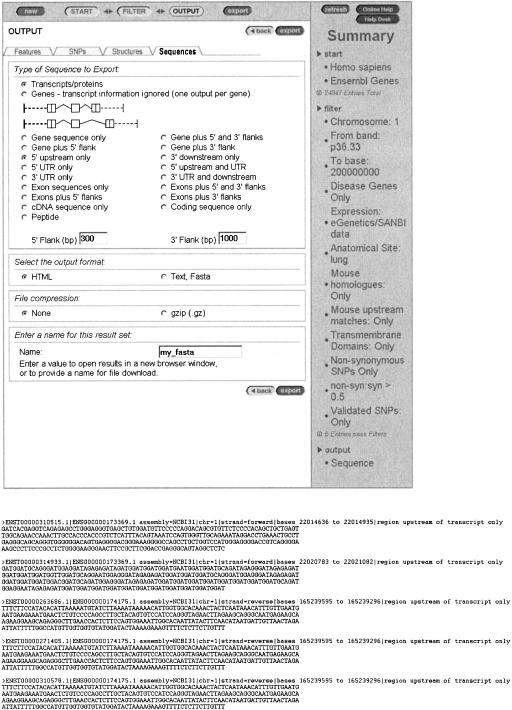
MartView output page showing the range of sequence retrieval options (human gene focus, sequences tab). An example of the corresponding FASTA output is also shown. The gene sequence options include gene sequence, gene withflanking sequence, upstream or downstream sequences of user-specified length, exons, transcripts, and coding sequence only. The user is guided by a graphical representation of sequence options.
MartExplorer
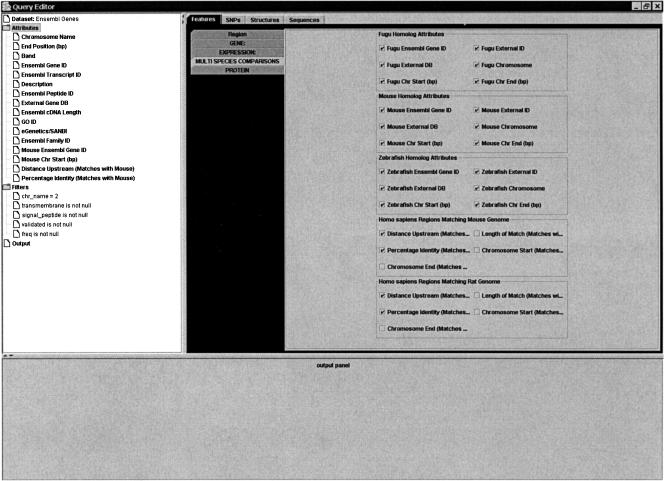
MartExplorer follows the same query logic and supports all the functionality described above and takes advantage of the interactivity available in a desktop application. It represents the query as a tree graphical user interface (GUI) component (Fig. 5). As users click on each node of the tree, they are presented with input fields for the data required for that part of the query. As filters and attributes are chosen, they are moved onto the tree below their respective nodes. Thus, the user has a single, interactive view of an entire query. Once all required data have been provided, the output format is chosen and the results are viewed or exported. The MartExplorer GUI benefits from speed and scalable representation of query navigation, which are more easily achieved through a desktop application.
Figure 5.
MartExplorer GUI implementing user abstractions using a modified tree. As users click on each node of the tree, they are presented with input fields for the data required for that part of the query. As filters and attributes are chosen, they are moved onto the tree below their respective nodes, giving the user a single, interactive view of an entire query (shown on the left). Once all required data have been provided, the output format is chosen and the results are exported.
MartShell
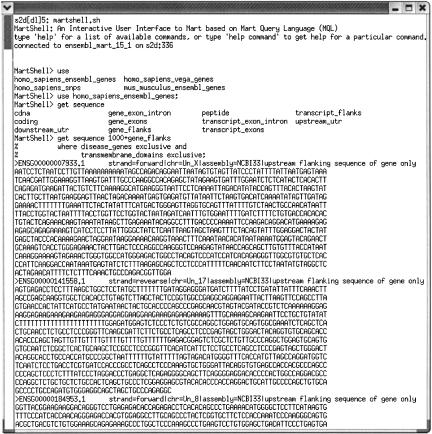
MartShell uses a query language specifically designed to facilitate mart queries (Fig. 6). Queries can be submitted from the command line individually or batched in a script file. There is also an interactive mode allowing users to submit queries to the mart using a shell interface. The interactive mode supports command completion, and commandline history functions. It also provides users with the ability to use EnsMart data in a pipeline of analysis applications.
Figure 6.
Screenshot of an interactive MartShell session. Upon entering the interactive session, the user types `use' and then hits the tab key twice to get a list of possible data sets available. She chooses the data set, then begins to type a query. After typing `get sequence', she hits the tab key twice to get a list of possible sequences available, then completes her query for 1000 bp of upstream gene flanking sequence for all genes that are both disease genes and transmembrane domains.
Query Organization
The querying of EnsMart data through MartView and MartExplorer is organized into three steps: start, filter, and output. Below is a detailed description of each step, using MartView as an example.
Start
The start stage includes the initial selection of the species and focus for the query. Currently the database contains nine species and four foci (Ensembl genes, EST genes, Vega genes, and SNPs). Each species is designated with its genome assembly version (Fig. 1).
Filter
The filter stage allows the user to limit the initial search to a subset with particular characteristics (Fig. 2). A wide range of filter types can be applied, in any combination. The system supports batch querying, and a set of external identifiers can be uploaded directly from a file. These then act as an external filter, allowing rapid cross-referencing of large numbers of external identifiers and association of items in the set with corresponding genomic annotation and sequences. The region filter allows a search to be carried out on the full genome, on a single chromosome, or on a portion of a chromosome (as determined by markers, bands, or base pairs). The availability of other filter options depends on the data content for a particular species and focus. For gene foci, multispecies filters can limit the selection of genes to those associated with homologs in other species, or with an upstream region that is conserved between species. Further filters allow restriction to a particular gene type (e.g., novel genes or disease genes) or to genes that have been mapped to a particular external id set (e.g., Affymetrix, EMBL, Gene Ontology [GO], or HUGO identifiers). Searches can also be limited to genes with protein products possessing particular features, such as the presence of a transmembrane domain, signal sequence, or other domain specified using identifiers from domain databases. Access to expression data stored in EnsMart is provided via the eVOC controlled expression vocabulary. Currently two data sets can be accessed in this way: the GNF microarray data set, and EST-derived expression data. Finally, one can restrict searches to genes with SNPs in particular regions (e.g., coding or UTR), or to genes that have nonsynonymous SNPs.
The SNP focus allows whole-genome or regional querying of SNPs mapped to a particular species' genome. SNPs can be filtered to include only those that have been validated, or those with external TSC or HGVBASE ids. In addition, SNPs with allele frequency data from a particular geographical divided population, or all available populations, can be selected. Finally, SNPs mapping to upstream regions, UTRs, coding regions, or introns of genes can be selected. SNPs present in coding regions can be further filtered regarding whether they are synonymous, nonsynonymous, or stop SNPs. Throughout the process of filter selection, a summary table provides feedback on the number of items that pass the currently selected filters, allowing users to modify their searches in an interactive way.
Output
At the final output stage, the data that are available regarding the set of items that pass the filters are organized into a number of topics, reflecting the kinds of data that are most likely to be required in different types of analyses (Fig. 3). Again, the topics available will depend on the species and focus. For example, with a gene focus you choose between “features,” gene “structures,” “SNPs,” and “sequences.” Within gene “features,” the data types available correspond roughly to the types of filters described above. Thus, chromosomal location, identifiers from external databases, protein domain annotation, expression attributes, homologous genes in other species, and locations of conserved upstream regions are all available. The gene “structure” options include information about the genomic and transcript locations of exons, introns, and coding sequences, and the GTF output format is supported. The gene “SNPs” options include validation status, location and SNP type (e.g., coding, intronic, UTR, nonsynonymous) as well as data relating SNPs to gene function. For nonsynonymous SNPs, the peptide shift is available, and the ratio of synonymous to nonsynonymous SNPs within a gene can be shown. The gene “sequence” options include gene sequence, gene with flanking sequence, upstream or downstream sequences of user-specified length, exons, transcripts, and coding sequence only. The user is guided by a graphical representation of sequence options (Fig. 4). A variety of output formats are supported, including HTML, Microsoft Excel, a number of flat file formats, GTF, and FASTA.
Query Chaining
In addition to the functionality described above, it is also possible to chain individual queries. MartView allows file output from previous queries to be applied as filters. Although this approach extends the range of possible queries, it is admittedly rather tedious. A new, more intuitive and user-friendly implementation is planned in the future. An alternative solution is offered by MartShell, where this functionality is fully supported by the query language syntax.
DISCUSSION
The EnsMart database design and its application interfaces provide a powerful, flexible tool for the delivery of customized sets of biological data. It can be used in a wide variety of applications and scenarios, by users ranging from laboratory scientists to experienced bioinformaticians. Presented here is an application of this solution to Ensembl databases. The powerful combination of a generic, query-optimized tool and the consistent species-specific and interspecies annotation from Ensembl makes it possible to quickly solve previously difficult problems such as SNP selection for candidate gene profiling or the resolution of conflicts in microarray annotation. This is illustrated below by some typical EnsMart use cases.
Candidate gene SNP selection can be a very tedious task, requiring data retrieval from a number of resources; for example, SNPper (Riva and Kohane 2002) and dbSNP (Sherry et al. 1999, 2001; Smigielski et al. 2000), and considerable additional data processing. This kind of investigation can be greatly facilitated by the use of EnsMart. Typically, researchers working on a positional cloning project will have narrowed down their search for the disease gene to a region of interest on the genome. In addition, they may have some knowledge of which tissues the causative gene is expected to be expressed in, and what its potential function may be. The EnsMart region, expression, and protein filters can be used to define such a query, and greatly narrow down the list of potential genes that would have to be screened. For example, a locus for autosomal dominant retinitis pigmentosa was originally mapped to 3q21 (McWilliam et al. 1989). Using EnsMart with the Ensembl gene set based on the NCBI 31 assembly, a list of 96 candidates can be identified in this region, with 25 having retinal expression as assessed from EST-derived data. Exporting the GO description data for these candidates immediately reveals one potential candidate with a role in phototransduction, the RHO gene, which was the gene that was eventually shown to be mutated in the affected families (Rosenfeld et al. 1992). Following the identification of candidate disease genes, researchers often screen the known SNPs in these genes for variations showing an association with the disease. EnsMart allows quick identification of suitable SNPs to screen. For each of the candidate genes, the user can export a list of the SNP ids for that gene, and SNP attributes such as whether they are validated, their location in the transcript and coding sequence (CDS), and whether they are nonsynonymous (together with the associated amino acid change). To further enhance this functionality, we are currently introducing additional SNP options, including the identification of SNPs that are located in upstream regions conserved between species.
The consistent gene annotation provided by Ensembl facilitates quick and efficient interspecies comparisons using EnsMart. Currently, homologous gene pairs and the upstream regions that are conserved between species are stored for a number of species (Table 2). Thus, it is possible to execute a query such as “give me all the human genes with conserved upstream regions in mouse, and export a list of these genes, along with their mouse hofold, with the location of the upstream conserved regions.” As another example, one can select for human genes with a high ratio of nonsynonymous to synonymous sequence changes, find their orthologs in rat, mouse, and Fugu, and compare the ratios across all these species. Such a search quickly reveals possible candidates for genes under selection. The sequence export features of EnsMart will also allow identification of the upstream region sequences, enabling the researcher to import these sequences into a sequence alignment program and view them in more detail.
EnsMart provides easy methods to update and expand annotation associated with microarrays. Microarray reporters (sequences associated with microarray spots) tend to be designed and annotated on the basis of the sequence information that is publicly available at the time of their creation. Subsequently, the annotation associated with the sequence may be corrected or improved, and microarray users may want to access a wider range of information about the genes on which the microarray reports. The EnsMart project generates mappings of reporters to Ensembl and Vega genes for a number of popular microarray chips, by direct sequence alignment of the reporters with the transcript sequence (Table 3). It also contains cross-referencing between identifiers from a wide variety of public sequence repositories, and Ensembl and Vega identifiers (Table 3). Consequently, users can easily access the latest annotation relating to a gene assayed by a particular reporter. The reconciling of microarray annotation coming from different sources is a well known problem, and has prevented meaningful comparisons of the results obtained from different microarrays. The problem originates from the fact that the original annotations were generated using different methods. Adding further annotation purely on the basis of linking identifiers is likely to introduce even more confusion. EnsMart presents an attractive alternative to other Web-based resources for microarray annotation such as Resourcer at TIGR (Tsai et al. 2001), Source at Stanford (Diehn et al. 2003), and MatchMiner at NCBI (Bussey et al. 2003). Thanks to well defined gene models created either automatically (Ensembl) or manually (Vega), all reporters can be related to one common denominator—a consistent, genomic sequence-aligned set of genes. EnsMart maintains a rich set of reporters mapped to these gene sets, and facilitates rapid annotation. In this way the microarrays can be reannotated, providing a consistent, genomic sequence-verified set of annotations. Added benefits of EnsMart annotation include a rich variety of sequence retrieval options, plus the ability to integrate other sequence-based genomic data such as SNP effects, interspecies conserved regions, disease associations, and localization as quantitative trait loci (QTLs) in other species.
Another bioinformatic application of EnsMart is integration with third-party tools. An example of such integration is provided by the Web-based microarray experiment data-clustering tool Expression Profiler (Vilo et al. 2003). One end product of the clustering process is a list of identifiers of the reporters or genes in each cluster. Using the URL-based MartView Web query mechanism with the URL-map functionality of ExpressionProfiler, the user can download a prespecified data set for genes in the cluster, including attributes such as the upstream sequence of each transcript, in order to investigate possible common control elements in coexpressed genes. Alternatively, one can open a MartView interface window, already filled with the cluster's identifiers, in order to conduct ad hoc investigations into features the genes in the cluster have in common. Using the same mechanism, MIAMExpress, the Web-based annotation/submission tool for the ArrayExpress microarray public repository at EBI (Brazma et al. 2003), allows users to query EnsMart, and reannotate or update their array before submission. A Web form is provided to users to upload the spotter output file, and database identifiers are automatically extracted and entered in MartView. The output of the query can be downloaded in the standard format required by MIAMExpress (http://www.ebi.ac.uk/miamexpress).
The use cases discussed above by no means cover the whole scope of EnsMart: They only provide illustrative examples. The user interface combines ease of use with considerable power, and an enormous number of possible queries can be rapidly answered by the system. Some other genomic resources provide support for functionality that resembles some aspects of EnsMart. The most flexible among these, which are also based on relational databases, are Table Browser at UCSC (Kent et al. 2002; Karolchik et al. 2003), Penn State University's GALA (Giardine et al. 2003), RZPD's Genome-Matrix (http://www.rzpd.de/colBox/html/), and MapViewer at NCBI (www.ncbi.nlm.nih.gov). The UCSC Genome Browser is an example of a versatile genomic database combining the power of visualization and data browsing. The GALA database predominantly focuses on human/mouse alignments, and supports a broad range of queries related to genomic annotation for both species. In the Genome Matrix Web site, the information on genes and the different types of information are displayed as a matrix of colored boxes, with columns representing the different genes, and rows the different information types linked to the genes. MapViewer shows integrated views of chromosome maps for numerous organisms, and is a valuable tool for the identification and localization of genes, particularly those that contribute to diseases. However, those systems tend to be primarily Web-based, frequently large, and require a considerable effort to install externally.
An alternative integration solution for genomic data is presented by Distributed Annotation System (DAS), a Web service based on http protocol (Dowell et al. 2001). This approach is focused on data aggregation based on a common coordinate system. It presents an excellent solution for easy addition of external annotations to existing genomic browsers. However, DAS lacks the flexible query capabilities of EnsMart, and because it is network-based, it is unlikely to match the speed optimizations for large data sets, which is the crucial feature of the EnsMart solution. The Sequence Retrieval System (SRS) developed originally at EBI (Etzold and Argos 1993; Etzold et al. 1996; Zdobnov et al. 2002) uses flat file data aggregation based on linking of stable identifiers, and is capable of aggregating numerous sequence databases. It is, however, `unaware' of genomic assemblies, and consequently lacks the easy sequence navigation options, such as the retrieval of upstream sequence, that are included in EnsMart. In addition, the EnsMart data integration principle, based on genomic assemblies, allows for easy and rapid calculation, update, and storage of `value added,' secondary data such as possible SNP effects on gene function.
The present implementation of the EnsMart system is based on Ensembl databases with a few additional data sets. In the future, the system will be applied to a large set of publicly available data sources in order to provide a truly one-stop shop for biological investigations. Such a system will provide access to both local and remote `marts' through a single set of interfaces, supporting query chaining between individual data sets. A prototype version of the EnsMart system built on top of several EBI databases is currently undergoing final testing. Consequently, the future directions of EnsMart software development include more support for users who want to extend or adapt this system for external data sets. The extensions include a configuration editor, which will facilitate easy configuration of both EnsMart databases built from external data sets and fine-tuning of user interfaces to distributed EnsMart databases.
We believe the integrative approach presented here is an attractive alternative to the existing solutions and will become crucial to the further exploitation of biological data. We hope that the open data, software, and general design principles of EnsMart provide an excellent starting point for this field.
METHODS
System Architecture
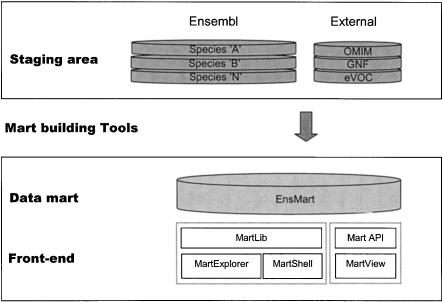
The EnsMart data system is based on the principle of creating a generic data system from specific data sources. This is achieved through capture and transformation of data from the collection of primary data sources (staging area) to the query-optimized EnsMart database (data mart). The staging area and the data mart are implemented in MySQL, and the transformation software (mart building tools) is written in Perl. The staging area databases and mart building tools are specific to the data and schemas of the source databases (Fig. 7).
Figure 7.
An overview of EnsMart architecture. The domain-specific staging area and mart building tools are shown at the top of the diagram; the domain-independent EnsMart database and user interfaces are shown at the bottom. The domain-independent part can be adapted to other data sets.
The end product of this process, the EnsMart system, consists of the data mart and front-end tools. The front-end tools have two implementations: a Web-based system, written in Perl, and stand-alone applications written in Java (Fig. 7). All software accessing the data mart is almost entirely domain-agnostic, and can handle any data with the same software. The exceptions to this rule are domain-specific extensions, for example the DNA sequence-handling logic, which is specific to genomic data.
Staging Area
In the current EnsMart implementation, the staging area comprises all of the Ensembl databases, containing both Ensembl-generated and imported data. In addition, a number of additional third-party databases and EnsMart-generated data are also included. The EnsMart-generated data consist chiefly of microarray reporters and expression mappings (Table 3).
Mart Building Software
The transformation phase involves extraction and transformation of data from individual schemas of staging area databases to a single query-optimized data mart schema. Transformation is achieved in a multistep process that involves creating a number of temporary tables. Several precalculation steps, including the transformation of various sequence coordinates into a unified chromosomal coordinate system, the determination of the type and potential effect of SNPs on proteins, and the summing of genomic component lengths to give overall lengths, are also performed during this phase. The mart building software responsible for this task is organized hierarchically and includes a top-level script that launches individual task-specific scripts. The software has been designed such that most of the table generating scripts can be run in parallel with as few dependencies between the individual scripts as possible.
Data Mart
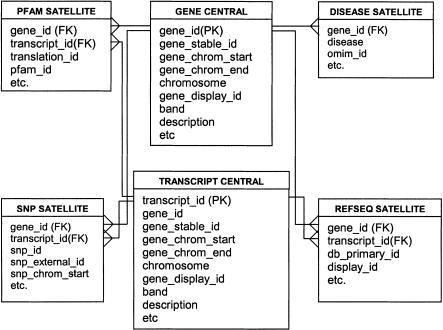
The EnsMart data are organized based on the concept of central biological objects (foci). Each of the biological objects (currently gene and SNP) on which a user can focus has its own constellation of satellite tables (Fig. 8). All data having one-to-one or many-to-one relations to a central object (focus) are stored in the central table, and the data having one-to-many or many-to-many relations to a central object are stored in the satellite tables. The dimension tables are `conformed' in that they join to more than one fact table (e.g., gene and transcript). This structure allows the central tables for a given fact constellation to have different granularities, and prevents row duplication in the results set. It also allows for the model to be easily extended, to include other central tables, including those with one-to-many relations to each other (e.g., protein).
Figure 8.
A diagram of the EnsMart `reversed star' schema.
The EnsMart database schema has been optimized for fast retrieval of large quantities of descriptive data. The design was derived from a warehouse star schema (Kimball et al. 1998), and its adaptation for descriptive data required that certain key characteristics of the classic star schema were `reversed' in the EnsMart implementation (Fig. 8). Thus, the relation of the tuples in the central (fact-like) table to those in the satellite (dimension-like) tables is one-to-many or in some cases many-to-many rather than many-to-one; the primary keys of the central table are the foreign keys in satellite tables, and the central tables are in general smaller than the satellite tables. Central table attributes are the source of all query constraints, as opposed to dimension tables in the classical star schema.
In addition to the `reversed star' components, the EnsMart schema includes meta tables, lookup tables for configuring the UI, map tables for mapping between external data and internal identifiers, and support tables for external data. One of the key features of the overall schema is modularity, which facilitates partial, species-specific, or focus-specific updates and downloads.
Front-End Tools Architecture
There are currently two types of front-end tools which make it possible to interact with EnsMart data: a Web-based software program written in Perl consisting of MartView and Mart API; and MartJ, a Java application suite consisting of MartExplorer (GUI) and MartShell (command-line tool and interactive shell). MartExplorer and MartShell are built on top of MartLib, a Java library. The key abstractions of user input in both the MartView and MartExplorer implementations are focus, filter, and attributes. These abstractions are domain-neutral and allow the system to be reused with other types of data. Users are responsible for choosing a focus biological object, any applicable filters with which to narrow down the biological objects returned by the query, and the attributes of those objects in which they are interested. MartShell can run in two modes: as a command-line tool or interactive shell. It uses a structured query language designed specifically for MartShell. Once the user input is provided using any of the above interfaces, the system automatically generates all of the structured query language (SQL) required to process the query.
EnsMart as an Extensible System
An important EnsMart design goal is to support extensions to the system through one of three avenues: the addition of user-specified data to existing EnsMart data, the integration of EnsMart software with other programs, or building EnsMart on top of other data sources.
Integrating EnsMart Data With External Data
EnsMart provides support for users who want to add their own fact and dimension tables. Such additional, user-defined data can be made available for querying and exporting via the front-end tools. Currently, this requires manual updates of the configuration file. We plan to make MartShell and MartExplorer capable of automatically discovering new database tables and making them available for querying. In this way, users can interrogate their own in-house data in the context of publicly available data from EnsMart. Users can map their own biological entities within existing mart foci or add an additional focus. Data can be mapped to an existing focus either by sequence similarity or as an `xref' sharing one or more of the many known database stable identifiers that are used to identify biological objects. Data meeting one of these criteria can be organized into a separate dimension table within the EnsMart data mart, using the stable identifier of the mapped EnsMart focus object as a foreign key. An additional focus can be added by mapping data to a particular sequence assembly coordinate system.
Integrating EnsMart With Other Programs
There are several ways in which external programs can be integrated with EnsMart. In most cases the program will access EnsMart data via either the MartLib library or by executing URL-based queries against MartView servers. Alternatively, third-party code could be plugged into MartJ to provide domain-specific functionality.
Building EnsMart From `Non-Ensembl' Data Sets
The system can readily be adapted for use with other data sets. The EnsMart database and front-end tools are domain-agnostic and can be adapted to store and query other data sets. This can be achieved by collecting the data sources in a staging area and writing appropriate mart building tools to populate the data mart as in the implementation described here. In cases where this is not practical (e.g., due to a different relational database management system [RDBMS]), the alternative is to first extract data into a flat file format, and then parse them directly into data mart. Any additional, domain-specific extensions that are required can then be added to the system.
Acknowledgments
EnsMart is principally funded by the Wellcome Trust with additional funding from EMBL. P.R.S. acknowledges support for the ArrayExpress project from the European Commission (TEMBLOR/DESPRAD). We thank the following for providing data sets: South African National Bioinformatics Institute (SANBI) and Electric Genetics, Genomics Institute of the Novartis Research Foundation (GNF), Affymetrix, and the Microarray Informatics Team at the Sanger Institute. We gratefully acknowledge contributions and continuous support from the other members of the Ensembl team and the suggestions and feedback from EnsMart users.
The publication costs of this article were defrayed in part by payment of page charges. This article must therefore be hereby marked “advertisement” in accordance with 18 USC section 1734 solely to indicate this fact.
Article and publication are at http://www.genome.org/cgi/doi/10.1101/gr.1645104.
References
- Brazma, A., Parkinson, H., Sarkans, U., Shojatalab, M., Vilo, J., Abeygunawardena, N., Holloway, E., Kapushesky, M., Kemmeren, P., Lara, G.G., et al. 2003. ArrayExpress—A public repository for microarray gene expression data at the EBI. Nucleic Acids Res. 31: 68-71. [DOI] [PMC free article] [PubMed] [Google Scholar]
- Bussey, K.J., Kane, D., Sunshine, M., Narasimhan, S., Nishizuka, S., Reinhold, W.C., Zeeberg, B., Ajay, W., and Weinstein, J.N. 2003. MatchMiner: A tool for batch navigation among gene and gene product identifiers. Genome Biol. 4: R27. [DOI] [PMC free article] [PubMed] [Google Scholar]
- Clamp, M., Andrews, D., Barker, D., Bevan, P., Cameron, G., Chen, Y., Clark, L., Cox, T., Cuff, J., Curwen, V., et al. 2003. Ensembl 2002: Accommodating comparative genomics. Nucleic Acids Res. 31: 38-42. [DOI] [PMC free article] [PubMed] [Google Scholar]
- Devlin, B. 1997. Data warehouse. From architecture to implementation, chapter 2. Addison Wesley Longman, Inc., Reading, MA.
- Diehn, M., Sherlock, G., Binkley, G., Jin, H., Matese, J.C., Hernandez-Boussard, T., Rees, C.A., Cherry, J.M., Botstein, D., Brown, P.O., et al. 2003. SOURCE: A unified genomic resource of functional annotations, ontologies, and gene expression data. Nucleic Acids Res. 31: 219-223. [DOI] [PMC free article] [PubMed] [Google Scholar]
- Dowell, R.D., Jokerst, R.M., Day, A., Eddy, S.R., and Stein, L. 2001. The Distributed Annotation System. BMC Bioinformatics 2: 7. [DOI] [PMC free article] [PubMed] [Google Scholar]
- Etzold, T. and Argos, P. 1993. SRS—An indexing and retrieval tool for flat file data libraries. Comput. Appl. Biosci. 9: 49-57. [DOI] [PubMed] [Google Scholar]
- Etzold, T., Ulyanov, A., and Argos, P. 1996. SRS: Information retrieval system for molecular biology data banks. Methods Enzymol. 266: 114-128. [DOI] [PubMed] [Google Scholar]
- Giardine, B., Elnitski, L., Riemer, C., Makalowska, I., Schwartz, S., Miller, W., and Hardison, R.C. 2003. GALA, a database for genomic sequence alignments and annotations. Genome Res. 13: 732-741. [DOI] [PMC free article] [PubMed] [Google Scholar]
- Hubbard, T., Barker, D., Birney, E., Cameron, G., Chen, Y., Clark, L., Cox, T., Cuff, J., Curwen, V., Down, T., et al. 2002. The Ensembl genome database project. Nucleic Acids Res. 30: 38-41. [DOI] [PMC free article] [PubMed] [Google Scholar]
- Karolchik, D., Baertsch, R., Diekhans, M., Furey, T.S., Hinrichs, A., Lu, Y.T., Roskin, K.M., Schwartz, M., Sugnet, C.W., Thomas, D.J., et al. 2003. The UCSC Genome Browser Database. Nucleic Acids Res. 31: 51-54. [DOI] [PMC free article] [PubMed] [Google Scholar]
- Kelso, J., Visagie, J., Theiler, G., Christoffels, A., Bardien-Kruger, S., Smedley, D., Otgaar, D., Greyling, G., Jongeneel, V., McCarthy, M., et al. 2003. eVOC: A controlled vocabulary for gene expression data. Genome Res. 13: 1222-1230. [DOI] [PMC free article] [PubMed] [Google Scholar]
- Kent, W.J., Sugnet, C.W., Furey, T.S., Roskin, K.M., Pringle, T.H., Zahler, A.M., and Haussler, D. 2002. The human genome browser at UCSC. Genome Res. 12: 996-1006. [DOI] [PMC free article] [PubMed] [Google Scholar]
- Kimball, R., Reeves, L., Ross, M., and Thornthwaite, W. 1998. The data warehouse lifecycle toolkit, chapter 5. J. Wiley, New York.
- McWilliam, P., Farrar, G.J., Kenna, P., Bradley, D.G., Humphries, M.M., Sharp, E.M., McConnell, D.J., Lawler, M., Sheils, D., Ryan, C., et al. 1989. Autosomal dominant retinitis pigmentosa (ADRP): Localization of an ADRP gene to the long arm of chromosome 3. Genomics 5: 619-622. [DOI] [PubMed] [Google Scholar]
- Riva, A. and Kohane, I.S. 2002. SNPper: Retrieval and analysis of human SNPs. Bioinformatics 18: 1681-1685. [DOI] [PubMed] [Google Scholar]
- Rosenfeld, P.J., Cowley, G.S., McGee, T.L., Sandberg, M.A., Berson, E.L., and Dryja, T.P. 1992. A null mutation in the rhodopsin gene causes rod photoreceptor dysfunction and autosomal recessive retinitis pigmentosa. Nat. Genet. 1: 209-213. [DOI] [PubMed] [Google Scholar]
- Sherry, S.T., Ward, M., and Sirotkin, K. 1999. dbSNP—Database for single nucleotide polymorphisms and other classes of minor genetic variation. Genome Res. 9: 677-679. [PubMed] [Google Scholar]
- Sherry, S.T., Ward, M.H., Kholodov, M., Baker, J., Phan, L., Smigielski, E.M., and Sirotkin, K. 2001. dbSNP: The NCBI database of genetic variation. Nucleic Acids Res. 29: 308-311. [DOI] [PMC free article] [PubMed] [Google Scholar]
- Smigielski, E.M., Sirotkin, K., Ward, M., and Sherry, S.T. 2000. dbSNP: A database of single nucleotide polymorphisms. Nucleic Acids Res. 28: 352-355. [DOI] [PMC free article] [PubMed] [Google Scholar]
- Tsai, J., Sultana, R., Lee, Y., Pertea, G., Karamycheva, K., Antonescu, V., Cho, J., Parvizi, P., Cheung, F., and Quackenbush, J. 2001. RESOURCERER: A database for annotating and linking microarray resources within and across species. Genome Biol. 2: software0002.1–0002.4. [DOI] [PMC free article] [PubMed]
- Vilo, J., Kapushesky, M., Kemmeren, P., Sarkans, U., and Brazma, A. 2003. Methods and software: Expression Profiler. In The analysis of gene expression data (eds. G. Parmigiani, et al.), chapter 5. Springer Verlag, New York.
- Zdobnov, E.M., Lopez, R., Apweiler, R., and Etzold, T. 2002. The EBI SRS server—New features. Bioinformatics 18: 1149-1150. [DOI] [PubMed] [Google Scholar]
WEB SITE REFERENCES
- www.ebi.ac.uk/miamexpress; MIAMExpress.
- www.rzpd.de/colBox/html/; RZPD's Genome-Matrix.
- www.ncbi.nlm.nih.gov; MapViewer at NCBI.
- www.ensembl.org/EnsMart; EnsMart.
- www.sanger.ac.uk; The Vertebrate Genome Annotation database.


