Abstract
This study examined the effects of 22 putative splicing mutations in the NF2 gene by means of transcript analysis and information theory based prediction. Fourteen mutations were within the dinucleotide acceptor and donor regions, often referred to as (AG/GT) sequences. Six were outside these dinucleotide regions but within the more broadly defined splicing regions used in the information theory based model. Two others were in introns and outside the broadly defined regions. Transcript analysis revealed exon skipping or activation of one or more cryptic splicing sites for 17 mutations. No alterations were found for the two intronic mutations and for three mutations in the broadly defined splicing regions. Concordance and partial concordance between the calculated predictions and the results of transcript analysis were found for 14 and 6 mutations, respectively. For two mutations, the predicted alteration was not found in the transcripts. Our results demonstrate that the effects of splicing mutations in NF2 are often complex and that information theory based analysis is helpful in elucidating the consequences of these mutations.
Keywords: splice-site mutation, NF2, transcript, information content, DNA, RNA
INTRODUCTION
Mutations in splice site regions are frequently the cause of human genetic diseases (Krawczak et al., 1992). Approximately 25% of all constitutional mutations in the NF2 tumor suppressor gene are in the generally recognized dinucleotide acceptor and donor sites, often referred as (AG/GT) splice sites. Heterozygous mutations in the NF2 gene are the cause of the genetic disorder neurofibromatosis type 2 (NF2) which predisposes patients to various tumors, mainly of the central nervous system (Merel et al., 1995; Kluwe et al., 1996, 1998; Parry et al., 1996; Ruttledge et al., 1996).
Approximately 65% of NF2 mutations are nonsense or frameshift mutations, which are usually associated with severe disease phenotypes characterized by early disease onset and multiple tumors. In contrast, missense mutations and in-frame deletions and insertions, accounting for approximately 10% of all NF2 mutations, are often associated with mild phenotypes characterized by late disease onset and fewer tumors. Interestingly, the phenotypes associated with mutations in the splice sites are very variable, ranging from asymptomatic adults to severely affected individuals (Kluwe et al., 1998). This phenotypic variability may be explained by the complex effects of splicing mutations. Most putative NF2 splice-site mutations have been identified only in genomic DNA. Their effects on the splicing of the transcript often could not be determined precisely due to lack of availability of adequate RNA. While mutations in the (AG/GT) splicing sites are generally accepted as pathogenic alterations, the implications of mutations outside of these regions are often unclear.
In this study, we examined the effect of 22 putative splicing mutations in the NF2 gene by means of transcript analysis and computer predictions based on information theory. We used Individual Information content (Ri, measured in bits), an information theory based measure, similar to surprisal, for predicting the strength of a specific splice site. It is based on the statistical properties of many confirmed splice sites, using a larger domain of genomic sequence around splicing sites, and gives a much larger range of values for splicing site binding strengths than the dinucleotide model (Schneider, 2002). Sets of Ri values for both native and cryptic splicing sites, including changes caused by mutations, can be calculated using the Individual Information package from the Delila software system (Schneider, 1997b; Rogan et al., 1998). These provide comprehensive predictions of possible and probable splicing events and resulting alterations in transcripts.
MATERIALS AND METHODS
Patients
Diagnosis of NF2 was based on the NIH criteria (Gutmann et al., 1997). The protocol was approved by the institutional review board and all participants provided informed consent. Genomic mutations were identified as described previously (Kluwe et al., 1998).
Transcript Analysis
Transcripts of a total of 22 distinct putative splicing mutations were analyzed in this study. One identical mutation of exon 15 was found in two unrelated patients (#118 and #146). Another patient (#624) had two putative splicing mutations. Thus the number of mutations and the number of patients is equal. Fresh blood was available from these 22 patients, enabling extraction of total RNA from peripheral leukocytes (Chomczynski and Sacchi, 1987). First-strand cDNA was synthesized using modified murine Moloney leukemia virus reverse transcriptase, SuperscriptII (Gibco-BRL). An oligo-dT or specific primer was used for the NF2-transcript. Four overlapping fragments covering the NF2-transcript were amplified using primer pairs A1-A2 (exons 1–4), B1-B2 (exons 5–8), C1-C2 (exons 9–12) and D1-D2 (exons 13–17), as described previously (Jacoby et al., 1996). These are labeled as A, B (Figure 1), C (Figure 2) and D (Figure 3). Additional bands across multiple samples were considered as products of alternative splicing.
Figure 1.
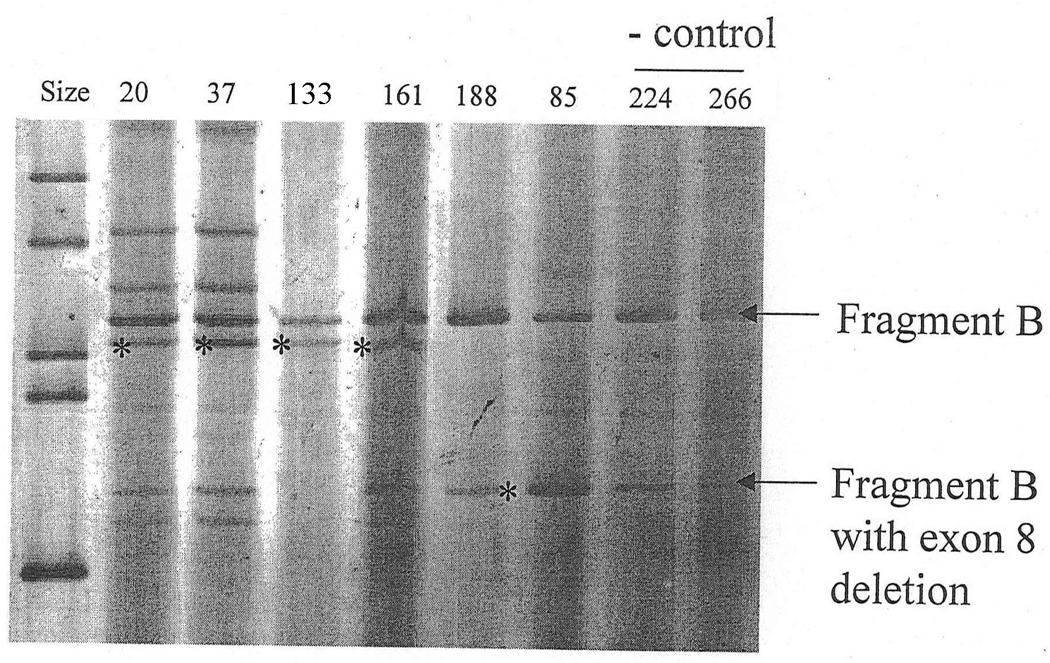
Fragment B containing exons 5–8. Aberrant bands were found in patients #20, #37, #133, #161 and #85 (asterisks).
Figure 2.
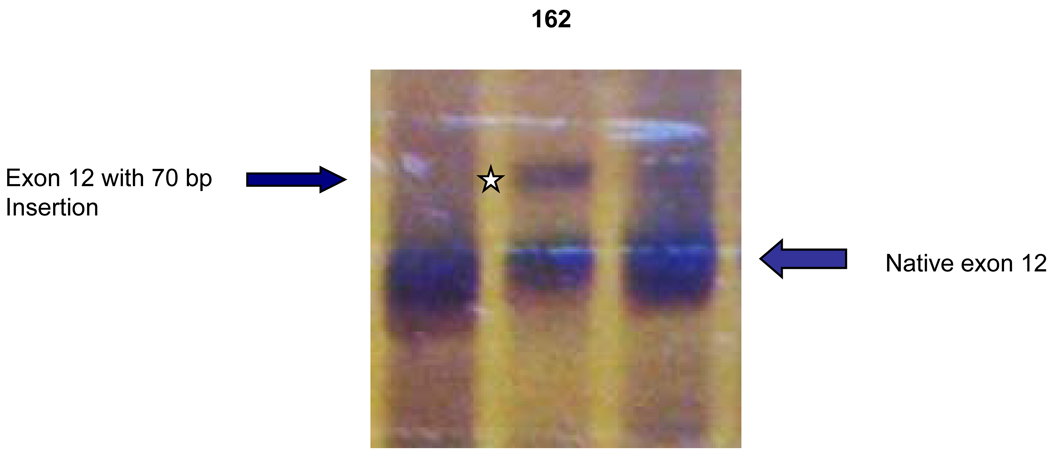
Fragment C containing exons 9–12. A larger fragment (star) was found in patient #162 with the mutation of IVS11-2 A>C. Sequencing revealed an insertion of 70 bp from the 5´-end of intron 11.
Figure 3.
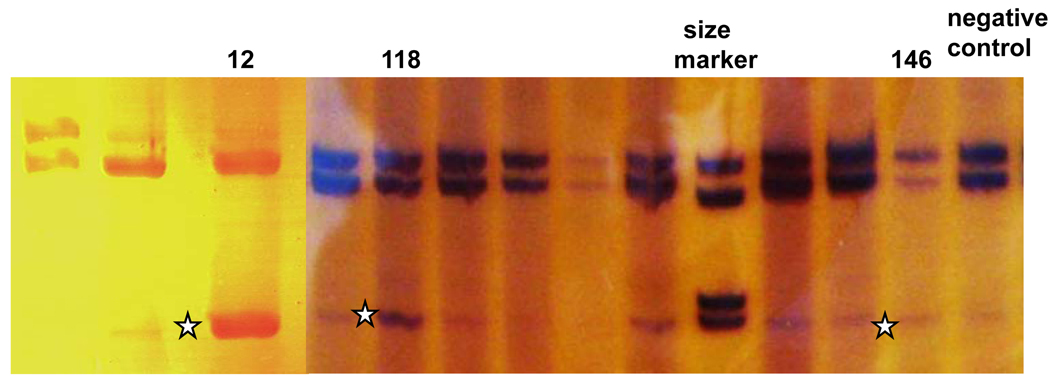
Fragment D containing exons 13–17. Fragment with skipping of exon 15 was found across all samples at low level. However, in patient #12 the level of this fragment (star) is elevated to that of the fragment without exon 15 skipping. In patients #118 and #146, the level of the fragment with exon 15 skipping (stars) also seemed higher that in other samples.
Aberrant bands appearing in patients with corresponding splicing mutations were excised and sequenced after re-amplification. A shorter fragment with reduced intensity was visible for fragment B across all samples, corresponding to an alternatively spliced NF2-transcript which skipped exon 8 (Figure 1) (Pykett et al., 1994).
Fragment D (covering exons 13–17) showed double bands due to alternative skipping of exon 16 (Figure 3) (Bianchi et al., 1994; Arakawa et al., 1994). An additional faint shorter band that illustrates less frequent alternative skipping of exon 15 (Figure 3) (Pykett et al., 1994) is also visible.
Since no alterations were found for two splicing mutations of exon 13 (Figure 4A), a shorter fragment of 61 bp was amplified with primers D1 and C2 in order to increase the resolution of the analysis (Figure 4B). The amplified fragments were analyzed with 6% polyacrylamide gels and stained with silver (Kluwe et al., 1998) or SYBR (Molecular Probe).
Figure 4.
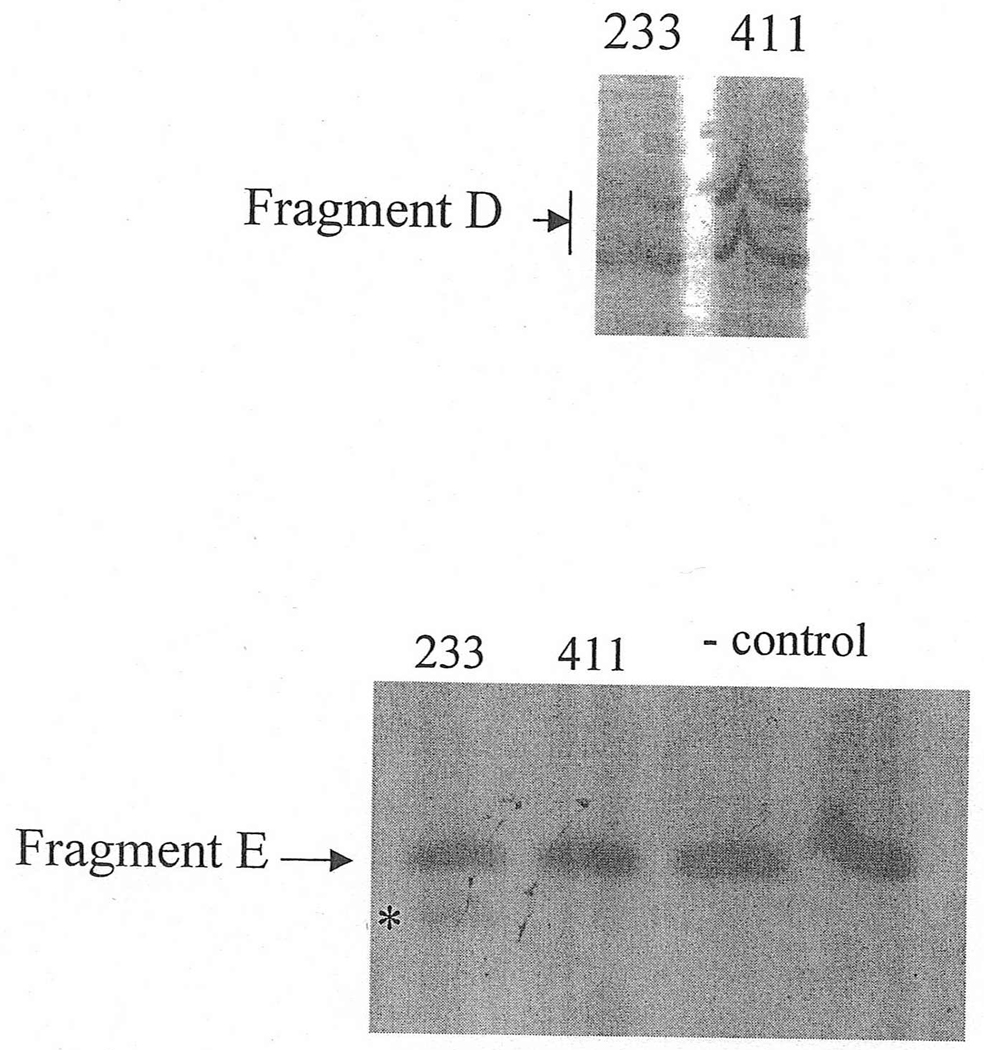
A: Fragment D for patients #233 and #411, with mutations IVS12-2 A>C and IVS12-1 G>A, respectively. No alterations were found initially.
B: Fragment E is an amplification of Fragment D. A weak small fragment (asterisk) was found in a shorter fragment E of length 61 bp covering the junction of exons 12 and 13 (see Methods section), in patient 233. Sequencing revealed an 8 bp deletion.
Calculation of Individual Information Content (Ri)
Computer analysis of the strength of splice sites was performed using programs from the Individual Information package of the Delila System of T. Schneider (Schneider, 1997a). Values of the Individual Information content variable, Ri, are calculated for each base and position of the selected sequence in the domain of interest. In this situation, Ri(b, l) is the difference in surprisal before and after binding of a specific base, b, at a specific position, l, relative to the origin of an acceptor or donor sequence.
Weighting matrices based on probability estimates that are derived from the relative frequencies, f(b, l), of bases, b, at specified offsets, l, from the splice site origin within a specified domain of the location have been constructed from a collection of more than 1700 aligned regions from known acceptor and donor sites (Stephens, 1992). Entries of the weighting matrices are
| (1) |
where e(n, l) is a small-sample error correction for n samples at position l.
The site sequence is determined entirely by the location of the site in any specific genomic sequence. The Ri value of a site at a selected location, j, is the sum of the individual Ri values of a sequence of bases over a restricted domain about that location. Symbolically,
| (2) |
where the genomic sequence has base b at offset l for location j. For acceptors in human DNA, the site_domain is −25 to +2; for donors, it is −3 to +6. Values of Ri are normally expressed in bits (binary digits). One bit is the amount of information needed to distinguish between two choices, two bits are needed to choose one of four choices, etc. Reasons for choosing this functional form and these units are discussed in Schneider (Schneider, 1997a) and Shannon (Shannon, 1948).
Ri values of at least zero are required for a splice site to exist theoretically. In our model, strong acceptor sites range upward from 9 or 10 bits; strong donor sites range upward from 7 or 8 bits. Based on previous evaluation of Ri values (Rogan et al., 1998), mutations reducing Ri to less than 2.4 bits were expected to cause complete inactivation of the original splice site. Significant reduction, but to values > 2.4 bits, was expected to cause partial inactivation. Increasing Ri of a cryptic site to a value > 2.4 bits was expected to cause activation of that site. Mutations causing no significant change in Ri should have no effect on splicing.
The original computer system was a Sun SPARCstation 2 running Sun OS 5.5. Most runs, including those that generated the figures in this paper, were performed on a Sun Blade 1000, first running Solaris 8, then Solaris 10. Programs of the large Delila system (Schneider, 1997b) were used to prepare and organize the data.
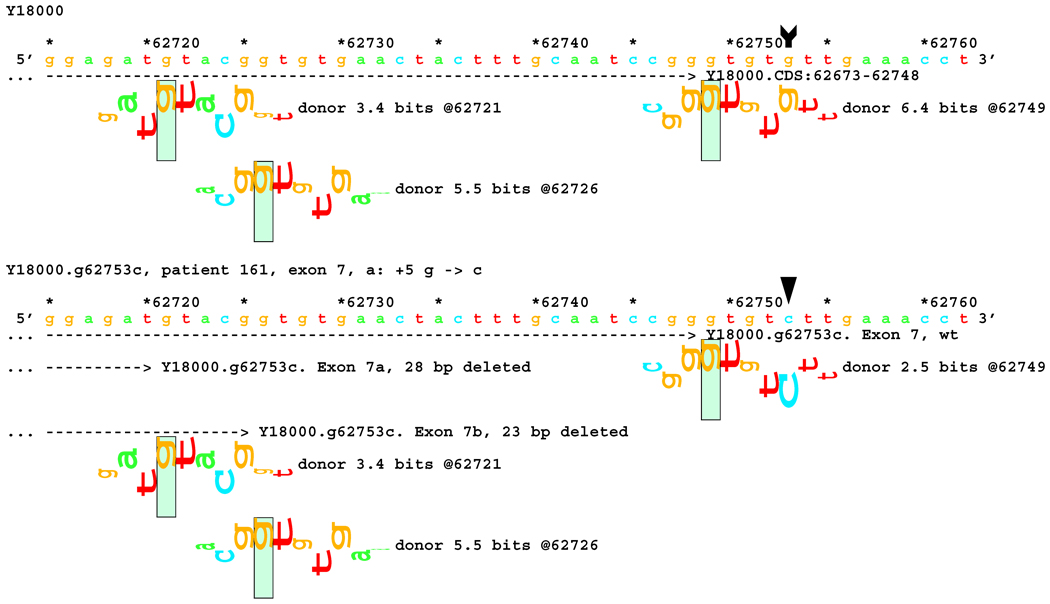
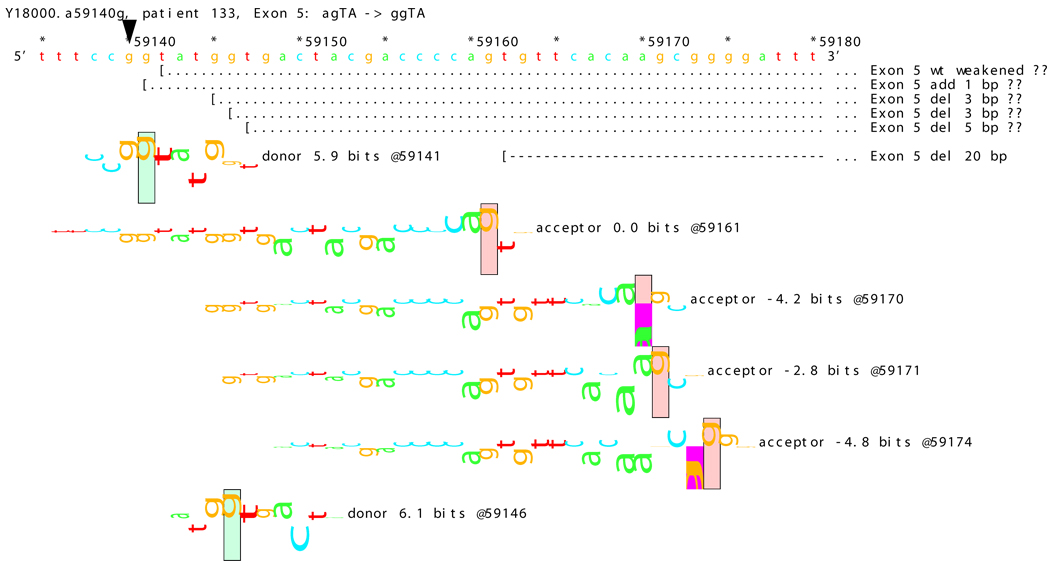
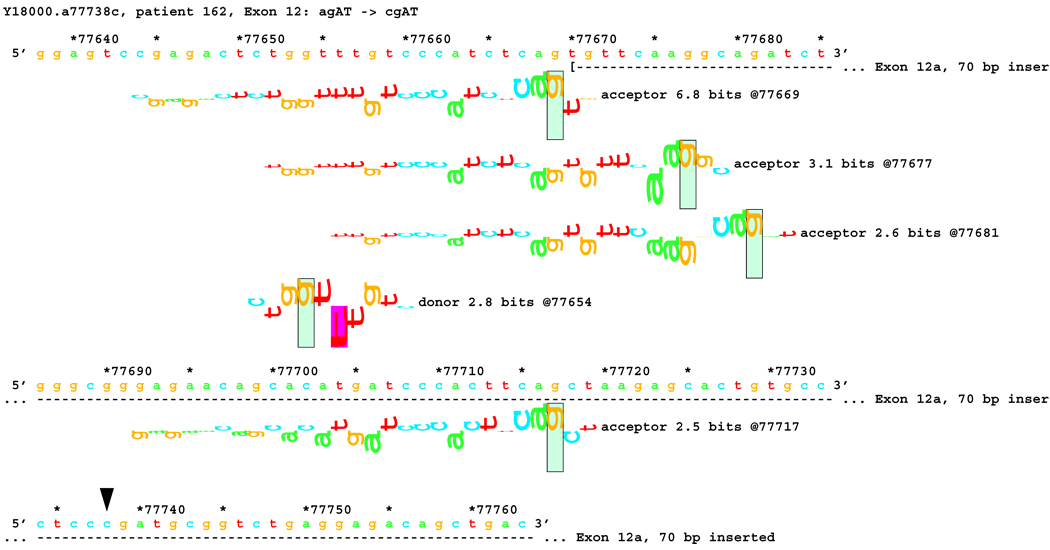
Genomic sequence domains of at least 50 bp up- and down-stream of each mutation were evaluated using programs from the Individual Information package of Delila. Ri values of both native and cryptic splice sites were calculated. These values are displayed graphically as sequence walkers (Figures 5 – 8) (Schneider 1997a). Sequence walkers illustrate the individual Ri contributions of the bases to the Ri sum of an acceptor or donor site at a location. On these plots, letters for bases that contribute positively to the Ri sum point upward, those that contribute negatively point down. Letter height is proportional to the information content contribution of that base. The Ri sum is given along with the type of site. Exons are displayed on the same plots for clarity
Figure 5.
Sequence walker analysis of the genomic sequence of human NF2 near the end of Exon 7. The end of native exon 7 is shown as a horizontal dashed line ending in a ">" symbol, where it is terminated by a donor site at location 62749. Two exons are shown with the mutated string, terminating on now active donor sites 23 and 28 bps upstream, showing the mixture of RNAs obtained.
Figure 11.
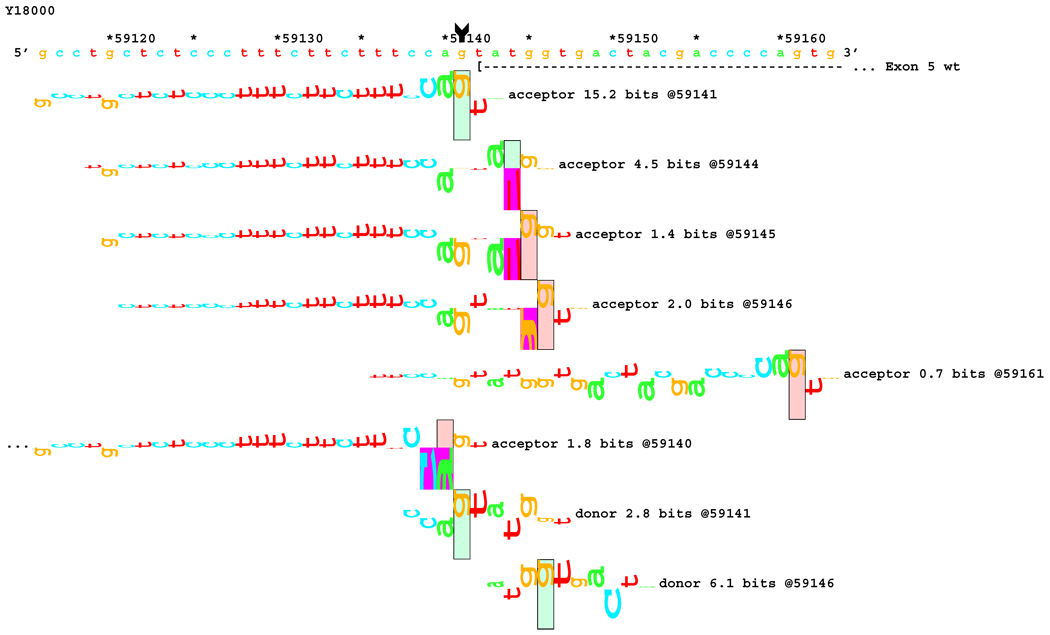
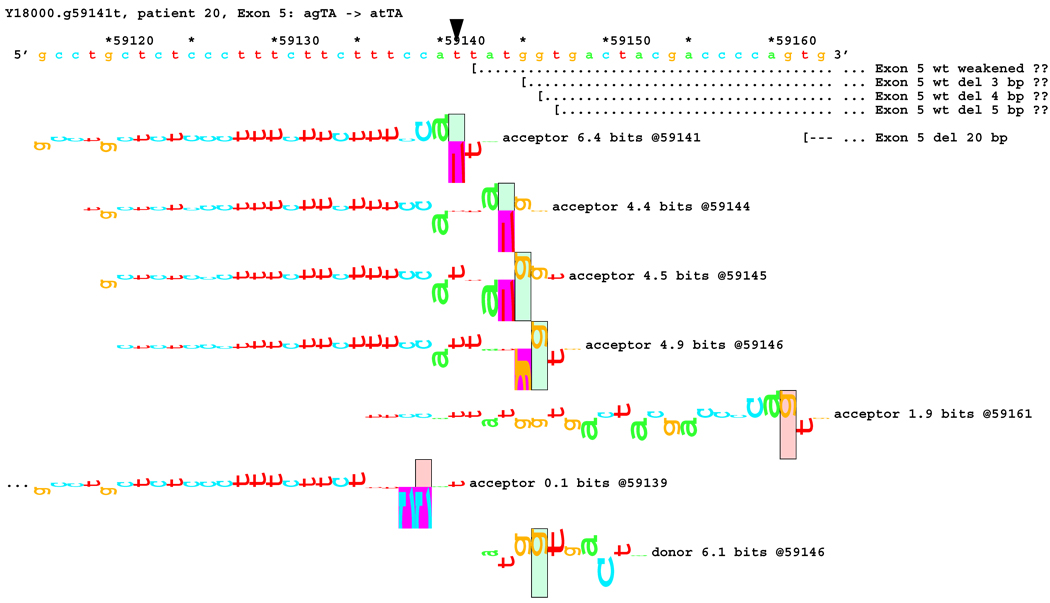
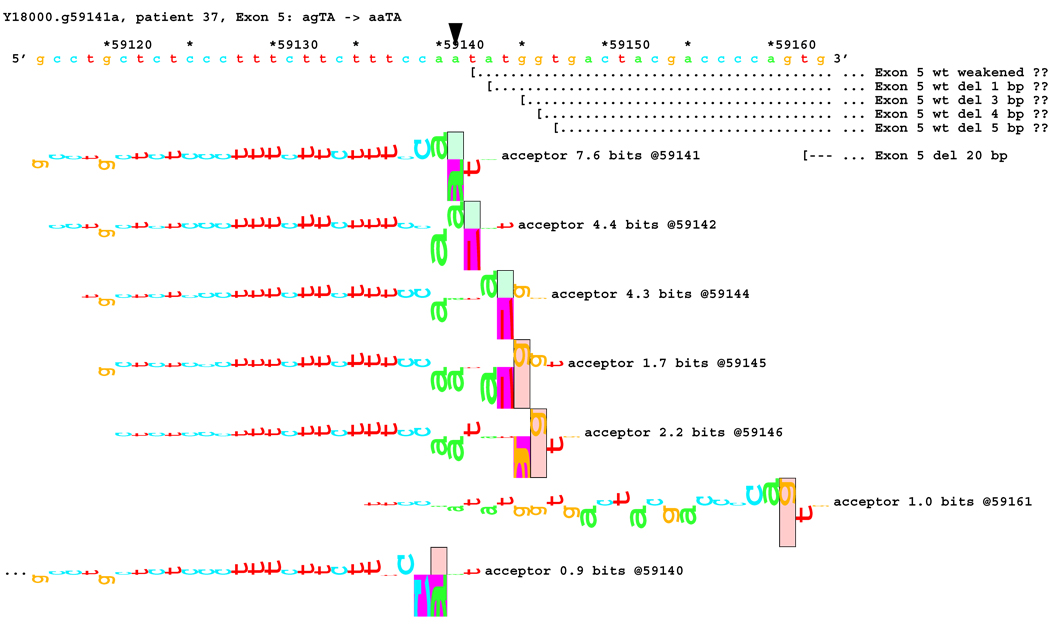
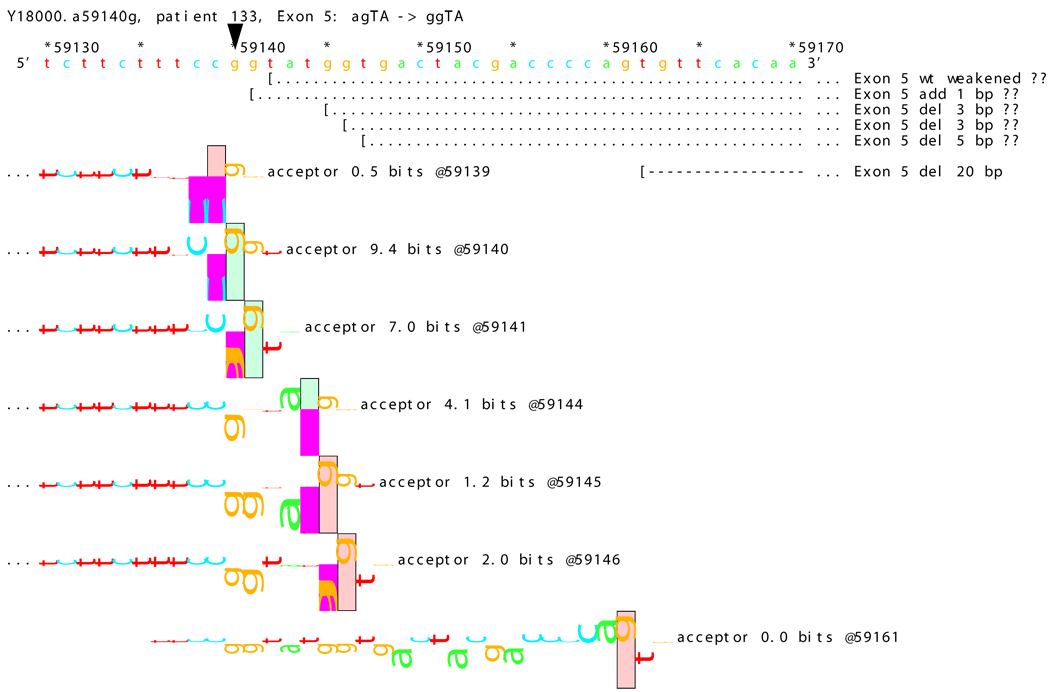
[Figure 8]: Sequence walker analysis of the genomic sequence of human NF2 near the beginning of exon 5 with three closely located distinct mutations. All give the same transcript modification, a deletion of 20 bp, using the weak to very weak site at wt +20 bp. In addition, mutation agTA -> atTA (IVS5-1 g>t) gives an exon using the slightly stronger acceptor at wt + 5 bp.
[Figure 8A]: WT sequence near the beginning of exon 5, showing the strong acceptor along with the confirmed ( --- > exon.
Figures 5–8: Sequence walker analyses of some genomic sequences of human NF2. Genomic sequences are shown horizontally, with locations given above each in increments of 10 base pairs. Asterisks indicate locations that are multiples of 5. A brief description of each piece of DNA is given above the locations. Individual information contributions are shown below the sequence, with letters for positive contributions pointing up, and those with negative contributions pointing down. The positions of splice sites are boxed and labeled with type, strength (Ri value), and location. Vertical arrow tails indicate native location of a point mutation; corresponding arrowheads indicate the mutated location. Exons are shown as horizontal dashed lines starting with a "(" symbol and ending in a ">" symbol, e.g., "( --- >".
For more details on Individual Information, Sequence Logos, Information Theory, and related topics, see the Schneider Lab web page, http://www.ccrnp.ncifcrf.gov/~toms/index.html.
RESULTS
Transcript Analysis
Since RNA was obtained from leukocytes of the patients, which are heterozygous for the mutations, normal transcript was present in all samples. The effect of each splicing mutation was indicated by the intensities of normal and altered transcripts. Alterations in the NF2-transcripts were detected for 17 of the 22 putative splicing mutations. Ten resulted in skipping of the respective exons. In two out of the 10 cases, the fragments with skipped exons were significantly less than the corresponding native ones, indicating either incomplete skipping or underexpression of the mutated alleles. Deletions and insertions of various lengths were found for the other 7 mutations, results of activation of one or more cryptic splicing sites (Table 1 and Figures 5 – 8). Transcripts resulting from activation of cryptic splicing sites generally were less than their native counterparts, explained by either incomplete activation of the cryptic sites or under-expression of the mutant alleles.
Table 1.
Effects of 20 Mutations in the Splicing Region
| Patient | Genotype | Ri (bits) | |||||
|---|---|---|---|---|---|---|---|
| Exon | Mutation | Not In Dinucleotide Region AG/GT [*] |
Alteration in the NF2- transcript |
Natural sites wt → mutated |
Cryptic sites wt → mutated (positions) b |
Ri values – Transcript results Concordance |
|
| 398 | 2 | IVS1-2A>G | skip exon 2 | 10.7 → 2.6 | Full | ||
| 20 a | 5 | IVS4-1G>T |
del 5 bp b from 5´ -end of exon 5 del 20 bp from 5´ -end of exon 5 |
15.2 → 6.4 | 4.5 → 4.4 (+3) 1.4 → 4.5 (+4) 2.0 → 4.9 (+5) 0.7 → 1.9 (+20) |
Partial | |
| 37 a | 5 | IVS4-1G>A |
del 20 bp from 5´ -end of exon 5 |
15.2 → 7.6 | < 0.0 → 4.4 (+1) 4.5 → 4.3 (+3) 1.4 → 1.7 (+4) 2.0 → 2.2 (+5) 0.7 → 1.0 (+20) |
Partial | |
| 133a | 5 | IVS4-2A>G |
del 20 bp from 5´ -end of exon 5 |
15.2 → 7.0 | 1.8 → 9.4 (−1) 4.5 → 4.1 (+3) 1.4 → 1.2 (+4) 2.0 → 2.0 (+5) 0.7 → 0.0 (+20) |
Partial | |
| 161 a | 7 | IVS7+5G>C | [*] | del 23 bp from 3´ -end of exon 7 del 28 bp from 3´ -end of exon 7 |
6.4 → 2.5 |
5.5 (−23) 3.4 (−28) |
Full |
| 85 a | 8 | c.809A>G (2nd last bp) |
[*] | skip exon 8 | 7.2 → 4.9 | 5.9 (+9) | Partial |
| 624 | 10 | IVS10-16T>C | [*] | No alteration detectable | 12.2 → 12.0 | none | Full |
| 162 | 12 | IVS11-2A>C | ins 70 bp before exon 12 | 5.0 → −4.2 | 6.8 (−70) | Full | |
| 214 | 12 | IVS11-2A>G | ins 70 bp before exon 12 | 5.0 → −3.1 | 6.8 (−70) | Full | |
| 233 | 13 | IVS12-2A>C |
del 8 bp from 5´ -end of exon 13 |
14.0 → 6.6 | < 0.0 → 4.0 (+1) 1.4 → 3.4 (+8) |
Full | |
| 411 | 13 | IVS12-1G>A | No alteration detected | 14.0 → 6.5 | < 0.0 → 7.9 (+1) 1.4 → 1.1 (+8) |
Full | |
| 179 | 14 | IVS13-1G>A | skip exon 14 | 4.9 → −2.7 | none | Full | |
| 267 | 14 | IVS13-1G>T | skip exon 14 | 4.9 → −3.9 | none | Full | |
| 651 | 14 | IVS13-2A>G | skip exon 14 | 4.9 → −3.3 | none | Full | |
| 26 a | 14 | IVS14+1G>C | skip exon 14 | 6.4 → −3.4 | none | Full | |
| 228 | 14 | IVS14+2T>C | skip exon 14 | 6.4 → −1.0 | none | Full | |
| 118 a | 15 | IVS14-1G>A | skip exon 15 (weak) | 5.4 → −2.2 | none | Partial | |
| 146 a | 15 | IVS14-1G>A | skip exon 15 (weak) | 5.4 → −2.2 | none | Partial | |
| 624 | 15 | IVS14-3C> G | [*] | skip exon 15 | 5.4 → −0.6 | none | Full |
| 12 a | 15 | c.1737G>T (last bp) |
[*] | skip exon 15 (moderate) | 4.1 → 0.8 | none | Full |
| 326 | 15 | IVS15+3A>C | [*] | No alteration detectable | 4.1 → −0.7 | none | None |
Mutations in these patients have been previously reported (Kluwe et al., 1998).
+: downstream from the original splice site; −: upstream from the original splice site.
not in generally recognized dinucleotide [AG/GT] acceptor and donor regions.
Bold: cryptic splice sites that are used.
The same mutation IVS14-1 G>A in the acceptor site of exon 15 was found in two unrelated patients (#118, #146) and had the same effect on splicing, a slightly increased intensity of the shorter fragment with skipped exon 15 (Figure 3, Table 1). One patient (#624) had two putative splicing mutations, both outside of the dinucleotide regions. One of these, IVS10-16 T>C, had essentially no effect on the transcript; the other IVS14-3 C>G, caused strong skipping of exon 15 (Table 1).
Initially, no transcriptional alteration was detected for the two splicing mutations in the dinucleotide acceptor region of exon 13 (Figure 4A). Since Ri changes (see comparison subsection below) predicted deletions of 1 and 8 bp, a shorter fragment of 61 bp, labeled E, was amplified using the forward primer for fragment D and the backward primer for fragment C (Figure 4B). Indeed, a smaller band with very low intensity was found in patient #233 (mutation IVS12-2 A>C). DNA was extracted from the excised band containing this fragment. Sequencing revealed an 8 bp deletion from the 5´-end of exon 13, as predicted from the RI change. However, this deletion was not detected in the other patient, #411, with a similar mutation IVS12-1 G>A (Figure 4B). The predicted 1 bp deletion for both cases could not be detected by gel electrophoresis because this small change was beyond the resolution of this method. Direct sequencing of fragment D amplified from patients #233 and #411 did not reveal the 1 bp deletion either, likely due to the very low proportion of the fragment with the alteration.
Comparison of Individual information Content (Rib) Evaluation and Transcript Results
RI values were calculated for the 22 DNA sequence regions of interest, as defined in Equation 2, surrounding the putative splicing mutations. Fourteen mutations were in the generally recognized dinucleotide acceptor and donor regions. Six were outside of these, but within the more broadly defined splicing regions based on information theory (Table 1). Two others were in introns (Table 2).
Table 2.
Effects of Two Intronic Mutations
| Patient | Genotype | Ri (bits) | |||||
|---|---|---|---|---|---|---|---|
| Intron | Mutation | Not In Dinucleotide Region AG/GT [*] |
Transcript analysis | Natural sites |
Cryptic sites (positions) |
Ri values – Transcript results Concordance |
|
| 144 a | 2 | IVS2+15G>A | [*] | no alteration detectable | 4.1 → 4.1 | Full | |
| 188 a | 8 | IVS8+22delATG | [*] | no alteration detectable | 7.2 → 7.2 | Full | |
Mutations in these patients have been reported previously (Kluwe et al., 1998).
not in generally recognized dinucleotide [AG/GT] acceptor and donor regions.
All 20 mutations in the splicing regions reduced the RI values at the original splicing sites. In 11 cases these values were < 2.4 bits, leading us to expect inactivation (Rogan et al., 1998). In 8 other cases, the values were between 2.6 and 7.6 bits, for which we would predict leakiness. In addition, activation of single cryptic splicing sites was predicted for 5 cases and multiple cryptic splicing sites for 4 others. One case showed an insignificant effect on transcription consistent with a RI change of 12.2 to 12.0 bits. These are shown in Table 1.
No change of the RI values at any splicing sites was found for the 2 intronic mutations. Transcript analysis showed no changes (Table 2).
Complete Concordance
In 14 cases, results of in silico information theory based analysis and transcript analysis matched very well. A typical example is the mutation IVS7+5 G>C in patient #161, which is located well outside the generally accepted dinucleotide splicing site, information theory based analysis predicted a reduction of Ri from 6.4 to 2.5 bits at the native donor site, and an increase of Ri values from none to 5.5 and 3.4 bits for two cryptic donor sites, 23 and 28 bps upstream of the native end of exon 7, respectively (Figure 5). Both 23 and 28 bp deletions were indeed found in the transcript, corresponding to activation of the two cryptic donor sites.
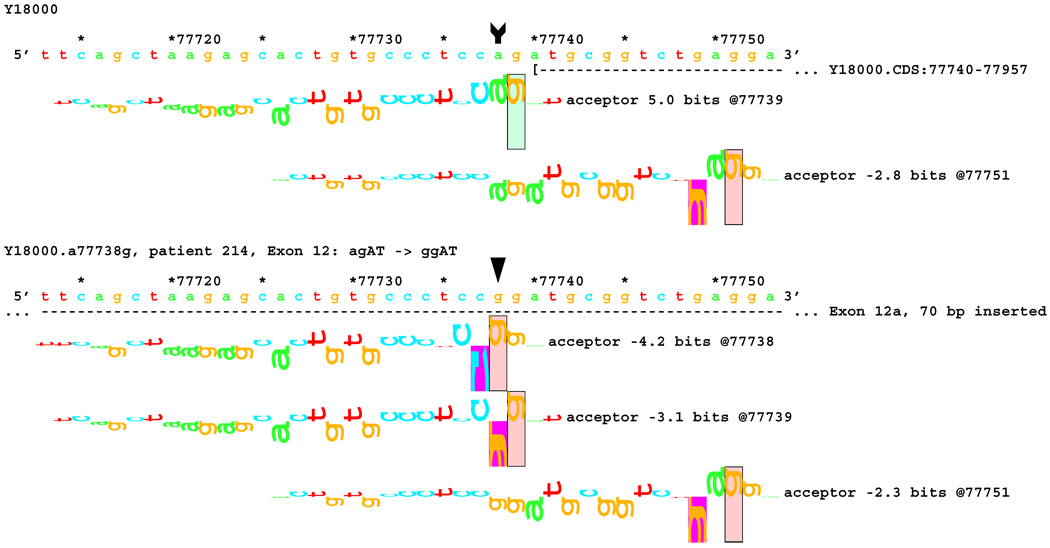
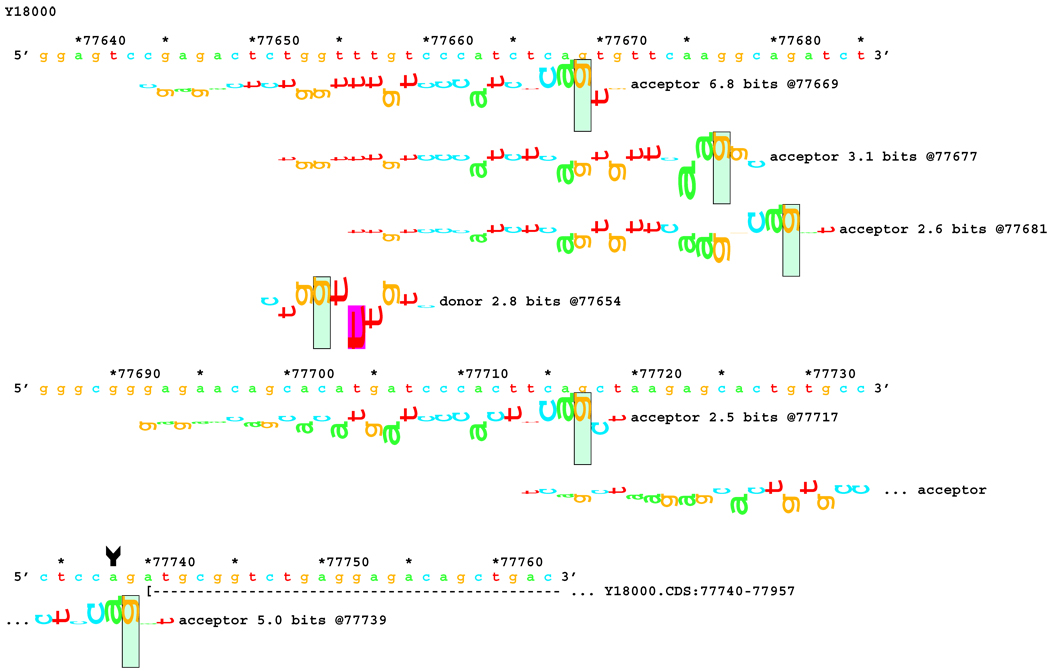
Transcript analysis revealed insertion of 70 bp of intronic sequence upstream of the native start of exon 12 in patients #162 and #214 with mutations IVS11-2 A>C and IVS11-2 A>G, respectively. Consistently, information theory based analysis predicted a reduction of Rib value at the original acceptor site from 5.0 bits to −4.2 and −3.1 bits respectively (Table 1). Local effects of the IVS11-2 A>G mutation are illustrated in Figure 6A. These deactivated the native acceptor and increased the importance of an existing cryptic acceptor site, with a RI of 6.8 bits, 70 bp upstream (Figure 6B). Three weaker acceptor sites between the native and strong cryptic sites are not involved in splicing.
Figure 6.
Sequence walker analysis of the genomic sequence of human NF2 near the beginning of exon 12.
[Figure 6A]: Local effect of mutation agAT > ggAT (IVS12-2 a>g) on acceptor strength. The effect of agAT > cgAT (IVS12-2 a>c) is similar, but not identical. The beginning of Exon 12 is shown as a horizontal dashed line starting with a "(" symbol. The native exon starts at location 77740 and is initiated by an acceptor site of strength 5.0 bits.
Figure 7.
[Figure 6B:] The two mutations, agAT > cgAT (IVS12-2 a>c) and agAT > ggAT (IVS12-2 a>g), weaken this site sufficiently that the mutated exon 12 begins at location 77670, initiated by a formerly cryptic acceptor site of strength 6.8 bits 70 bp upstream. Several weaker acceptor sites between these two are neither used nor modified.
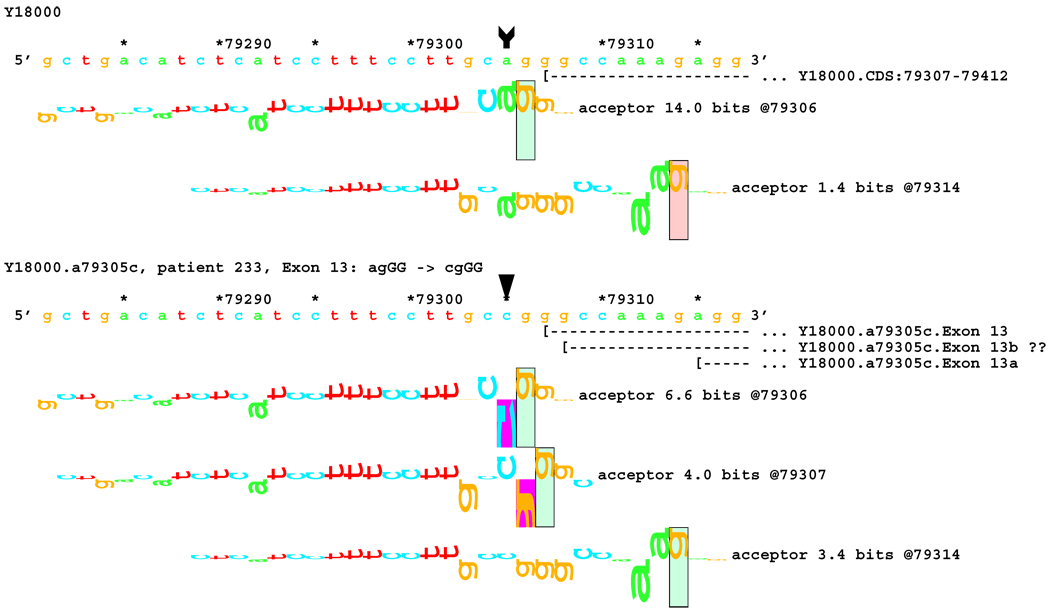
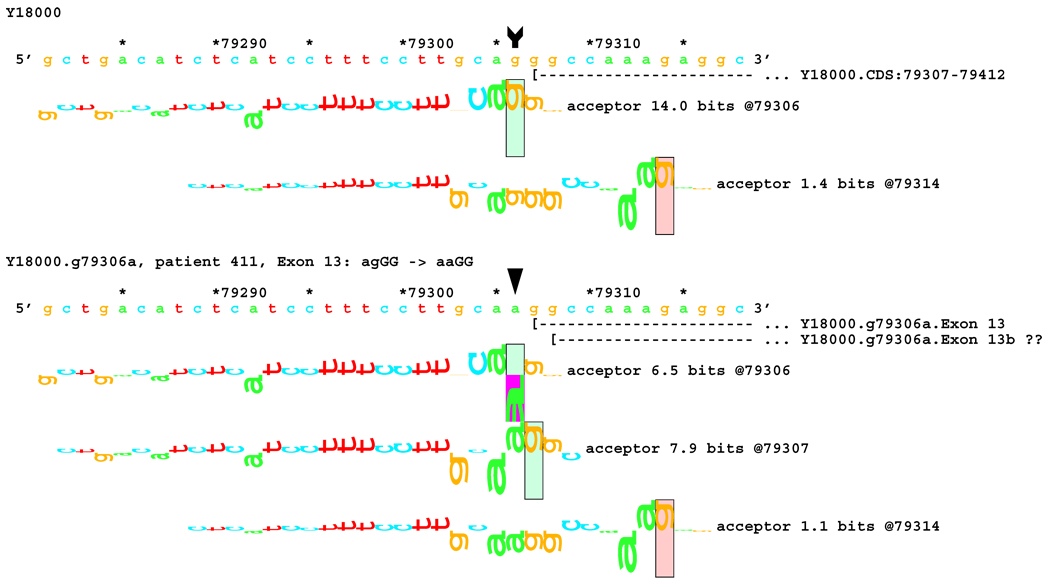
No alteration was revealed by initial transcript analysis for the two mutations in the acceptor site of exon 13 (IVS12-2 A>C and IVS12-1 G>A). However, information theory based analysis predicted possible deletions of 1 bp for both, with creation of cryptic acceptors of (RI = 3.4 and 7.9 bits) respectively, and 8 bp for the former one (Figure 7A). In both cases, a very strong acceptor site (RI = 14.0 bits) is weakened significantly. However, a cryptic acceptor site 8 BP downstream is strengthened by the former mutation (Rib = 4.0), but weakened by the latter (Figure 7B). Based on this prediction, we carried out amplification and analysis of a short fragment covering this region, and found an 8 bp deletion for the former mutation, but not for the latter (Table 1). Deletion of 1 bp was below the limit of resolution of the native gel electrophoresis. Direct sequencing of the amplified fragment did not reveal any alteration either, possibly due to a low level of cryptic product with a 1 bp deletion.
Figure 9.
[Figure 7]:Sequence walker analysis of the genomic sequence of human NF2 near the beginning of exon 13. Exon 13 is shown in the same manner as Exon 12 above. The native exon starts at location 79307 and is initiated by an acceptor site of strength 14.0 bits. Although the mutations are in the generally accepted dinucleotide acceptor site, they do not inactivate the native acceptor.
[Figure 7A]: The IVS12–2 A>C (a79305c) mutation weakens this site significantly, but leaves it functional. Two cryptic acceptor sites are created, 1 and 8 bp downstream of the native, that are strong enough to be functional. An exon was found that did have the eight nucleotides deleted. The one nucleotide deletion was probably below the detection capabilities of the transcript analysis.
Figure 10.
[Figure 7B]: The IVS12–1 G>A (g79306a) mutation weakens this site almost identically. Two cryptic acceptor sites are created at the same locations, 1 and 8 bp downstream of the native. However, only the first one, at +1 (79307), is strong enough to be functional. As with the previous case, a one-nucleotide deletion was probably below the detection capabilities of the transcript analysis.
Partial Concordance
Some of the predicted alterations were found in the transcripts for six mutations.
For three mutations in the acceptor site of exon 5, information theory based analysis predicted both common and distinct alterations. As illustrated Figure 8A, the native acceptor is very strong with a RI value of over 15. A cryptic site with RI of 4.5 is located 3 bp downstream, which should not be effective in the presence of the strong natural acceptor. Another very weak (RI = 0.7 bits) cryptic acceptor is located 20 bp downstream.
Significant weakening of the native acceptor site’s high value (Ri = 15.2 bits) and deletions of 3 and 20 bp were predicted for mutations in all the three cases. However, the Ri value for the cryptic splicing site at +20 bp was only increased from 0.7 bits to 1.9 bits for mutation IVS4-1 G>T (Figure 8B) and to 1.0 bits by mutation IVS4-1 G>T (Figure 8C). For the mutation IVS4-2 A>G in patient #20, there is a cluster of acceptors with strong Ri values between −1 and +5 bp of the wt site (Figure 8D). On the other hand, as shown in Figure 8E, the weak acceptor at + 20 bp was decreased to 0.0 bits, but has essentially no competitors. A 20 bp deletion was found by transcript analysis in all cases, confirming activation of this cryptic site by the three mutations
Figure 12.
[Figure 8B]: Mutation agTA -> atTA atTA (IVS5-1 g>t), showing first cluster of similar-valued acceptors along with possible ( … > and confirmed ( --- > exons.
Figure 13.
[Figure 8C]: Mutation agTA -> aaTA atTA (IVS5-1 g>a), showing second cluster of similar-valued acceptors with exons.
Figure 14.
[Figure 8D]: Mutation agTA -> ggTA atTA (IVS5-2 a>g) illustrating a third cluster of similar-valued acceptors with strong Ri values, shifted to show their isolation, with exons.
Figure 15.
[Figure 8E]: Mutation agTA -> ggTA (IVS5-2 a>g), shifted to show acceptor sites near the mutated exon end, located at the wt exon end + 20 bp along with possible and confirmed exons. Ri values of these competing sites are not affected by the mutations.
In addition, 4 and 5 bp deletions were predicted in patient #20, a 1–bp deletion in patient #37, and 1 bp insertion in patient #133. The 5 bp deletion was found in the transcript of patient #20. Its acceptor was slightly stronger (4.9 bits) than its adjacent competitors (4.4 and 4.5 bits), and was slightly father away from the wt acceptor, which was reduced somewhat more, to 6.4 bits, than was the case for the similar mutations. Failure to detect the smaller deletions of 1, 3, and 4 bp may be due to the limited resolution of the analysis. Direct sequencing of the amplified fragment did not reveal any change due to underexpression of the mutated transcripts. The limited amount of RNA prohibited us from further detailed analysis such as specific amplification of the altered transcript.
For the mutation A>G at the next to last bp of exon 8 (IVS8-2 A>G) in patient #85, the Ri of the natural donor site was decreased from 7.2 to 4.9 bits. Skipping of exon 8 was indeed found in the transcript of the patient. However, while information theory based analysis predicted a cryptic donor site 9 bp downstream of the natural site with an Ri of 5.9 bits, no 9 bp deletion was found in the transcript. Competition between these two sites may be a cause of the known alternative splicing that skips exon 8.
A mutation in the acceptor site exon 15, IVS14-1 G>A, found in two unrelated patients, reduced the acceptor Ri from 5.4 to −2.7 bits. Transcript analysis revealed incomplete skipping of this exon, partially matching the prediction of information theory based analysis. Another mutation, a G>T at the last base pair of exon 15, in patient #12, diminished the donor Ri value from 4.1 to 0.8 bits. Moderate skipping of the exon was revealed by transcript analysis.
In two cases, the predicted alterations were not found in transcripts. One is the 1 bp deletion predicted for IVS12-1 G>A, which could be explained by the limitation of resolution. The other conflict was in the case of mutation IVS15+3 A>C in patient #326, where the Ri of the donor of exon 15 was calculated as reduced from 4.1 to −0.7 bits by the mutation (Table 1), yet no alteration was found in the corresponding transcript.
DISCUSSION
Two general types of consequences were associated with the 20 splicing mutations of the NF2 gene: 1) skipping the entire exon and 2) activation of cryptic splicing sites resulting in exons with altered length.
Skipping of exons was complete in 8 cases, and incomplete in 2. Interestingly, for the latter two cases (patients #118 and #146), the clinical courses of patients were mild (Kluwe et al., 1998). However, the mild clinical phenotype could also be a result of the location of the mutation, since our previous study (Kluwe et al., 1998) reported that splicing mutations in the 3´-half of the NF2 gene are associated with fewer tumors. The G>T mutation at the last base pair of exon 15 (patient #12), outside of the dinucleotide donor, caused moderate skipping of exon 15. However, this exon has been shown to be alternatively skipped in some normal samples (Pykett et al., 1994), so our observations were possibly within the normal range of alternative splicing.
Some splicing mutations caused alteration in the length of the corresponding exons instead of skipping of the entire exons. In these cases, the Ri measures of native splicing sites were weakened - some were deactivated; while the cryptic splicing sites were activated - some of these were strengthed
Activation of cryptic splicing sites was generally incomplete, as revealed by lower intensity of the altered transcripts in comparison to that of the corresponding native ones. Under-expression of mutated transcripts has been previously reported in mRNA from lymphoblast cells of NF2 patients (Jacoby et al., 1999). Degradation of the altered transcripts due to instability may contribute to the under-expression of the mutant alleles.
Because of this under-expression of the mutated transcripts, direct sequencing of the amplified cDNA fragments was often not suitable for identification of alterations. In this study, electrophoretic separation, followed by excision of the corresponding bands, was necessary in order to enrich the altered transcripts for sequencing. However, fragments with small deletions or insertions could not be separated from the normal fragments on a native gel and thus could not be analyzed further. This may explain the failure to detect the predicted 1, 3, 4 and some 5 bp deletions in four patients.
Calculation of information content, Ri, provides a valuable method for predicting effects of splicing mutations. Changes of Ri in this study were very consistent with the results of transcript analysis, including predictions of precise locations and strength of cryptic splice sites. They were generally consistent with the dinucleotide model to the extent that was applicable.
There were also complicated predictions associated with some mutations in the dinucleotide region. Mutations in the acceptor site of exon 5 led to activation of up to 4 cryptic sites (Figure 8). The 20 bp deletion was much stronger than would be expected from the local Ri values in all three cases. In the case of IVS4-1 G>T, deletions of 3, 4, 5 and 20 bp were consistent with the information theory based calculation (Figure 8A). The latter two were indeed detected in the transcript. This supports the notion that absence of the 3 and 4 bp deletions may be due to local interference or binding competition (Smith et al., 1993).
Six predictions were made, involving four wild-type splice sites, of the effects of mutations outside the dinucleotide domains. Four of these were consistent with transcript analysis and found to be pathogenic (Table 1).
True discrepancy between prediction of splice site strength by information content and the results of transcript analysis was only found for the mutation IVS15+3 A>C. Subsequently, a frameshift mutation was found in this patient, making it reasonable to suppose that this mutation is not pathogenic.
Transcript analysis elucidates complex effects of putative splicing mutations. However, this kind of analysis is often not possible due to the limited availability of fresh specimens. To evaluate the effect of splicing mutations more precisely and quantitatively, splicing mutations can be introduced into cells in vitro (Vockley et al., 2000). Such in vitro systems will also enable examination of various factors that can influence the effect of splicing mutations (Nissim-Rafinia et al., 2000). Finding conditions which mitigate the effect of splicing mutations may provide a strategy for developing therapies for genetic diseases. For example, antisense oligonucleotides of cryptic splice sites can be used to suppress aberrant transcripts and thus enhance the normal splicing (Dominski et al., 1994).
Figure 8.
[Figure 6B:] The two mutations, agAT > cgAT (IVS12-2 a>c) and agAT > ggAT (IVS12-2 a>g), weaken this site sufficiently that the mutated exon 12 begins at location 77670, initiated by a formerly cryptic acceptor site of strength 6.8 bits 70 bp upstream. Several weaker acceptor sites between these two are neither used nor modified.
ACKNOWLEDGEMENTS
We acknowledge with thanks the theoretical background and Delila software system, including the Individual Information package, provided by Dr. Thomas D. Schneider of the Molecular Information Theory Group / Center for Cancer Research Nanobiology Program (CCRNP) (formerly the Laboratory of Experimental and Computational Biology) / National Cancer Institute / National Institutes of Health, Frederick, MD. We are also appreciative of the discussions and valuable suggestions provided for this work and manuscript by Dr. Schneider and Dr. Peter Rogan of the University of Western Ontario (formerly of the Laboratory of Human Molecular Genetics, Children's Mercy Hospital & Clinics, Kansas City, MO).
This work was supported in part by the Intramural Research Program of the National Institutes of Health, and in part by the German Cancer Foundation (No. 108793).
REFERENCES
- Arakawa H, Hayashi N, Nagase H, Ogawa M, Nakamura Y. Alternative splicing of the NF2 gene and its mutation analysis of breast and colorectal cancers. Hum Mol Genet. 1994;3:565–568. doi: 10.1093/hmg/3.4.565. [DOI] [PubMed] [Google Scholar]
- Bianchi AB, Hara T, Ramesh V, Gao J, Klein-Szanto AJP, Morin F, Menon AG, Trofatter J, Gusella JF, Seizinger BR, Kley N. Mutations in transcript isoforms of the neurofibromatosis 2 gene in multiple human tumor types. Nat Genet. 1994;6:185–192. doi: 10.1038/ng0294-185. [DOI] [PubMed] [Google Scholar]
- Chomczynski P, Sacchi N. Single-step method of RNA isolation by acid guanidinium thiocyanate-phenol-chloroform extraction. Anal Biochem. 1987;162:156–159. doi: 10.1006/abio.1987.9999. [DOI] [PubMed] [Google Scholar]
- Dominski Z, Kole R. Identification and characterization by antisense oligonucleotides of exon and intron regions required for splicing. Mol Cell Biol. 1994;14:7445–7454. doi: 10.1128/mcb.14.11.7445. [DOI] [PMC free article] [PubMed] [Google Scholar]
- Gutmann DH, Aylsworth A, Carey JC, Korf B, Marks J, Pyetz RE, Rubenstein A, Viskochil D. The diagnostic evaluation and multidisciplinary management of neurofibromatosis 1 and neurofibromatosis 2. J Am Med Assoc. 1997;278:51–57. [PubMed] [Google Scholar]
- Jacoby LB, MacCollin M, Parry DM, Kluwe L, Lynch L, Jones D, Gusella JF. Allelic expression of the NF2 gene in neurofibromatosis 2 and schwannomatosis. Neurogenetics. 1999;2:101–108. doi: 10.1007/s100480050060. [DOI] [PubMed] [Google Scholar]
- Jacoby LB, MacCollin M, Barone R, Ramesh V, Gusella JF. Frequency and distribution of NF2 mutations in schwannomas. Genes Chromosomes & Cancer. 1996;17:45–55. doi: 10.1002/(SICI)1098-2264(199609)17:1<45::AID-GCC7>3.0.CO;2-2. [DOI] [PubMed] [Google Scholar]
- Kluwe L, Bayer S, Baser ME, Hazim W, Haase W, Fünfterer C, Mautner VF. Identification of NF2 germ-line mutations and comparison with neurofibromatosis 2 phenotypes. Hum Genet. 1996;98:534–538. doi: 10.1007/s004390050255. [DOI] [PubMed] [Google Scholar]
- Kluwe L, MacCollin M, Tatagiba M, Thomas S, Hazim W, Haase W, Mautner VF. Phenotypic variability associated with 14 splice-site mutations in the NF2 gene. Am J Med Genet. 1998;77:228–233. [PubMed] [Google Scholar]
- Krawczak M, Reiss J, Cooper DN. The mutational spectrum of single base-pair substitutions in mRNA splice junctions of human genes: causes and consequences. Hum Genet. 1992;90:41–54. doi: 10.1007/BF00210743. [DOI] [PubMed] [Google Scholar]
- Merel P, Hoang-Xuan K, Sanson M, Bijlsma E, Rouleau G, Laurent-Puig P, Pulst S, Baser M, Lenoir G, Sterkers JM, Philippon J, Resche F, Mautner VF, Fischer G, Hulsebos T, Aurias A, Delattre O, Thomas G. Screening for germ-line mutations in the NF2 gene. Genes Chromosomes & Cancer. 1995;12:117–127. doi: 10.1002/gcc.2870120206. [DOI] [PubMed] [Google Scholar]
- Nissim-Rafinia M, Chiba-Falek O, Sharon G, Boss A, Kerem B. Cellular and viral splicing factors can modify the splicing pattern of CFTR transcripts carrying splicing mutations. Hum Mol Genet. 2000;12:1771–1778. doi: 10.1093/hmg/9.12.1771. [DOI] [PubMed] [Google Scholar]
- Parry DM, MacCollin M, Kaiser-Kupfer MI, Pulaski K, Nicholson HS, Bolesta M, Eldridge R, Gusella JF. Germ-line mutations in the neurofibromatosis 2 gene: Correlations with disease severity and retinal abnormalities. Am J Hum Genet. 1996;59:529–539. [PMC free article] [PubMed] [Google Scholar]
- Pykett MJ, Murphy M, Harnish PR, George D. The neurofibromatosis 2 (NF2) tumor suppressor gene encodes multiple alternatively spliced transcripts. Hum Mol Genet. 1994;3:559–564. doi: 10.1093/hmg/3.4.559. [DOI] [PubMed] [Google Scholar]
- Rogan PK, Faux BM, Schneider TD. Information analysis of human splice site mutations. Hum Mutat. 1998;12:153–171. doi: 10.1002/(SICI)1098-1004(1998)12:3<153::AID-HUMU3>3.0.CO;2-I. [DOI] [PubMed] [Google Scholar]
- Ruttledge MH, Andermann AA, Phelan CM, Claudio JO, Han F-y, Chretien N, Rangaratnam S, MacCollin M, Short P, Parry D, Michels V, Riccardi V, Weksberg R, Kitamura K, Brandburn JM, Hall BD, Propping P, Rouleau GA. Type of mutation in the neurofibromatosis type 2 gene (NF2) frequently determines severity of disease. Am J Hum Genet. 1996;59:331–342. [PMC free article] [PubMed] [Google Scholar]
- Schneider TD. Consensus Sequence Zen. Appl Bioinformatics. 2002;1:111–119. [PMC free article] [PubMed] [Google Scholar]
- Schneider TD. Information Content of Individual Genetic Sequences. J Theor Biol. 1997a;189:427–441. doi: 10.1006/jtbi.1997.0540. [DOI] [PubMed] [Google Scholar]
- Schneider TD. Sequence walkers: a graphical method to display how binding proteins interact with DNA or RNA sequences. Nucleic Acids Res. 1997b;25:4408–4415. doi: 10.1093/nar/25.21.4408. [DOI] [PMC free article] [PubMed] [Google Scholar]
- Stephens RM, Schneider TD. Features of spliceosome evolution and function inferred from an analysis of the information at human splice sites. J Mol Biol. 1992;228:1124–1136. doi: 10.1016/0022-2836(92)90320-j. [DOI] [PubMed] [Google Scholar]
- Smith CWJ, Chu TT, Nadal-Ginard B. Scanning and Competition between AGs Are Involved in 3' Splice Site Selection in Mammalian Introns. Mol Cell Biol. 1993;13:4939–4952. doi: 10.1128/mcb.13.8.4939. [DOI] [PMC free article] [PubMed] [Google Scholar]
- Vockley J, Rogan PK, Anderson BD, Willard J, Seelan RS, Smith DI, Liu W. Exon skipping in IVD RNA processing in isovaleric acidemia caused by point mutations in the coding region of the IVD gene. Am J Hum Genet. 2000;66:356–367. doi: 10.1086/302751. [DOI] [PMC free article] [PubMed] [Google Scholar]


