

Abstract
The combinatorial expression of transcription factors frequently marks cellular identity in the nervous system, yet how these factors interact to determine specific neuronal phenotypes is not well understood. Sensory neurons of the trigeminal ganglion (TG) and dorsal root ganglia (DRG) coexpress the homeodomain transcription factors Brn3a and Islet1, and past work has revealed partially overlapping programs of gene expression downstream of these factors. Here we examine sensory development in Brn3a/Islet1 double knock-out (DKO) mice. Sensory neurogenesis and the formation of the TG and DRG occur in DKO embryos, but the DRG are dorsally displaced, and the peripheral projections of the ganglia are markedly disturbed. Sensory neurons in DKO embryos show a profound loss of all early markers of sensory subtypes, including the Ntrk neurotrophin receptors, and the runt-family transcription factors Runx1 and Runx3. Examination of global gene expression in the E12.5 DRG of single and double mutant embryos shows that Brn3a and Islet1 are together required for nearly all aspects of sensory-specific gene expression, including several newly identified sensory markers. On a majority of targets, Brn3a and Islet1 exhibit negative epistasis, in which the effects of the individual knock-out alleles are less than additive in the DKO. Smaller subsets of targets exhibit positive epistasis, or are regulated exclusively by one factor. Brn3a/Islet1 double mutants also fail to developmentally repress neurogenic bHLH genes, and in vivo chromatin immunoprecipitation shows that Islet1 binds to a known Brn3a-regulated enhancer in the neurod4 gene, suggesting a mechanism of interaction between these genes.
Introduction
Neural identity is established by the sequential and combinatorial expression of transcription factors during neurogenesis and differentiation. Knock-out studies in mice have established roles for many of these factors, but little is known about how coexpressed transcription factors interact to regulate the downstream programs of gene expression that define specific neuronal phenotypes. In principle, such combinatorial analysis, applied across developmental time, can yield the transcriptional codes necessary to define neural cell types, such as the sensory neurons examined in the present study.
Somatic sensory neurons innervate the skin and muscles throughout the body, and produce specialized structures and molecular receptors for sensory modalities including pain, touch, temperature, and position. At trunk levels, somatic sensory neurons reside in the dorsal root ganglia (DRG) associated with each spinal segment, and innervate the corresponding dermatomes and myotomes, while at cranial levels, they reside primarily in the trigeminal ganglion (TG) and innervate the facial skin and musculature.
Regulatory factors have been identified that regulate the initial development of generic sensory identity, and also the subsequent differentiation of sensory subtypes. Sensory neurogenesis is known to depend on bHLH factors of the neurogenin (Neurog) class (Fode et al., 1998; Ma et al., 1998, 1999), which in turn activate expression of Neurod class bHLH genes. Following the neurogenic phase, sensory neurons initiate expression of the homeodomain transcription factors Brn3a (product of the Pou4f1 gene) and Islet1 (Fedtsova and Turner, 1995; Eng et al., 2001; Sun et al., 2008). These factors act to terminate the expression of the bHLH genes (Eng et al., 2004, 2007; Lanier et al., 2007; Sun et al., 2008). Neurons lacking either factor also show altered expression of markers of sensory differentiation and subtype specification, such as the Trk-family neurotrophin receptors (McEvilly et al., 1996; Xiang et al., 1996; Huang et al., 1999b; Lei et al., 2006; Sun et al., 2008; Dykes et al., 2010). Although they belong to different homeodomain classes (POU and LIM), the downstream targets of Brn3a and Islet1 show significant overlap, and coexpression of these factors in all sensory neurons has suggested that they form a combinatorial code for sensory development (Anderson, 1999).
Here we examine the functional relationship between Brn3a and Islet1 in the sensory ganglia of Brn3a/Islet1 double knock-out (DKO) embryos. Sensory neurons are generated in DKO embryos, but the DRG fail to migrate to their appropriate ventral position, and both DRG and TG exhibit profound defects in axon growth and targeting. Sensory neurons in DKO embryos express generic neural markers, but remain in an undifferentiated ground state, and fail to differentiate into functional subtypes. Comparison of global gene expression between single knock-out, DKO, and control embryos reveals marked epistasis between Brn3a and Islet1 for nearly all downstream targets, including both redundant and synergistic regulation of different gene classes. A basis for these interactions is suggested by the in vivo binding of Islet1 to conserved enhancers in the Neurod4 gene, which are known to be direct targets of Brn3a regulation.
Materials and Methods
Mice.
Four transgenic alleles were used to generate embryos for this study: a Brn3a null allele (Brn3a−) (Xiang et al., 1996), a Brn3a allele, also functionally null, in which a bovine tau-LacZ expression cassette replaces the Brn3a coding sequence (Brn3atLacZ) (Quina et al., 2005), an Islet1 allele in which the homeodomain is flanked by loxP sites (Islet1F) (Sun et al., 2008), and a conventional Wnt1-Cre transgene, which drives Cre expression in the dorsal neural tube and neural crest (Danielian et al., 1998). Because Wnt1-Cre activity is present in the neural tube by E8.5, before the onset of Islet1 expression in the sensory ganglia, Islet1F/F, Wnt1-Cre neurons should never express Islet1. Nearly complete excision of the Islet1F allele by Wnt1-Cre in embryonic DRG has been previously demonstrated (Sun et al., 2008).
All transgenic alleles were maintained on a C57BL/6 genetic background. Parental mice with the complex genotypes Brn3a+/−, Islet1F/+, Wnt1-Cre and Brn3a+/tLacZ, Islet1F/F were interbred to generate the desired embryonic genotypes, including the following: Brn3atauLacZ/− (Brn3a KO), Islet1F/F, Wnt1-Cre (Islet1 conditional knock-out, CKO), and Brn3atauLacZ/−, Islet1F/F, Wnt1-Cre (double knock-out, DKO). Mice lacking Wnt1-Cre were used as wild type for Islet1 regardless of whether they bore the floxed or native allele. In experiments that used the tauLacZ reporter for tract tracing, embryos with the Brn3a genotype Brn3atLacZ/+ were used as the controls, because prior studies have demonstrated little if any phenotype in Brn3a heterozygotes (Eng et al., 2004, 2007). Noon of the day a mucous plug was observed in mated females was designated as embryonic day 0.5 (E0.5), and embryos were staged by the system of Theiler.
Enzymatic staining, immunofluorescence, in situ hybridization.
Whole mount embryo staining for βgalactosidase activity was performed with X-gal as previously described (Eng et al., 2001). Samples for optical projection tomography (OPT) (Sharpe et al., 2002) were stained with X-gal, dehydrated in graded concentrations of ethanol, then cleared in 1:2 benzyl alcohol/benzyl benzoate. OPT was performed using a Bioptonics 3100M scanner, with data acquired for each specimen through 400 rotational positions.
Immunofluorescence and in situ hybridization were performed in embryonic tissues as previously described (Dykes et al., 2010). Polyclonal rabbit and guinea pig antisera against Brn3a have been previously described (Quina et al., 2005). Other antisera included the following: rabbit anti-Etv1/Er81 and anti-Runx3 (gifts from S. Arber, University of Basel, Basel, Switzerland) (Arber et al., 2000; Kramer et al., 2006), anti-Runx1 (gift from T. Jessell, Columbia University, New York, NY), anti-DRG11 (gift from D. Lima, Faculdade de Medicina do Porto, Porto, Portugal) (Rebelo et al., 2007), anti-caspase-3 (Cell Signal Tech), anti-peripherin (Millipore), anti-Islet1 (Abcam), and monoclonal anti-tubulinβ3 (Covance); guinea pig anti-Sox 10 (gift from M. Wegner, Universitaet Erlangen, Erlangen, Germany) and anti-Islet2 (gift from S. Pfaff, Salk Institute, La Jolla, CA) (Thaler et al., 2004); and goat anti-TrkA, anti-TrkB and anti-TrkC (R&D Systems), anti-cRET (Fitzgerald), and anti-βgalactosidase (Biogenesis). For antibodies generated in research laboratories, tests of the specificity of the antibodies are described in the cited references. The staining patterns observed with the commercial antibodies against receptor tyrosine kinases are consistent with previous reports (Huang et al., 1999a). A cDNA used to generate an in situ hybridization probe for Pirt was obtained from Dr. Xinzhong Dong (Johns Hopkins, Baltimore, MD), other hybridization probe cDNAs were obtained from Open Biosystems; accession numbers are available on request.
Microarray analysis.
Harvest of E12.5 DRG, preparation of mRNA, and microarray analysis using Affymetrix Mouse Genome 430 2.0 were performed as previously described [Sun et al. (2008). Two biologically independent replicates of the set of four genotypes were analyzed, only concordantly expressed and changed transcripts appear in the gene lists. The primary analysis of microarray data, including determination of the absence/presence of the assayed transcripts, transcript expression levels, and the probability of change in transcript expression between samples (“change p”), was performed with Microarray Suite 5.0 (MAS5, Affymetrix). Default MAS5 parameters were used for increase (I) and decrease (D) calls, which were p < 0.002 and p > 0.998 for I and D, respectively. Expression levels was normalized to a value of 500 using global scaling. Microarray probe sets were related to the corresponding mouse transcripts using the NetAffx database (Affymetrix), based on the NCBI Build 37 annotation of the mouse genome.
For the lists presented in Tables 1 and 2 and the epistasis analysis presented in Figure 5, we defined a set of 479 “most changed” transcripts which met all of the following criteria: (1) concordant present (p) call in both samples of at least one genotype; (2) concordant increase (I) or decrease (D) call in both comparisons between control and at least one mutant genotype; and (3) at least threefold change in mean expression between control and at least one mutant genotype. The resulting set of highly changed transcripts were then reviewed for redundancy based on NCBI annotation 37 of the mouse genome, and for genes represented by redundant probe sets, a representative probe set was selected based on highest expression in any genotype.
Table 1.
Increased transcripts
| Gene symbol | Gene title | Fold Change |
||
|---|---|---|---|---|
| Islet1/WT | Brn3a/WT | DKO/WT | ||
| Hoxc9 | Homeobox C9 | 20.4 | 3.8 | 25.7 |
| Gnas | Guanine nucleotide binding protein, α stimulating | 0.9 | 0.7 | 23.7 |
| Eya1 | Eyes absent 1 | 9.4 | 7.8a | 13.9 |
| Lhx1 | LIM homeobox protein 1 | 4.5c | 0.7 | 13.6 |
| Actc1 | Actin, α, cardiac muscle 1 | 6.8 | 3.1 | 13.5 |
| Dmrta2 | Doublesex and mab-3 related txn factor like A2 | 3.1 | 2.2 | 10.8 |
| Nova1 | Neurooncological ventral antigen 1 | 4.0 | 1.2 | 10.7 |
| Lhx2 | LIM homeobox protein 2 | 11.7c | 0.4 | 10.3 |
| Irx3 | Iroquois related homeobox 3 | 1.4 | 4.0 | 9.8 |
| Lilrb3 | Leukocyte immunoglobulin-like receptor, subfamily B | 6.3 | 2.4 | 9.5 |
| Myl1 | Myosin, light polypeptide 1 | 24.8 | 8.3 | 9.5 |
| Cartpt | CART prepropeptide | 4.7 | 11.3 | 9.3 |
| Dlg2 | Discs, large homolog 2 | 2.5 | 2.8 | 9.0 |
| Gbx2 | Gastrulation brain homeobox 2 | 1.0 | 0.6 | 8.7 |
| Npff | Neuropeptide FF-amide peptide precursor | 3.1 | 1.5 | 8.7 |
| Npy | Neuropeptide Y | 3.9 | 1.9 | 8.4 |
| Lbxcor1 | Ladybird homeobox corepressor 1 | 7.4c | 0.7 | 8.4 |
| Nxph4 | Neurexophilin 4 | 2.8 | 0.8 | 8.3 |
| Irx5 | Iroquois related homeobox 5 | 1.5 | 3.8 | 8.1 |
| Dcc | Deleted in colorectal carcinoma | 6.1 | 2.9a | 8.0 |
| Sall3 | Sal-like 3 | 4.9 | 0.2 | 7.9 |
| Clic6 | Chloride intracellular channel 6 | 1.9 | 1.0 | 7.6 |
| Hbb-bh1 | Hemoglobin Z, embryonic | 5.8 | 6.3 | 7.5 |
| Crabp1 | Cellular retinoic acid binding protein I | 7.5 | 1.6 | 7.4 |
| Irs4 | Insulin receptor substrate 4 | 1.1 | 2.0 | 7.4 |
| Mab21l1 | Mab-21-like 1 | 4.7 | 5.4 | 7.3 |
| Rbm24 | RNA binding motif protein 24 | 9.5 | 1.4 | 7.1 |
| Hoxc8 | Homeobox C8 | 3.9 | 2.0 | 7.1 |
| Vstm2a | V-set and transmembrane domain containing 2A | 2.3 | 1.1 | 7.1 |
| Calb2 | Calbindin 2; calretinin | 0.4 | 1.3a | 7.0 |
| Hoxb5 | Homeobox B5 | 3.2 | 3.3 | 6.8 |
| Olig1 | Oligodendrocyte txn factor 1 | 4.2 | 1.4 | 6.6 |
| Ajap1 | Adherens junction associated protein 1 | 4.2 | 7.4 | 6.6 |
| Dab1 | Disabled homolog 1 | 2.4 | 3.0 | 6.4 |
Transcripts with increased expression in Brn3a/Islet1 double knock-out DRG. Increased transcripts are ranked by the fold change in E12.5 DKO DRG relative to a wild-type control. Fold changes are derived from the averages of two biologically independent microarray assays. Numbers in bold indicate replicated significant change p values (p < 0.002, p > 0.998) for the comparison between the stated genotype and control ganglia. Some of the observed changes have been previously confirmed by in situ hybridization, immunofluorescence, or qPCR in the (TG) (a) or DRG (b) of Brn3a KO embryos or the DRG (c) of Islet1 CKO embryos (Eng et al., 2004, 2007; Sun et al., 2007; Lanier et al., 2009; Dykes et al., 2010).
Table 2.
Decreased transcripts
| Gene symbol | Gene title | Fold change |
||
|---|---|---|---|---|
| WT/Islet1 | WT/Brn3a | WT/DKO | ||
| Avil | Advillin | 6.3 | 14.3a | 503 |
| Speer1-ps1 | Spermatogenesis associated E-rich 1, ps1 | 5.8 | 1.8 | 159 |
| Fam19a4 | Tafa4 | 1.8 | 8.7 | 90.6 |
| Bnc1 | Basonuclin 1 | 21.4 | 15.9b | 71.1 |
| Etv4 | Ets variant gene 4 | 8.8 | 1.8 | 57.3 |
| Pou4f1 | POU domain, class 4, txn factor 1; Brn3a | 1.0 | 42.7 | 50.9 |
| Cckar | Cholecystokinin A receptor | 27.6 | 0.9 | 46.7 |
| Gal | Galanin | 13.6c | 14.7a | 39.0 |
| Hoxd1 | Homeobox D1 | 12.1 | 5.4a | 31.7 |
| Gpr64 | G protein-coupled receptor 64 | 1.7 | 4.0b | 26.7 |
| Pou4f2 | POU domain, class 4, txn factor 2; Brn3b | 1.0 | 110a | 26.4 |
| Runx1 | Runt related txn factor 1 | 22.9c | 3.7a,b | 26.3 |
| Ppp1r1c | Protein phosphatase 1, regulatory subunit 1C | 1.6 | 1.2 | 26.2 |
| Pou4f3 | POU domain, class 4, txn factor 3; Brn3c | 1.2 | 4.0 | 23.6 |
| A530088H08Rik | Pirt | 4.7 | 7.3 | 21.3 |
| Pappa2 | Pappalysin 2 | 0.9 | 9.8 | 21.3 |
| Higd1c | HIG1 domain family, member 1C | 4.5 | 3.2 | 20.5 |
| Th | Tyrosine hydroxylase | 8.3c | 1.9a | 15.0 |
| Selected | ||||
| Prrxl1 | Paired related homeobox protein-like 1; Drg11 | 2.5 | 3.6 | 12.8 |
| Isl2 | Insulin related protein 2; Islet 2 | 3.4c | 3.5 | 12.2 |
| Scn7a | Na + channel, voltage-gated, VII α; NAG | 2.3 | 2.9 | 10.9 |
| Fgf13 | Fibroblast growth factor 13 | 3.3 | 3.6 | 10.6 |
| Fam38b | Piezo 2 | 4.5 | 3.2 | 10.6 |
| Etv1 | Ets variant gene 1; Er81 | 3.0 | 1.8 | 9.6 |
| Ntrk3 | Neurotrophic tyr kinase, receptor, type 3; TrkC | 1.0 | 6.1a | 9.2 |
| Cntn2 | Contactin 2; Tag1 | 3.8 | 3.8 | 9.0 |
| Etv5 | Ets variant gene 5; ERM | 3.8 | 2.8 | 8.6 |
| Adcyap1 | Adenylate cyclase activating polypeptide 1; PACAP | 0.9 | 5.0 | 8.4 |
| Prph | Peripherin | 1.5 | 1.2 | 8.1 |
| Trpv1 | Transient receptor potential cation channel, subfamily V, member 1 | 7.3c | 8.3 | 7.2 |
| Ntrk1 | Neurotrophic tyr kinase, receptor, type 1, TrkA | 8.7c | 1.8a | 5.0 |
| Runx3 | Runt related txn factor 3 | 0.8 | 11.4a | 4.2 |
| Scn9a | Na+ channel, voltage-gated IX α; Nav1.7 | 1.9 | 1.8 | 4.0 |
Transcripts with decreased expression in Brn3a/Islet1 double knockout DRG. For details, see Table 1.
Figure 5.

Analysis of epistasis between Brn3a and Islet1 mutations. Epistatic interactions between the Brn3a KO and Islet1 DKO genotypes were examined for 479 transcripts which are at least threefold changed relative to WT in at least one of the three mutant genotypes. A, Two-dimensional epistasis plot in which the x-axis represents the change in expression due to the loss of Brn3a function in the presence of Islet1, based on a the difference between the WT and Brn3a KO expression levels, normalized to the maximum expression in any genotype: (EWT − EB3aKO)/max. The y-axis represents the change in expression due to the loss of Brn3a in the absence of Islet1, based on the difference between the Islet1 CKO and DKO expression levels: (EIsl1CKO − EDKO)/max. Transcripts for which the effects of the Brn3a KO and Islet1 CKO genotypes are additive appear on the diagonal. Transcripts showing negative epistasis are shifted to the left and right of the diagonal, and those showing positive epistasis are shifted above and below the diagonal. B, Individual regulated transcripts exhibit negative epistasis, additive effects, and positive epistasis between the Brn3a KO and Islet1 CKO genotypes. C, Distribution plots of difference values for comparisons between WT and DKO ganglia for the most-changed 479 transcripts and a control set of randomly selected transcripts. D, Histogram plots of distributions of (EWT − EB3aKO)/max and (EIsl1CKO − EDKO)/max. E, Distributions of (EWT − EIsl1KO)/max and (EBrn3aCKO − EDKO)/max. Comparisons of WT to single knock-outs exhibit broader distributions than comparisons between single knock-outs and DKO ganglia, confirming the predominant effect of global negative epistasis. p values are derived from K–S tests and represent the probability of observing the null hypothesis that the distributions do not differ significantly.
As a statistical test of epistasis, we used the expression values for the 479 most changed genes in the first of the two biological replicates. From these data, we generated difference values for each of the pairs of genotypes: EWT − EDKO, EWT − EB3aKO, EIsl1CKO − EDKO, EWT − EIsl1CKO, and EB3aKO − EDKO. All of the difference values were divided by the maximum expression value for that gene in any condition, such that the normalized difference values fell between −1 and 1. Histogram plots of these difference values appear in Figure 5C–E. We then applied a two-sample Kolmogorov–Smirnov test (K–S test) to these distributions. The K–S test is widely used to determine whether two sets of continuous values are significantly different. It is nonparametric and has the advantage of making no assumption about the distribution of data. The probability values from the K–S tests represent the chance of observing the null hypothesis that the distributions do not differ significantly.
Chromatin immunoprecipitation.
Chromatin immunoprecipitation (ChIP) was performed using formalin-fixed TG of wild-type E11.5 mouse embryos using published methods (Lanier et al., 2007). Selection was performed using polyclonal rabbit anti-Islet1 (Abcam #20670-100) bound to anti-rabbit IgG magnetic beads (Dynal, Life Technologies).
Results
Brn3a/Islet1 double mutant mice have profound defects in sensory neuron development
Prior studies have shown that sensory neurons lacking either Brn3a or Islet1 exhibit defects in axon growth and target innervation, and in the case of Islet1, marked cell loss by midgestation. To assess whether the developmental effects of these genes interact, we generated embryos with single and compound mutations of Brn3a and Islet1. To circumvent early embryonic lethality due to cardiac defects in constitutive Islet1 knock-outs, a conditional strategy was used for Islet1, driven by a Wnt1-Cre transgene (Islet1 CKO) (Sun et al., 2008). As expected based on the neonatal lethality of the single knock-outs, Brn3a/Islet1 DKO mice were present in the expected Mendelian frequencies at all embryonic stages, but died shortly after birth. Examination of the DRG of control, Brn3a KO, Islet1 CKO, and DKO embryos at E12.5 (Fig. 1A–D) showed that these factors are coexpressed in most sensory neurons at this stage, that Brn3a and Islet1 do not regulate one another's expression, and that the excision of the conditional Islet1 allele induced by Wnt1-Cre is nearly complete in the Islet1 CKO and DKO embryos.
Figure 1.

Displacement of cranial DRG and loss of peripheral sensory projections in Brn3a/Islet1 DKO embryos. A–D, Immunofluorescence staining for Brn3a and Islet1 expression in the cervical DRG of E12.5 embryos. Wnt1-Cre produces nearly complete excision of Islet1 in the DRG but spinal motor neuron expression is unaffected. E, Distance from dorsal margin of DRG to dorsal margin of spinal cord in control and DKO embryos, showing dorsal displacement of DRG in DKO embryos. F, E12.5 control embryo stained for βgalactosidase activity and imaged using OPT. G–J, Close-up view of the trigeminal system in four genotypes. All branches are diminished and the mandibular branch is nearly absent (arrow, J) in the DKO embryo. An oblique view is shown to avoid the superimposition of bilateral structures. K–N, Close-up of the cervical plexus derived from C2–C5. Lateral view. O–R, Close-up of the brachial plexus and innervation of the forelimb, derived from C5–T1 (posterior view). MN, Motor neurons; BP, brachial plexus; CP, cervical plexus; Op, ophthalmic trigeminal; Mx, maxillary trigeminal branch; Mn, mandibular trigeminal branch; R, radial nerve; M, median nerve; U, ulnar nerve.
At E12.5, the DRG were of normal size and position in Brn3a KO embryos. In Islet1 CKO embryos, the DRG were smaller than controls, consistent with prior studies (Sun et al., 2008), and their position was somewhat variable. In DKO embryos, the DRG were dorsally displaced, with foreshortening of the dorsal roots connecting the DRGs with the dorsal horn of the spinal cord, consistent with a migratory defect in DRG precursors (Fig. 1E).
We then used optical projection tomography (OPT) (Sharpe et al., 2002), a method for acquiring detailed rotational images of small objects, to examine the sensory ganglia and their axonal projections in developing embryos of all four genotypes, using a LacZ reporter expressed from the Pou4f1 locus (Fig. 1F–R, Movie 1). Sensory axon growth into the periphery was disturbed in all three mutant genotypes. In general, these defects showed increasing severity in Brn3a KO, Islet1 CKO, and DKO embryos, respectively. In the TG system of DKO embryos, only the initial segments of the ophthalmic and mandibular branches were present, and axons did not reach their target fields (Movie 1). The maxillary branch/infraorbital nerve was relatively preserved, but innervation of its terminal fields in the future whisker pads was decreased in all three mutant genotypes. These defects were maintained at E14.5 (Fig. 2), by which stage the TG was markedly reduced by cell death in Islet1 CKO embryos.
Figure 2.

The Brn3a/Islet1 compound sensory phenotype at mid-gestation. The profound defects in peripheral innervation noted at E12.5 persist at E14.5 in the DRG (A–D) and the TG (E–H). The size of the ganglia are markedly reduced in Islet1 CKO embryos. In DKO embryos, the DRG are displaced dorsally and the dorsal roots are markedly foreshortened (arrows, D). In DKO embryos, the cervical plexus, brachial plexus, and mandibular branch of the trigeminal nerve (arrow in E–H) are nearly absent. 8g, Vestibulocochlear ganglion; 9g, superior ganglion; C2, cervical DRG 2; T1, thoracic DRG 1; BP, brachial plexus; CP, cervical plexus; Hb, hindbrain; Mn, mandibular branch trigeminal nerve; TG, trigeminal ganglion.
Movie 1.
OPT imaging of WT and Brn3a/Islet1 DKO embryos. Embryos were harvested at E12.5, genotyped, fixed, LacZ-stained, and cleared for OPT as described in Materials and Methods. OPT was used to generate 400 rotational images of each embryo, and 200 such images, representing 180° of rotation, were used to produce the video file. Arrowheads indicate the foreshortened dorsal roots observed in the DKO embryo. CPx, Cervical plexus; BPx, brachial plexus; HB, hindbrain; SC, spinal cord; DRG, dorsal root ganglia; TG, trigeminal ganglion; Mn, mandibular branch, trigeminal system; Mx, maxillary branch, trigeminal system (infraorbital nerve); 8g, vestibulocochlear ganglion; 9g, superior ganglion.
Brn3a KO, Islet1 CKO, and DKO embryos also showed increasingly severe defects in DRG axonal projections. The cervical DRG contribute to the cervical (C2–C5) (Fig. 1K–N) and brachial (C5–T1) (Fig. 1O–R) plexuses innervating the occiput, neck, and upper limb areas. In DKO mice, the initial segments of the ventral rami of the spinal nerves were evident, but labeled sensory axons did not reach the cervical or brachial plexus. At the forelimb level, the radial, median, and ulnar nerves were diminished in Brn3a KO and Islet1 CKO embryos, and absent in the DKO. Similar deficits were seen in the thoracic and lumbar regions (Movie 1), and all of the defects in the DRG and their projections persisted at E14.5 (Fig. 2).
Failure of sensory subtype differentiation in DKO embryos
Developing sensory neurons fated to serve different modalities, including pain, touch, and position, can be distinguished by the expression of specific tyrosine kinase receptors and Runx-family transcription factors, and the initial segregation of these subtypes is evident by E12.5 in the DRG (Kramer et al., 2006; Luo et al., 2007) and TG (Dykes et al., 2010). To determine whether sensory subtype specification takes place in the absence of Brn3a and Islet1, we examined the DRG single KO and DKO embryos at E13.5 for the expression of subtype-specific developmental regulators, including TrkA and Runx1 (nociceptors), TrkB and Ret (mechanoreceptors), and Etv1, TrkC, and Runx3 (various mechanoreceptors and proprioceptors).
Remarkably, the DRG of DKO embryos failed to express any of the examined markers of subtype-specific sensory differentiation (Fig. 3A). A similar loss of subtype specification was observed in the TG of E13.5 embryos (Fig. 3B), except that in the TG, TrkB exhibited persisting, diffuse expression (Huang et al., 1999b; Dykes et al., 2010). Consistent with prior studies, selective or partial loss of some of these markers was observed in the Brn3a and Islet1 single KO ganglia (Huang et al., 1999b; Eng et al., 2004; Sun et al., 2008; Dykes et al., 2010). We then considered that the failure to express markers characteristic of any sensory subtype might represent a general failure of neurogenesis. However, the DRG of DKO embryos appropriately expressed the general neural marker Tubb3 (Tuj1) at only moderately reduced levels. Together these results suggest strong genetic interactions in the developmental effects of Brn3a and Islet1.
Figure 3.
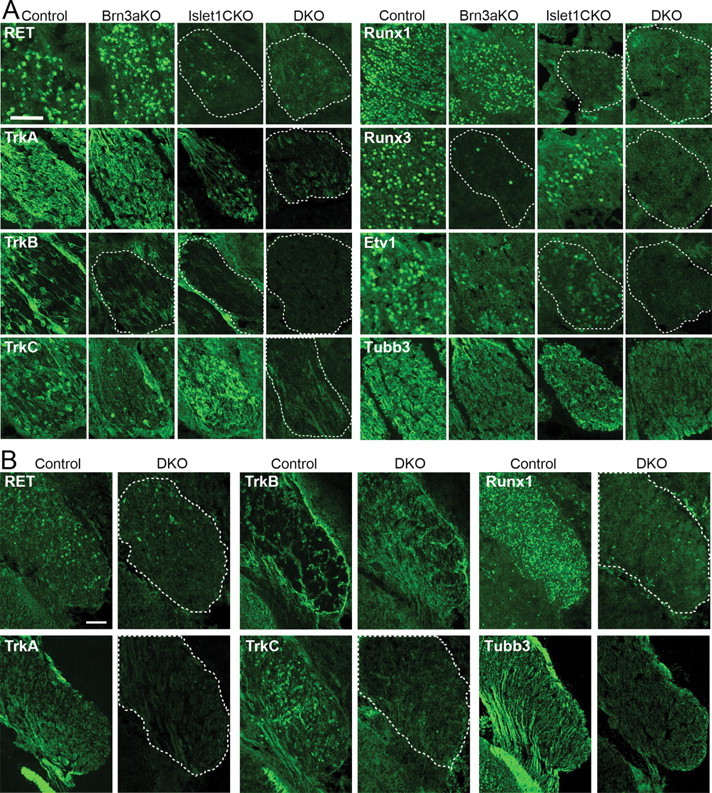
Loss of subtype specification in Brn3a/Islet1 DKO embryos. A, Markers of sensory subtypes were examined by immunofluorescence in matched sagittal sections of cervical DRGs from Brn3a KO, Islet1 CKO, DKO, and control E13.5 embryos. B, Key markers of sensory subtype differentiation were examined in the TG of control and DKO ganglia at E13.5. Horizontal sections are shown. TrkB expression is restricted to specific cells in control ganglia; TrkB expression persists in DKO ganglia but no longer identifies a specific set of cell bodies. Dashed lines indicate location of the DRG in sections in which the fluorescence signal cannot be distinguished from background.
Global analysis of gene expression reveals novel Brn3a/Islet1 regulatory targets
To determine how Brn3a and Islet1 interact to regulate gene expression in the DRG on a genome-wide scale, we performed microarray analysis on Brn3a KO, Islet1 CKO, and DKO embryos and wild-type controls. Because Islet1 CKO embryos show extensive sensory neuron loss in late gestation (Sun et al., 2008), cervical-level DRG from E12.5 embryos were used in the analysis. This analysis confirmed the profoundly decreased expression of nearly all sensory-specific and subtype-specific transcripts in the DKO ganglia (Table 2).
Some of the most-changed transcripts in DKO ganglia have been identified as downstream of Brn3a or Islet1 in prior studies (Tables 1, 2) (Eng et al., 2004, 2007; Sun et al., 2008; Lanier et al., 2009; Dykes et al., 2010). For most of these known targets, the DKO ganglia showed changes in the same direction as the single mutants, but of greater magnitude. However, analysis of the DKO ganglia revealed several novel or unexpected results, and we used immunofluorescence and in situ hybridization to confirm these findings (Fig. 4). Several homeodomain transcription factors showed altered expression in the mutant embryos. A subset of DRG neurons express the transcription factor Islet2, closely related to Islet1, and Islet2 was modestly decreased in both single knock-outs, and nearly absent in DKO embryos. The homeodomain factor Prrx11 (Drg11) showed a significant requirement for both Brn3a and Islet1, with markedly decreased expression in the single mutants and complete loss in the DKO.
Figure 4.

Immunofluorescence and in situ hybridization of novel Brn3a/Islet1 DKO targets. Cervical DRG of E12.5 embryos were examined in single KO, DKO, and control embryos. Antisera for Islet2, Prrxl1, and Brn3b confirmed the loss of these transcription factors in DKO ganglia, while the marker of glial precursors Sox10 was unaffected. Dashed lines indicate the location of DRG in sections in which the signal cannot be clearly distinguished from background.
In situ hybridization confirmed that Brn3a and Islet1 corepress Irx3 (Fig. 4), a homeodomain factor usually expressed in the developing spinal cord but not the DRG. It is one of a large set of transcriptional regulators of spinal cord development that are ectopically expressed in the DRG of DKO embryos (Lhx1, Lhx2, Lbxcor1, Olig1, Olig2, Gbx2) (Tables 1, 2), some of which have been previously reported in Islet1 CKO embryos (Sun et al., 2008). In contrast, expression of Sox10, a marker of DRG precursors which at this developmental stage generate primarily glia, was unaffected.
Many genes with known or potential roles in sensory neuronal function failed to be expressed in DKO ganglia. One example is peripherin (prph), an intermediate neurofilament protein that is expressed in both motor and sensory neurons. Peripherin expression decreased slightly in Brn3a KO and Islet1 CKO ganglia, but was nearly absent in the DKO DRG (Fig. 4). In situ hybridization was used to examine the detailed expression patterns of the decreased transcripts Pirt, Gpr64, Cntn2/Tag1, Fgf13, and Ppp1r1c, all of which were strongly expressed in the control DRG and showed changes in the mutant embryos that confirmed the array results (Fig. 4). Pirt has been recently identified as a functional partner of the capsaicin receptor Trpv1 (Kim et al., 2008), which was also noted to be markedly downregulated in the DKO DRG. Cntn2/Tag1 is a cell adhesion molecule with a known role in sensory axon guidance (Law et al., 2008). Gpr64 has been identified in the male reproductive system (Obermann et al., 2003), but its role in sensory neurons has not been examined. Its expression in a subset of DRG neurons and regulation by Brn3a/Islet1 suggest a role in subtype-specific function. Likewise, these results suggest that Fgf13 and the protein phosphatase regulatory subunit Ppp1r1c may have unknown sensory-specific roles. In contrast, in situ hybridization signal for the increased transcript Hbb-bh1 (data not shown), encoding embryonic hemoglobin Z, showed the expected expression in blood cells, but not in neurons. Increased Hbb-bh1 signal in the microarray analysis of the knock-out ganglia may result from decreased vascular competence in the DRG of mutant embryos.
Brn3a and Islet1 exhibit marked epistasis
The microarray data presented here and in prior studies of Brn3a and Islet1 single mutants show many shared downstream changes in gene expression. For this reason, we examined the patterns of gene expression in the Islet1 CKO, Brn3a KO, and DKO embryos for evidence of epistasis, or interaction between these mutations. In the narrowest sense, epistasis describes a relationship between two gene loci in which the presence of an allele at one locus blocks the phenotypic effects of an allele at the other (Phillips, 2008). In this sense, the first allele is described as epistatic to the second; this relationship has also been described as “negative epistasis.” In quantitative genetic studies, epistasis has also been defined more broadly to include positive interactions between alleles that lead to greater than additive effects on measurable phenotypes such as gene expression (“positive epistasis,” “synergistic epistasis”). In both cases, the compound phenotype deviates from the result expected based on a linear combination of the effects of the individual alleles.
We used these principles as the basis for an approach to characterize epistasis between Brn3a and Islet1 for the most strongly regulated transcripts in single and double mutant embryos. If the effects of Brn3a and Islet1 exhibit a linear additive relationship, then for a given target gene the difference between the WT and Brn3a KO expression levels (EWT, EB3aKO) and the Islet1 CKO and DKO expression levels (EIsl1CKO, EDKO), which represent the contribution of Brn3a to gene expression in the presence and absence of Islet1, should be equal, as indicated by the following equation: EWT − EB3aKO = EIsl1CKO − EDKO. Similarly, negative epistasis should be described by the following inequality: |EWT − EB3aKO| > |EIsl1CKO − EDKO|, while positive epistasis should be described by the following inequality: |EWT − EB3aKO| < |EIsl1CKO − EDKO|.
We then used these relationships to generate a two-dimensional epistasis map in which normalized values for EWT − EB3aKO are represented on the x-axis, and EIsl1CKO − EDKO on the y-axis for the 479 most-changed transcripts in the E12.5 DRG microarray analysis (Fig. 5). The majority of transcripts cluster near the x-axis, indicating a greater effect of the loss of Brn3a expression in the WT than in the Islet1 CKO context. Thus, for the majority of changed transcripts, the Brn3a KO and Islet1 CKO genotypes exhibit negative epistasis (Fig. 5B). These include transcripts of genes that are activated by Brn3a and Islet1 and characterize the core program of subtype specification (e.g., Pirt, Trpv1, Galanin, Ntrk1) and a heterogeneous group of genes repressed by Brn3a (e.g., Cartpt, Ntrk2). For a smaller set of transcripts, the Brn3a and Islet1 KO genotypes show additive effects, and plot on the diagonal of the epistasis map, but in most cases this is because one gene is the predominant regulator and the other has little effect (Pou4f2, Ntrk3, Lbxcor1). Brn3a and Islet1 also contribute additively to the repression of multiple Hox genes (e.g., Hoxb5). Finally, a few regulated genes show strong positive epistasis (Prph, Calb2), the role of Brn3a and Islet1 in their regulation is revealed only in the DKO embryo.
As a statistical test of global epistasis, we examined the distribution of the normalized difference values for pairwise comparisons between genotypes for the 479 most-changed transcripts (Fig. 5C–E). The difference values for WT vs DKO expression yielded a broad bimodal distribution (σ2 = 0.51) with peaks representing increased and decreased transcripts, compared to the narrow distribution exhibited by difference values for a set of randomly selected transcripts (σ2 = 0.08) (Fig. 5C). If Brn3a KO and Islet1 CKO genotypes have additive effects in DKO ganglia, then the distribution of difference values for the EWT − EB3aKO and EIsl1CKO − EDKO comparisons should be similar. Likewise, the distribution of difference values for EWT − EIsl1CKO should be similar to EB3aKO − EDKO. However the actual distribution of values for EWT − EB3aKO (σ2 = 0.29) showed much greater variance than EIsl1CKO − EDKO (σ2 = 0.16) (Fig. 5D), and the distribution of EWT − EIsl1CKO (σ2 = 0.26) was broader than EB3aKO − EDKO (σ2 = 0.18) (Fig. 5E). To test the significance of the differences in these distributions, we used two-sample Kolmogorov–Smirnov (K–S) tests, which yielded p = 1.22 × 10⁻⁹ and p = 4.26 × 10⁻⁹ for the comparisons between these distributions, respectively. The K–S test is widely used to determine whether two sets of continuous values are significantly different. It is nonparametric and has the advantage of making no assumption about the distribution of data. The probability values from the K–S tests represent the chance of observing the null hypothesis that the distributions do not differ significantly. In summary, these results indicate that either the Brn3a or Islet1 single mutant can account for the majority of the effect of the DKO, thus demonstrating negative epistasis as a global phenomenon for the most-changed transcripts. Expression differences in the minority of specific genes for which Brn3a and Islet1 showed strong positive epistasis were not sufficient to overcome this overall effect.
Islet1 interacts directly with known Brn3a-regulated neurogenic enhancers
Previous studies have shown that both Brn3a and Islet1 repress neurogenic bHLH genes of the Neurog and Neurod classes, and are required for the decrease in expression of these genes which occurs between E10.5 and E13.5 in the DRG and TG (Sun et al., 2008; Lanier et al., 2009). Because the normal developmental repression of these genes in wild-type ganglia is not complete until E13.5, only ∼2-fold increased expression of neurogenic genes was observed in microarray analysis of the E12.5 Brn3a KO and Islet1 CKO ganglia reported here. However, in situ hybridization analysis of the E13.5 TG confirmed abnormal expression of Neurod4 in Brn3a KO, Islet1 CKO, and DKO ganglia (Fig. 6A–D). Together these results show that Brn3a and Islet1 are both required to repress Neurod4 expression, that the effects of their knock-outs are less than additive, and that they therefore exhibit negative epistasis.
Figure 6.

Chromatin immunoprecipitation of Islet1 bound to the Neurod4 locus. A–D, In situ hybridization for Neurod4 mRNA in the E13.5 TG. The normal developmental decline in expression observed in the WT TG fails to occur in Brn3a KO, Islet1 CKO or DKO ganglia. E, ChIP was performed using formalin-fixed E11.5 TG and a polyclonal Islet1 antibody (see Materials and Methods). Quantitative PCR was performed using oligonucleotide primer sets spaced at intervals of 0.5–1 kb across the locus (Lanier et al., 2007), and enrichment of the selected over an unselected control sample was analyzed by the cycle threshold method (Livak and Schmittgen, 2001). The fold enrichment relative to input chromatin was normalized to the average of five control sites in the Alb1 (serum albumin) locus, which is not expressed in sensory neurons, as shown by the yellow line (1-fold enrichment). Islet1 ChIP showed two regions of specific selection: in the 5′ UTR −14 to −13 kb upstream and in the single intron 3.2–3.8 kb downstream from the start of transcription (region 1 and region 2, designated by red bars). Mean folds of two selections for each primer pair are shown. The enrichment maxima occurred at −13,397 and +3888. T tests using 3–6 PCR primer pairs and two independent selections were used to assess the significance of enrichment for these regions compared to a control region 3′ to the transcription unit (region 3). Region 1 versus region 3 enrichment, p = 2.4 × 10⁻⁶; region 2 versus region 3 enrichment, p = 4.5 × 10⁻⁵. Region 3 versus alb (albumin) locus, p = 0.85, 0.94 (n.s.). The regions of selection by Islet1 correspond closely to conserved enhancer elements containing known Brn3a binding sites (Lanier et al., 2007).
Several potential mechanisms could account for this epistatic relationship between Brn3a and Islet1, including direct coregulation of the neurod4 locus. Brn3a has previously been shown to bind to conserved upstream and intronic enhancers in the neurod4 locus of embryonic TG neurons (Lanier et al., 2007). In the present study, we used the same qPCR-based tiled chromatin immunoprecipitation (“locus-ChIP”) method to examine Islet1 binding to the neurod4 locus. Locus-ChIP was performed on formalin-fixed TG dissected from wild-type E11.5 embryos using 63 qPCR primer pairs spanning 40 kb of the neurod4 locus (see Materials and Methods). Maximal enrichment occurred for primer pairs at −13,397 and +3888 relative to the neurod4 transcriptional start site, overlapping the enrichment peaks noted for Brn3a selection (maximal enrichment at −12,996, +4410) (Lanier et al., 2007). Although the specific DNA-binding properties of Islet1 relative to other homeodomain proteins have not been described, multiple potential homeodomain (TAAT) binding motifs occur in these regions (Lanier et al., 2007), which may nucleate either Brn3a or Islet1 binding.
Discussion
In this study we have used a conditional genetic strategy to examine the separate and combinatorial roles of two transcription factors, Brn3a and Islet1, which together regulate the core gene expression program of developing sensory neurons at all levels of the neural axis. This and prior studies of Brn3a and Islet1 in the sensory system (Huang et al., 1999b; Eng et al., 2004; Lanier et al., 2007; Sun et al., 2008; Lanier et al., 2009; Dykes et al., 2010) define four essential functions for these factors in which they do the following: (1) repress early regulators of neurogenesis, including bHLH factors of the Neurog and Neurod classes, (2) repress gene expression programs characteristic of other tissues, including expected cell types, such as the dorsal spinal cord and hindbrain, and surprising ones, such as cardiac/cranial mesoderm, (3) create a permissive condition for the expression of Ntrk, Runx, and Ets factors that specify the principal sensory subtypes mediating pain, touch, and proprioception, and (4) activate an extensive set of genes essential for specific sensory functions but not for generic neural differentiation.
The developmental phenotype observed in the sensory system of Brn3a/Islet1 DKO mice, including defective neuronal migration and axonogenesis, is likely to reflect a composite of these defects in gene regulation, rather than the effect of a single target gene. The DRG in these embryos fail to migrate to their correct position and arrest near the dorsal aspect of the spinal cord, especially in the cervical region. It is possible that this represents an aberrant response to dorsal/ventral patterning signals. In mice lacking Shh, an opposite effect is observed, in which TG and DRG neurons migrate excessively, sometimes reaching the floorplate region (Fedtsova et al., 2003). Recently Sema3/neuropilin signaling has been shown to be necessary for correct DRG neuron migration (Schwarz et al., 2009), although the principle effect of disruption of this pathway is the fusion of adjacent DRG, not aberrant dorsoventral migration. We are not aware of a defect in a single signaling pathway that phenocopies the aberrant migration pattern of the DKO ganglia.
Brn3a and Islet1 exhibit epistatic interactions on nearly all of their targets, with a few notable exceptions. Brn3a exclusively regulates the other members of its own class: Brn3b and Brn3c depend completely on Brn3a, and are unaffected in the Islet1 CKO. Islet1 also plays the predominant role in repression of spinal cord/brainstem transcription factors of the Lhx and Olig classes. Finally, these factors have a partially selective role in subtype specification, in that Brn3a and Islet1 are the principal regulators of Runx3 and Runx1 expression, respectively, but loss of both factors is required to completely extinguish expression of these subtype markers.
For nearly all other target gene classes, Brn3a and Islet1 exhibit epistasis, but this does not imply a common mechanism for all downstream effects. The effects of Brn3a and Islet1 knock-outs are less than additive on a majority of the target genes, but for negatively regulated targets, this implies that either factor is sufficient to repress transcription (“redundancy,” e.g., Eya1), while for positively regulated targets, it suggests that both factors are required to activate expression (“cooperativity,” e.g., Trpv1). This may indicate different molecular mechanisms of interaction on positively and negatively regulated targets. In addition, because a large number of the Brn3a/Islet1 regulated genes are themselves transcription factors or other classes of developmental regulators, it is likely that some of the downstream effects are indirect.
The highly conserved roles of the Pou4 and LIM transcription factor classes in sensory development in widely separated phyla are illustrated by the Caenorhabditis elegans Brn3a and Islet1 orthologs, Unc86 and Mec3, which are required for the differentiation of specific touch receptor neurons in nematodes. Unc86 and Mec3 cooperate to regulate the Mec3 gene (Xue et al., 1993) and downstream sensory targets (Duggan et al., 1998), suggesting a model for Brn3a/Islet1 epistasis. However, there is a fundamental difference in the regulatory relationship between Brn3a and Islet1 and their nematode orthologs in that Mec3 expression requires Unc86 in the lineages that generate touch receptor neurons (Finney and Ruvkun, 1990), whereas the generation of Islet1-expressing neurons and Islet1 expression do not depend on Brn3a. Instead, Brn3a and Islet1 are regulated independently and appear to interact only at the target gene level.
Transcription factors regulating neural development are rarely restricted to a single cell type, and whether these factors regulate the same gene expression programs in different cellular contexts remains a central question. Brn3a is expressed in multiple CNS loci, including the spinal cord, inferior olivary nucleus, superior colliculus, red nucleus, and habenula (Fedtsova and Turner, 1995). Global examination of gene expression downstream of Brn3a in the habenula has revealed very few target genes in common with sensory neurons (Quina et al., 2009). Islet1 is not expressed in the habenula, providing a potential explanation for these differences, and it is thus important to consider target genes in other cell types that coexpress Brn3 and Islet factors.
Brn3/Islet interactions have been examined in the only major CNS-derived cell type expressing both factors, the retinal ganglion cell (RGC). In RGCs, the regulatory relationship of Brn3a and Brn3b is reversed compared to sensory neurons such that Brn3b is expressed earlier in development, has more profound effects on RGC gene expression, and is required for the expression of Brn3a (Gan et al., 1996; Erkman et al., 2000; Badea et al., 2009). Both Brn3b and Islet1 knock-out embryos exhibit a partial loss of RGCs, and the DKO phenotype is more severe than either single mutant (Pan et al., 2008).
Array and candidate gene methods have been used to identify genes downstream of Brn3b (Mu et al., 2004; Qiu et al., 2008) and Islet1 (Mu et al., 2008; Pan et al., 2008) in developing RGCs. As in the sensory system, genes downstream of Brn3b and Islet1 overlap considerably in RGCs, yet few of the Brn3/Islet1 targets are conserved between the sensory system and the retina. Brn3a/b and Islet1 knock-outs in both cell types show dysregulation of Neurod-, Irx-, and Lim-class transcription factors, which suggests some conservation of core regulatory programs. However, key identified targets of Brn3b in the retina, including Ablim1, Ebf1, Mstn (Gdf8), Eomes (Tbr2), and Dlx1/2, are not regulated in the DRG, and conversely the large majority of genes downstream of Brn3a and Islet1 in the DRG have not been identified as target genes in RGCs.
How can the Brn3- and Islet-class factors regulate largely distinct gene expression programs in different cell types? It is unlikely that the differences arise from distinct properties of Brn3a and Brn3b proteins, as gene-swapping experiments have shown these to be largely interchangeable, at least in retinal development (Pan et al., 2005). The conventional combinatorial model of gene regulation would imply that specific DNA-binding partners interact with Brn3a/b and Islet1 in each cell type, allowing the discrimination of enhancers in genes expressed specifically in sensory and retinal neurons. However, a recent study of genes that are regulated by Brn3a in the TG, but not the DRG, of Brn3a KO mice suggests a parallel epigenetic mechanism for cell-specific gene regulation (Eng et al., 2007). The TG-specific target genes bear repressive histone marks in the DRG, suggesting that they are constitutively silenced there, and thus cannot be regulated by Brn3a. These results imply that chromatin modifications accumulated during the developmental history of each cell type may control the range of genes available for regulation by a given transcription factor. Sensory and retinal precursors, for example, may have distinct “subgenomes” accessible to Brn3a/b and Islet1, leading to very different loss-of-function effects. In future studies, combined use of global gene expression assays and genome-wide chromatin analysis in diverse cell types may more fully reveal such mechanisms.
Footnotes
This work was supported in part by Department of Veterans Affairs MERIT funding, and NIH awards HD33442, MH065496, and NS064933 (E.E.T.). E.E.T. is a National Alliance for Research on Schizophrenia and Depression Investigator. We thank Drs. S. Arber, T. Jessell, S. Pfaff, D. Lima, and M. Wegner for generous gifts of antibodies, and Dr. Xinzhong Dong for a Pirt cDNA probe. We thank Dr. Timothy Cox and Kenneth Smith of the Seattle Childrens/University of Washington Small Animal Tomographic Analysis Facility for extensive assistance with OPT, and Dr. Toni Hsu for helpful review of this manuscript.
References
- Anderson DJ. Lineages and transcription factors in the specification of vertebrate primary sensory neurons. Curr Opin Neurobiol. 1999;9:517–524. doi: 10.1016/S0959-4388(99)00015-X. [DOI] [PubMed] [Google Scholar]
- Arber S, Ladle DR, Lin JH, Frank E, Jessell TM. ETS gene Er81 controls the formation of functional connections between group Ia sensory afferents and motor neurons. Cell. 2000;101:485–498. doi: 10.1016/s0092-8674(00)80859-4. [DOI] [PubMed] [Google Scholar]
- Badea TC, Cahill H, Ecker J, Hattar S, Nathans J. Distinct roles of transcription factors brn3a and brn3b in controlling the development, morphology, and function of retinal ganglion cells. Neuron. 2009;61:852–864. doi: 10.1016/j.neuron.2009.01.020. [DOI] [PMC free article] [PubMed] [Google Scholar]
- Danielian PS, Muccino D, Rowitch DH, Michael SK, McMahon AP. Modification of gene activity in mouse embryos in utero by a tamoxifen-inducible form of Cre recombinase. Curr Biol. 1998;8:1323–1326. doi: 10.1016/s0960-9822(07)00562-3. [DOI] [PubMed] [Google Scholar]
- Duggan A, Ma C, Chalfie M. Regulation of touch receptor differentiation by the Caenorhabditis elegans mec-3 and unc-86 genes. Development. 1998;125:4107–4119. doi: 10.1242/dev.125.20.4107. [DOI] [PubMed] [Google Scholar]
- Dykes IM, Lanier J, Eng SR, Turner EE. Brn3a regulates neuronal subtype specification in the trigeminal ganglion by promoting Runx expression during sensory differentiation. Neural Dev. 2010;5:3. doi: 10.1186/1749-8104-5-3. [DOI] [PMC free article] [PubMed] [Google Scholar]
- Eng SR, Gratwick K, Rhee JM, Fedtsova N, Gan L, Turner EE. Defects in sensory axon growth precede neuronal death in Brn3a-deficient mice. J Neurosci. 2001;21:541–549. doi: 10.1523/JNEUROSCI.21-02-00541.2001. [DOI] [PMC free article] [PubMed] [Google Scholar]
- Eng SR, Lanier J, Fedtsova N, Turner EE. Coordinated regulation of gene expression by Brn3a in developing sensory ganglia. Development. 2004;131:3859–3870. doi: 10.1242/dev.01260. [DOI] [PubMed] [Google Scholar]
- Eng SR, Dykes IM, Lanier J, Fedtsova N, Turner EE. POU-domain factor Brn3a regulates both distinct and common programs of gene expression in the spinal and trigeminal sensory ganglia. Neural Dev. 2007;2:3. doi: 10.1186/1749-8104-2-3. [DOI] [PMC free article] [PubMed] [Google Scholar]
- Erkman L, Yates PA, McLaughlin T, McEvilly RJ, Whisenhunt T, O'Connell SM, Krones AI, Kirby MA, Rapaport DH, Bermingham JR, O'Leary DD, Rosenfeld MG. A POU domain transcription factor-dependent program regulates axon pathfinding in the vertebrate visual system. Neuron. 2000;28:779–792. doi: 10.1016/s0896-6273(00)00153-7. [DOI] [PubMed] [Google Scholar]
- Fedtsova NG, Turner EE. Brn-3.0 expression identifies early post-mitotic CNS neurons and sensory neural precursors. Mech Dev. 1995;53:291–304. doi: 10.1016/0925-4773(95)00435-1. [DOI] [PubMed] [Google Scholar]
- Fedtsova N, Perris R, Turner EE. Sonic hedgehog regulates the position of the trigeminal ganglia. Dev Biol. 2003;261:456–469. doi: 10.1016/s0012-1606(03)00316-6. [DOI] [PubMed] [Google Scholar]
- Finney M, Ruvkun G. The unc-86 gene product couples cell lineage and cell identity in C. elegans. Cell. 1990;63:895–905. doi: 10.1016/0092-8674(90)90493-x. [DOI] [PubMed] [Google Scholar]
- Fode C, Gradwohl G, Morin X, Dierich A, LeMeur M, Goridis C, Guillemot F. The bHLH protein Neurogenin2 is a determination factor for epibranchial placode-derived sensory neurons. Neuron. 1998;20:483–494. doi: 10.1016/s0896-6273(00)80989-7. [DOI] [PubMed] [Google Scholar]
- Gan L, Xiang M, Zhou L, Wagner DS, Klein WH, Nathans J. POU-domain factor Brn-3b is required for the development of a large set of retinal ganglion cells. Proc Natl Acad Sci U S A. 1996;93:3920–3925. doi: 10.1073/pnas.93.9.3920. [DOI] [PMC free article] [PubMed] [Google Scholar]
- Huang EJ, Wilkinson GA, Fariñas I, Backus C, Zang K, Wong SL, Reichardt LF. Expression of Trk receptors in the developing mouse trigeminal ganglion: in vivo evidence for NT-3 activation of TrkA and TrkB in addition to TrkC. Development. 1999a;126:2191–2203. doi: 10.1242/dev.126.10.2191. [DOI] [PMC free article] [PubMed] [Google Scholar]
- Huang EJ, Zang K, Schmidt A, Saulys A, Xiang M, Reichardt LF. POU domain factor Brn-3a controls the differentiation and survival of trigeminal neurons by regulating Trk receptor expression. Development. 1999b;126:2869–2882. doi: 10.1242/dev.126.13.2869. [DOI] [PMC free article] [PubMed] [Google Scholar]
- Kim AY, Tang Z, Liu Q, Patel KN, Maag D, Geng Y, Dong X. Pirt, a phosphoinositide-binding protein, functions as a regulatory subunit of TRPV1. Cell. 2008;133:475–485. doi: 10.1016/j.cell.2008.02.053. [DOI] [PMC free article] [PubMed] [Google Scholar]
- Kramer I, Sigrist M, de Nooij JC, Taniuchi I, Jessell TM, Arber S. A role for Runx transcription factor signaling in dorsal root ganglion sensory neuron diversification. Neuron. 2006;49:379–393. doi: 10.1016/j.neuron.2006.01.008. [DOI] [PubMed] [Google Scholar]
- Lanier J, Quina LA, Eng SR, Cox E, Turner EE. Brn3a target gene recognition in embryonic sensory neurons. Dev Biol. 2007;302:703–716. doi: 10.1016/j.ydbio.2006.10.050. [DOI] [PMC free article] [PubMed] [Google Scholar]
- Lanier J, Dykes IM, Nissen S, Eng SR, Turner EE. Brn3a regulates the transition from neurogenesis to terminal differentiation and represses non-neural gene expression in the trigeminal ganglion. Dev Dyn. 2009;238:3065–3079. doi: 10.1002/dvdy.22145. [DOI] [PMC free article] [PubMed] [Google Scholar]
- Law CO, Kirby RJ, Aghamohammadzadeh S, Furley AJ. The neural adhesion molecule TAG-1 modulates responses of sensory axons to diffusible guidance signals. Development. 2008;135:2361–2371. doi: 10.1242/dev.009019. [DOI] [PubMed] [Google Scholar]
- Lei L, Zhou J, Lin L, Parada LF. Brn3a and Klf7 cooperate to control TrkA expression in sensory neurons. Dev Biol. 2006;300:758–769. doi: 10.1016/j.ydbio.2006.08.062. [DOI] [PubMed] [Google Scholar]
- Livak KJ, Schmittgen TD. Analysis of relative gene expression data using real-time quantitative PCR and the 2(-Delta Delta C(T)) method. Methods. 2001;25:402–408. doi: 10.1006/meth.2001.1262. [DOI] [PubMed] [Google Scholar]
- Luo W, Wickramasinghe SR, Savitt JM, Griffin JW, Dawson TM, Ginty DD. A hierarchical NGF signaling cascade controls Ret-dependent and Ret-independent events during development of nonpeptidergic DRG neurons. Neuron. 2007;54:739–754. doi: 10.1016/j.neuron.2007.04.027. [DOI] [PubMed] [Google Scholar]
- Ma Q, Chen Z, del Barco Barrantes I, de la Pompa JL, Anderson DJ. Neurogenin1 is essential for the determination of neuronal precursors for proximal sensory ganglia. Neuron. 1998;20:469–482. doi: 10.1016/s0896-6273(00)80988-5. [DOI] [PubMed] [Google Scholar]
- Ma Q, Fode C, Guillemot F, Anderson DJ. Neurogenin1 and neurogenin2 control two distinct waves of neurogenesis in developing dorsal root ganglia. Genes Dev. 1999;13:1717–1728. doi: 10.1101/gad.13.13.1717. [DOI] [PMC free article] [PubMed] [Google Scholar]
- McEvilly RJ, Erkman L, Luo L, Sawchenko PE, Ryan AF, Rosenfeld MG. Requirement for Brn-3.0 in differentiation and survival of sensory and motor neurons. Nature. 1996;384:574–577. doi: 10.1038/384574a0. [DOI] [PubMed] [Google Scholar]
- Mu X, Beremand PD, Zhao S, Pershad R, Sun H, Scarpa A, Liang S, Thomas TL, Klein WH. Discrete gene sets depend on POU domain transcription factor Brn3b/Brn-3.2/POU4f2 for their expression in the mouse embryonic retina. Development. 2004;131:1197–1210. doi: 10.1242/dev.01010. [DOI] [PubMed] [Google Scholar]
- Mu X, Fu X, Beremand PD, Thomas TL, Klein WH. Gene regulation logic in retinal ganglion cell development: Isl1 defines a critical branch distinct from but overlapping with Pou4f2. Proc Natl Acad Sci U S A. 2008;105:6942–6947. doi: 10.1073/pnas.0802627105. [DOI] [PMC free article] [PubMed] [Google Scholar]
- Obermann H, Samalecos A, Osterhoff C, Schröder B, Heller R, Kirchhoff C. HE6, a two-subunit heptahelical receptor associated with apical membranes of efferent and epididymal duct epithelia. Mol Reprod Dev. 2003;64:13–26. doi: 10.1002/mrd.10220. [DOI] [PubMed] [Google Scholar]
- Pan L, Yang Z, Feng L, Gan L. Functional equivalence of Brn3 POU-domain transcription factors in mouse retinal neurogenesis. Development. 2005;132:703–712. doi: 10.1242/dev.01646. [DOI] [PubMed] [Google Scholar]
- Pan L, Deng M, Xie X, Gan L. ISL1 and BRN3B co-regulate the differentiation of murine retinal ganglion cells. Development. 2008;135:1981–1990. doi: 10.1242/dev.010751. [DOI] [PMC free article] [PubMed] [Google Scholar]
- Phillips PC. Epistasis—the essential role of gene interactions in the structure and evolution of genetic systems. Nat Rev Genet. 2008;9:855–867. doi: 10.1038/nrg2452. [DOI] [PMC free article] [PubMed] [Google Scholar]
- Qiu F, Jiang H, Xiang M. A comprehensive negative regulatory program controlled by Brn3b to ensure ganglion cell specification from multipotential retinal precursors. J Neurosci. 2008;28:3392–3403. doi: 10.1523/JNEUROSCI.0043-08.2008. [DOI] [PMC free article] [PubMed] [Google Scholar]
- Quina LA, Pak W, Lanier J, Banwait P, Gratwick K, Liu Y, Velasquez T, O'Leary DD, Goulding M, Turner EE. Brn3a-expressing retinal ganglion cells project specifically to thalamocortical and collicular visual pathways. J Neurosci. 2005;25:11595–11604. doi: 10.1523/JNEUROSCI.2837-05.2005. [DOI] [PMC free article] [PubMed] [Google Scholar]
- Quina LA, Wang S, Ng L, Turner EE. Brn3a and Nurr1 mediate a gene regulatory pathway for habenula development. J Neurosci. 2009;29:14309–14322. doi: 10.1523/JNEUROSCI.2430-09.2009. [DOI] [PMC free article] [PubMed] [Google Scholar]
- Rebelo S, Reguenga C, Osório L, Pereira C, Lopes C, Lima D. DRG11 immunohistochemical expression during embryonic development in the mouse. Dev Dyn. 2007;236:2653–2660. doi: 10.1002/dvdy.21271. [DOI] [PubMed] [Google Scholar]
- Schwarz Q, Maden CH, Davidson K, Ruhrberg C. Neuropilin-mediated neural crest cell guidance is essential to organise sensory neurons into segmented dorsal root ganglia. Development. 2009;136:1785–1789. doi: 10.1242/dev.034322. [DOI] [PMC free article] [PubMed] [Google Scholar]
- Sharpe J, Ahlgren U, Perry P, Hill B, Ross A, Hecksher-Sørensen J, Baldock R, Davidson D. Optical projection tomography as a tool for 3D microscopy and gene expression studies. Science. 2002;296:541–545. doi: 10.1126/science.1068206. [DOI] [PubMed] [Google Scholar]
- Sun Y, Dykes IM, Liang X, Eng SR, Evans SM, Turner EE. A central role for Islet1 in sensory neuron development linking sensory and spinal gene regulatory programs. Nat Neurosci. 2008;11:1283–1293. doi: 10.1038/nn.2209. [DOI] [PMC free article] [PubMed] [Google Scholar]
- Thaler JP, Koo SJ, Kania A, Lettieri K, Andrews S, Cox C, Jessell TM, Pfaff SL. A postmitotic role for Isl-class LIM homeodomain proteins in the assignment of visceral spinal motor neuron identity. Neuron. 2004;41:337–350. doi: 10.1016/s0896-6273(04)00011-x. [DOI] [PubMed] [Google Scholar]
- Xiang M, Gan L, Zhou L, Klein WH, Nathans J. Targeted deletion of the mouse POU-domain gene Brn-3a causes a selective loss of neurons in the brainstem and trigeminal ganglion, uncoordinated limb movement, and impaired suckling. Proc Natl Acad Sci U S A. 1996;93:11950–11955. doi: 10.1073/pnas.93.21.11950. [DOI] [PMC free article] [PubMed] [Google Scholar]
- Xue D, Tu Y, Chalfie M. Cooperative interactions between the Caenorhabditis elegans homeoproteins UNC-86 and MEC-3. Science. 1993;261:1324–1328. doi: 10.1126/science.8103239. [DOI] [PubMed] [Google Scholar]