

Abstract
Infusion into skin using hollow microneedles offers an attractive alternative to hypodermic needle injections. However, the fluid mechanics and pain associated with injection into skin using a microneedle have not been studied in detail before. Here, we report on the effect of microneedle insertion depth into skin, partial needle retraction, fluid infusion flow rate and the co-administration of hyaluronidase on infusion pressure during microneedle-based saline infusion, as well as on associated pain in human subjects. Infusion of up to a few hundred microliters of fluid required pressures of a few hundred mmHg, caused little to no pain, and showed weak dependence on infusion parameters. Infusion of larger volumes up to 1 mL required pressures up to a few thousand mmHg, but still usually caused little pain. In general, injection of larger volumes of fluid required larger pressures and application of larger pressures cause more pain, although other experimental parameters also played a significant role. Among the intradermal microneedle groups, microneedle length had little effect; microneedle retraction lowered infusion pressure but increased pain; lower flow rate reduced infusion pressure and kept pain low; and use of hyaluronidase also lowered infusion pressure and kept pain low. We conclude that microneedles offer a simple method to infuse fluid into the skin that can be carried out with little to no pain.
Keywords: flow conductivity, hollow microneedle, infusion pressure, intradermal injection, pain, saline
1. INTRODUCTION
Medical injections and infusions are conventionally carried out using hypodermic needles typically targeting delivery to the subcutaneous, intramuscular, intravascular or other spaces. Limitations of injection using hypodermic needles is that they cause pain and apprehension in patients, generate biohazardous sharps waste, and require trained medical personnel [1-3].
Injections into the skin are sometimes desirable not only for local treatment of dermatological and other disorders, but also for increased vaccine immunogenicity, faster drug pharmacokinetics and other advantages of skin targeting [4-6]. However, intradermal injections using the conventional Mantoux technique with a hypodermic needle require specially trained medical personnel and are unreliable [7]. Alternatively, applying a drug topically for absorption into the skin is severly limited by the barrier properties of skin’s outer protective layer of stratum corneum [8].
To address these limitations, we and others have studied the use of hollow microneedles as a simple and reliable method to inject fluids into the skin [9-17]. Hollow microneedles are typically < 2 mm long and assembled as individual needles or multi-needle arrays. They can be fabricated out of a variety of materials, including metal, polymer and glass, using a number of different microfabrication methods, many of which are suitable for low-cost mass production. Solid microneedles have also been developed as piercing structures that increase skin permeability and thereby deliver drug from a topical patch or from the needle itself using drug enapsulated within or coated onto the microneedles [18, 19].
Previous studies with hollow microneedles have demonstrated intradermal injection of influenza vaccine in human subjects and, using a now-approved product, have shown dose sparing in normal human subjects and increased immunogenicity in the elderly [20-22]. Recent work has also administered insulin to human diabetic subjects and shown that microneedle injection was preferred over subcutaneous infusion and that pharmacokinetics were faster when insulin was administered to the skin compared to the subcutaneous space [6].
Despite demonstrated applications of hollow microneedles, there has been no detailed study of the fluid mechanics of injection into skin using microneedles. While the resistance to fluid flow within the microneedle is relatively small [23], the skin itself can provide significant resistance to flow [12, 24]. The skin’s dermis is a dense matrix consisting of a continuous phase (e.g. water, electrolytes) within a network of coarse fixed elements such as collagen fibrils and elastin, as well as fibrous molecules such as glycosaminoglycans, and proteoglycan core proteins that are imobilized by collagen mesh [4]. All these materials together offer dermal resistance to fluid flow [25, 26]. This resistance can be reduced by co-injection of hyaluronidase, which is an enzyme that degrades hyaluronic acid in the extracellular matrix of the skin [27]. Further resistance to flow when using microneedles has been reported due to compression of dermal tissue during microneedle insertion into the skin. Partial retraction of the needle to relieve this compression was shown to decrease resistance to fluid flow into skin [24, 28].
There is also a paucity of data regarding the level of pain caused by injection into skin using microneedles and how injection parameters affect it. The skin has a vast network of nerves, which can potentially be stimulated by fluid injection. Several cutaneous branches of spinal and cranial nerves pass through the subcutaneous space into the dermis, where the axons spread to form three horizontal plexuses [29]. The papillary plexus lies in the papillary layer, just below the epidermis (at the dermal-epidermal junction) and consists of Merkel receptors and Meissner’s corpuscles which are usually sensitive to touch and pressure [30]. The dermal plexus lies within the dense reticular dermis. The subcutneous plexus lies in the hypodermis [29]. Several free nerve endings which are sensitive to pain lie in the subcutaneous tissues and the dermis, and a few extend to the cells of the epidermis. The free nerve endings in the dermis run parallel to the skin’s surface whereas the nerve endings near the epidermis typically lie perpendicular to the skin’s surface [31]. The subcutaneous and dermal layers also contain several additional nerve corpuscles and receptors with larger receptive fields. Pain associated with hypodermic needle injection is typically stimulated by deeper nerve receptors instead of superficial receptors [32].
In order to use hollow microneedles for clinical applications, it is essential to understand the fluid mechanics during injection into skin and control the injection process by optimizing microneedle operating parameters. It is also important to understand the effect of these parameters on patient pain perception. The objective of this study was to determine the effect of microneedle insertion depth, needle retraction, infusion flow rate, and the presence of hyaluronidase on infusion pressure during microneedle-based fluid infusion, as well as on associated pain.
2. METHODS
2.1. Microneedle device
Hollow microneedles were fabricated by pulling fire-polished type I borosilicate glass pipettes (BF150-86-15, Sutter Instrument, Novato, CA) with a micropipette puller (P-97, Sutter Instrument), beveled at a 30° angle (BV-10 beveler, 104D fine bevel plate, Sutter Instrument) and steam sterilized in an autoclave (Scientific Series 3021-S, AMSCO Erie, PA), as described previously [6] (Fig. 1). Microneedles were inserted into the skin using a custom rotary device, also described previously [6]. Using this device, the microneedle was precisely “drilled” into the skin to the desired depth guided by the graded markings on the microneedle device.
Figure 1.

Needles used for intradermal infusion. Microneedles measuring (a) 500 μm, (b) 750 μm, (c) 1 mm and (d) 4 mm in length. (e) Hypodermic needle with intradermal bevel (26 gauge). All images are shown at the same magnification and obtained by brightfield microscopy.
A syringe pump (NE-1000, New Era Systems, Farmingdale, NY) housing a 10 mL syringe (Becton Dickinson, Franklin Lakes, NJ) was connected to the microneedle by means of flexible infusion tubing (Mallinckrodt - three way stopcock with 12-inch pressure tube, Tyco Healthcare, Pleasanton, CA and 2C5685, Baxter, Deerfield, IL). A digital manometer (DigiMano, Netech, Hicksville, NY) was placed in line to measure the pressure associated with infusion.
A digital video-camera (PV-GS380 MiniDV Camcorder, Panasonic, Secaucus, NJ) was used to capture continuous readings on the manometer and the movements of the syringe plunger. The video-camera data were converted to 1-s interval image files by using the batch capture feature in Adobe Premiere Elements 4.0 (Adobe, San Jose, CA). The pressure readings were obtained every second by reading the corresponding captured image files. The volume delivered was determined by measuring the displacement of the plunger every 200 μL in pixels (Adobe Photoshop CS3, Adobe).
2.2. Study Subjects
Ten healthy adult subjects (1 female, 9 male) were recruited to participate in this study. Subjects with diseased or abnormal skin and/or known hypersensitivity to hyaluronidase enzyme were not included in the study. The study was approved by the Georgia Institute of Technology and Emory University Institutional Review Boards and all subjects provided informed consent prior to participation. The study was carried out in accordance with the Declaration of Helsinki protocol and was performed at Emory University under the supervision of a physician.
2.3. Experimental Design
This was a non-randomized, single-blinded study. A total of 9 sites were identified on the volar forearms of subjects (left side: 5, right side: 4) and were marked as T1 through T9 (Table 1). Sites T1-T4 were infused with sterile saline (0.9% sodium chloride injection, USP, Hospira, Lake Forest, IL) at a flow rate of 0.3 mL/min using a hollow microneedle at various depths ranging from 500 μm (intradermal) to 4 mm (subcutaneous). At site T5, a 26-gauge intradermal-bevel hypodermic needle (Becton Dickinson) was inserted into the skin using the standard Mantoux technique for intradermal delivery of sterile saline at 0.3 mL/min. At site T6, a hollow microneedle was first inserted to a depth of 1 mm into the skin and then retracted back to 500 μm after approximately 5 s, and then infusion was carried out at that depth. At sites T7 and T8, microneedles were inserted into the skin at a depth of 750 μm. Once inserted, sterile saline was infused at flow rates of 1 mL/min (fast) and 0.1 mL/min (slow). For the last site, T9, hyaluronidase (Hylenex recombinant solution, Baxter, Deerfield, IL) was delivered at a flow rate of 0.3 mL/min through a microneedle insereted into the skin at a depth of 750 μm.
Table 1.
Experimental conditions for the nine treatment sites
| Group | Insertion depth (μm) | Flow rate (mL/min) |
|---|---|---|
| T1 | 500 | 0.3 |
| T2 | 750 | 0.3 |
| T3 | 1000 | 0.3 |
| T4 | 4000 | 0.3 |
| T5 | intradermal1 | 0.3 |
| T6 | 1000 / 500 2 | 0.3 |
| T7 | 750 | 1.0 |
| T8 | 750 | 0.1 |
| T9 | 750 | 0.3 (hyaluronidase)3 |
A 26-gauge, intradermal-bevel hypodermic needle was used to inject intradermally using the Mantoux technique.
A microneedle was inserted to a depth of 1000 μm and then retracted to a depth of 500 μm before injection.
A solution of hyaluronidase was injected, instead of saline.
2.4. Assessment of Pain
Subjects were asked periodically to assess the pain associated with microneedle insertion and fluid infusion, as described below. These pain scores were measured using a Visual Analog Scale (VAS) consisting of a 100 mm ruler with “No Pain” written on the left end and “Worst Imaginable Pain” on the right end [33]. To measure pain, subjects were asked to slide a marker along the ruler to the location corresponding to his or her pain. An un-blinded observer recorded the pain score in millimeters by reading the number corresponding to the marker position. At the very end of each delivery procedure, the subject was asked to rate the overall delivery procedure as causing “no pain”, “no pain to mild pain”, “mild pain”, “mild to moderate pain”, “moderate pain”, “moderate to severe pain”, “severe pain” or “worst possible pain” (i.e., the VAS was not used for this final assessment).
2.5. Experimental Procedure
After obtaining informed consent and ensuring subjects met the study inclusion/exclusion criteria, the subject was seated and asked to place his/her arms beneath a curtain barrier such that the subject was unable to see the experimental procedure. The subject’s forearms were wiped with 70% isopropyl alcohol swabs followed by marking an outline of the treatment sites with a fine black marker using a custom-made stencil to ensure consistent spacing and location of the treatment sites among subjects. The skin sites were then imaged using an ultrasound skin imaging device that allowed visualization of the different layers of the skin in a non-invasive manner (DermaScan C, Cortex Technology, Denmark). The sites were once again wiped with isopropanol swabs, ensuring that the marker outline was not erased.
The subject was then informed that the first treatment procedure was about to begin. Treatments were carried out in a non-randomized order from T1 to T9. The needle/microneedle was inserted into the skin and the subject was asked to indicate the pain associated with needle insertion by using the VAS pain scale. The pain score was recorded and the scale marker was moved back to the zero position by the study investigator.
The syringe pump was then turned on and infusion began as per the flow rate corresponding to the treatment site. Continuous pressure and volume measurements were taken via continuous video imaging of the manometer and syringe. Upon infusion of 0.2 mL of fluid, the subject was again asked to rate the pain associated with infusion using the VAS scale. Keeping the VAS marker in the same position as the 0.2 mL score, the subject was asked to slide the maker in either direction upon infusion of 0.4, 0.6, 0.8, and 1 mL, respectively.
Upon delivery of 1 mL of fluid, the pump was stopped. The needle was slowly removed from the skin and then the subject was asked to rate the pain caused by the overall delivery procedure. The treatment site skin layers were re-imaged using the ultrasound Dermascan device. The treatment procedure was then repeated for the remaining sites at their corresponding depths and flow rates using the appropriate injection solution.
2.6. Statistical Methods
Comparisons between two treatment conditions were carried out using Student’s t-test. Comparisons between three or more conditions were carried out using one- and two-way analysis of variance (ANOVA) for one and two factors, respectively. Tukey’s post-hoc pairwise comparisons were performed to compare which factor levels led to significant differences. In all cases p < 0.05 was considered significant. NCSS 2007 (NCSS, Kaysville, UT), Minitab (Minitab, State College, PA), and Microsoft Excel 2007 (Microsoft, Redmond, WA) were used to perform the analyses.
3. RESULTS AND DISCUSSION
3.1. Infusion pressure
3.1.1. Effect of microneedle insertion depth
To study the effect of microneedle insertion depth into the skin on infusion fluid mechanics, we injected saline through microneedles inserted at 90° into the skin at 500 μm (T1; Fig. 1a), 750 μm (T2; Fig. 1b), and 1 mm (T3; Fig 1c) depths and into the subcutaneous space at 4 mm depth (T4; Fig. 1d) at a constant flow rate of 0.3 mL/min. A hypodermic needle (T5; Fig. 1e) was also inserted into the dermis almost parallel to the skin’s surface using the Mantoux technique [15].
As shown in Fig. 2a, intradermal microneedle delivery (T1-T3) led to an increase in pressure as more saline volume was delivered into the skin. Pressures reached as high as 3000 mmHg upon delivery of the entire 1 mL dose, but injection of a more typical intradermal injection volume of 0.1 mL required a maximum pressure of less than 100 mmHg. There were no significant differences (one-way ANOVA; p > 0.05) in pressures at any of the volumes between the three intradermal depths indicating that regardless of the insertion depth, the dermal resistance to flow is the same at a given flow rate.
Figure 2.

Effect of microneedle insertion depth on (a) infusion pressure and (b) pain score as a function of infusion volume. Microneedles were inserted into the skin at T1 = 500 μm (▲), T2 = 750 μm (■) and T3 = 1 mm (○). A microneedle was inserted into the subcutaneous space at T4 = 4 mm (△). A hypodermic needle T5 (●) was also inserted intradermally. All infusions were performed at the medium saline flow rate of 0.3 mL/min. Visual analog score (VAS) for pain was normalized relative to the pain caused by intradermal insertion of the hypodermic needle. Data are the average of 10 replicates expressed as mean ± SD.
Insertion of microneedles into the hypodermis at 4 mm (T4) led to an initial increase in pressure that was similar to intradermal injection using microneedles up to a volume of ~0.6 mL (T1-T3) (one-way ANOVA; p > 0.05). For injection of larger volumes, the pressures generally stabilized (Student’s t-test; p > 0.05) and then declined (Student’s t-test; p > 0.05 for comparison between 0.9 and 1 mL). This led to a significant difference in pressures between the intradermal microneedle sites (T1-T3) and the subcutaneous microneedle site (T4) during the last 0.3 mL of injection (one-way ANOVA, Tukey’s post-hoc comparison; p < 0.05). This stabilization in infusion pressure during subcutaneous delivery is probably due to the loose tissue network of the subcutaneous space and due to the large volume available for interstitial fluid in the hypodermis compared to the dermis.
Injection into the dermis via a hypodermic needle (Mantoux method, T5) also initially followed the profile of the microneedle injection into dermis (T1-T3) up to delivery of 0.3 mL (one-way ANOVA; p > 0.05). However, after that, the pressures remained relatively constant at a pressure of ~300 mmHg (one-way ANOVA; p > 0.05). The pressure for T5 was significantly less than that of T1-T3 throughout the infusion procedure beyond 0.3 mL (one-way ANOVA; p > 0.05).
This observation appears to contradict the hypothesis that the dermis offers high resistance to fluid flow. However, it must be noted that hypodermic needle (T5) insertion and flow occurred at an orientation almost parallel to the skin whereas microneedle insertion and flow occurred perpendicular to the skin surface. The dermal fibers are generally aligned parallel to the skin’s surface and fluid flow in the same orientation as the fibers offers significantly less resistance than flow perpendicular to the dermal fibers [26]. Therefore, hypodermic needle-based fluid flow (T5), which was almost in the same orientation as the dermal fibers, is expected to experience less resistance to flow. On the other hand, hollow microneedle-based infusion (T1-T3) occurred perpendicular to the fiber orientation and hence these fibers offered higher resistance to flow.
In addition, the perpendicular insertion of microneedles (T1-T3) has been shown to cause compression and compaction of the dense coiled fibers in the dermis. This compaction leads to a decrease in hydration (due to pushing away of interstitial fluid between the immobile, solid dermal components) and tissue porosity, which causes an increase in pressure and flow resistance [25, 28, 34]. The hypodermic needle (T5) is not expected to cause this tissue compression.
Finally, the hypodermic needle is much longer and penetrates through much more tissue than the microneedle. This increased tissue trauma may weaken the skin and thereby make it more susceptible to further fracture through crack propagation [35], thereby creating voids (i.e., blisters) into which fluid can flow. Less-traumatic microneedles may initiate fewer cracks in skin microstructure and thereby make crack propagation and void formation less likely. This hypothesis of increased tissue damage when using a hypodermic needle is supported by the higher pain scores reported in Fig. 2b and discussed further below.
3.1.2. Effect of microneedle infusion volume
For all injections shown in Figure 2a, the pressure increased gradually for the first few hundred microliters at levels independent of the needle type of depth (T1-T5). Because most intradermal injection in current clinical use (e.g., Bacillus Calmette-Guerin (BCG) vaccination, allergy testing, local anesthesia) involves similarly small volumes, this suggests that intradermal injection using a microneedle requires applying a pressure similar to a conventional subcutaneous or intradermal injection, which is can easily be applied by hand.
In the case of the intradermal microneedles (T1-T3), the pressure increases more steeply after approximately 0.5 mL, which indicates a change in local fluid mechanics in the skin. We hypothesize that initially when fluid flows out of the microneedle, it first flows into the less-dense papillary dermis located above the microneedle orifice leading to stretching of the skin and a progressive increase in fluid pressure. Flow into this layer of skin appears to expand to accommodate approximately 0.5 mL of fluid, which results in the familiar formation of a raised skin wheal (as shown below). Larger volumes of fluid are forced into the deeper, denser reticular dermis layers below the needle tip, which have been compacted due to compression from the needle and therefore require greater pressures for fluid infusion.
3.1.3. Effect of microneedle retraction
Previous in vitro studies have shown that microneedle insertion into the dermis followed by partial retraction out of the skin reduces the resistance to fluid infusion due to de-compression of the dermal tissue that was compacted during perpendicular needle insertion [24, 28]. Because skin elasticity and tension conditions in vitro poorly mimic in vivo conditions, we tested the effect of partial microneedle retraction in human subjects in this study.
Saline was infused at a rate of 0.3 mL/min through a microneedle that had been inserted 1 mm into the dermis for approximately 5 s and then retracted to 500 μm. Figure 3a, shows that infusion pressure for the retracted needle (T6) increased up to a volume of 0.6 mL in a manner indistinguishable from infusion using non-retracted needles inserted to 500 μm (T1) or 1 mm (T3) (two-way ANOVA; p > 0.05). However, at larger infusion volumes, the pressure did not increase significantly for the retracted microneedle (T6) (one-way ANOVA; p > 0.05), which was significantly different from the two non-retracted needles (T1, T3) (two-way ANOVA; p < 0.05). Delivery of 1 mL with retraction (T6) required a pressure less than half of that required when using non-retracted microneedles (T1, T3). Infusion pressure using a retracted microneedle (T6) was significantly greater than when using an intradermal hypodermic needle (T5) (one-way ANOVA; p < 0.05).
Figure 3.

Effect of microneedle retraction on (a) infusion pressure and (b) pain score as a function of infusion volume. Microneedles were inserted into the skin at T1 = 500 μm (▲), T3 = 1 mm (○) and T6 = 1 mm followed by retraction back to 500 μm (◇). A hypodermic needle T5 (●) was also inserted intradermally. All infusions were performed at the medium saline flow rate of 0.3 mL/min. Visual analog score (VAS) for pain was normalized relative to the pain caused by intradermal insertion of the hypodermic needle. Data are the average of 10 replicates expressed as mean ± SD.
We hypothesize that retraction had no effect on infusion pressure up to 0.6 mL because fluid primarily flowed into the papillary dermis, as discussed above. However, infusion of larger volumes was significantly easier when using a retracted microneedle, because of the reduced tissue compaction enable by retraction, which made flow into the reticular dermis easier, as show in previous in vitro studies [24, 28]. An alternate explanation could involve increased tissue trauma and crack propagation enabled by the small pocket created by microneedle retraction. This hypothesis of increased tissue damage when using a retracted microneedle is supported by the higher pain scores reported in Fig. 3b and discussed further below.
3.1.4. Effect of infusion flow rate
To determine the effect of infusion rate on skin fluid mechanics, saline was injected into the dermis at a depth of 750 μm at three different flow rates of 0.1 mL/min (T8 = slow), 0.3 mL/min (T2 = medium), and 1 mL/min (T7 = fast). As seen in Fig. 4a, the slow flow rate (T8) saw an increase in pressure until 0.7 mL was infused, after which the pressure stabilized (one-way ANOVA; p > 0.05). This can be explained by formation of a steady state, where the infusion pressure became high enough to drive fluid away from the site of injection at a rate equal to the infusion flow rate into the skin (i.e., a pressure of 1500 – 2000 mmHg is sufficient to flow fluid away from the injection site at a rate of 0.1 mL/min.
Figure 4.

Effect of infusion flow rate on (a) infusion pressure and (b) pain score as a function of infusion volume. Microneedles were inserted into the skin at 750 μm and saline was infused at rates of T8 = 0.1 mL/min (◆), T2 = 0.3 mL/min (■), and T7 = 1 mL/min (□). Visual analog score (VAS) for pain was normalized relative to the pain caused by intradermal insertion of the hypodermic needle. Data are the average of 10 replicates expressed as mean ± SD.
Infusion at the medium flow rate (T2) led to a continuous increase in pressure that followed a steeper slope beyond approximately 0.5 mL, as discussed above in the context of Fig. 2a. Infusion at the fast flow rate (T7) required higher pressures than the slower flow rates (T2, T8) beyond 0.4 mL (one-way ANOVA, Tukey’s post-hoc comparison; p < 0.05). The need for higher pressure to drive faster flow rates is consistent with the basic physics of fluid flow.
At the fast flow rate, pressure peaked at almost 4000 mmHg (at 0.9 mL), after which the pressure suddenly stabilized (Student’s t-test; p > 0.05). We hypothesize that this sudden stabilization might be due to tissue damage in the dermis caused by the high fluid pressure within the skin. Most subjects reported a sharp piercing pain at this high pressure (discussed below), which further validates our hypothesis that tissue damage may have occurred.
3.1.5. Effect of hyaluronidase
Because the enzyme hyaluronidase is known to degrade hyaluronic acid, which is present in the extracellular matrix of skin, and thereby reduce infusion pressure [27], we studied the effects of hyaluronidase during intradermal infusion using microneedles. As shown in Fig. 5a, the pressure associated with hyaluronidase infusion (T9) increased up to 0.6 mL, beyond which pressure did not significantly change (one-way ANOVA; p > 0.05). In contrast, the saline infusion pressure at the same flow rate (T2) continued to rise, as seen above in Fig. 2a. This reduction in pressure by hyaluronidase shows that dermal microstructures can expand to accommodate a few hundred microliters of fluid, but that breakdown of the extracellular matrix in dermis is helpful to accommodate additional fluid up to 1 mL.
Figure 5.

Effect of hyaluronidase on (a) infusion pressure and (b) pain score as a function of infusion volume. Microneedles were inserted into the skin at 750 μm and T2 = saline (■) and T9 = hyaluronidase (*) were infused at a rate of 0.3 mL/min. Visual analog score (VAS) for pain was normalized relative to the pain caused by intradermal insertion of the hypodermic needle. Data are the average of 10 replicates expressed as mean ± SD.
3.2. Microneedle Insertion Pain
Analysis of pain associated with microneedle injection is important to patient acceptance and can additionally provide insight into mechanisms of fluid flow in skin. We therefore asked subjects to rate the pain they felt using the VAS scale at the time of needle insertion into the skin and periodically during fluid infusion.
We first report the pain associated with microneedle insertion, retraction, and hypodermic needle insertion. Fig. 6 shows that all microneedle-based intradermal insertions, including needle insertion followed by retraction, were less painful than the hypodermic intradermal needle control insertion (one-way ANOVA, Tukey’s post-hoc comparison; p < 0.05). The 4 mm subcutaneous microneedle insertion was as painful as the hypodermic needle insertion (Student’s t-test; p > 0.05). These hollow microneedle results are consistent with previous reports that insertion of solid microneedles into skin is less painful that hypodermic needles [36, 37].
Figure 6.
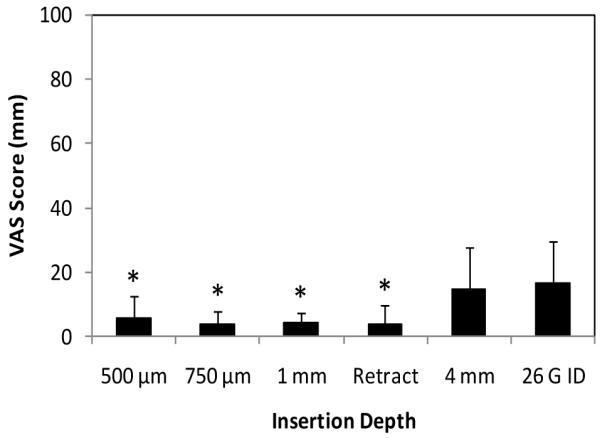
Absolute VAS pain scores associated with insertion of microneedles into skin. Pain scores are reported on a 100-mm VAS scale for insertion of microneedles to 500 μm, 750 μm, 1 mm and 4 mm depths and to 1 mm depth followed by 500 μm retraction. A 26 gauge hypodermic needle was also inserted. Data are the average of 10 replicates expressed as mean ± SD, except for 750 μm, where pain scores from T2, T7, T8 and T9 were averaged based on 40 replicates. * p < 0.05.
3.3. Fluid infusion pain
While needle insertion into skin can cause pain, injection of fluid into the skin can also be painful. We therefore asked subjects to rate the pain they felt during infusion at 200 μl intervals. The pain scores were normalized relative to the hypodermic needle insertion scores and plotted as a function of volume.
3.3.1. Effect of microneedle insertion depth and infusion volume
The effect of needle depth and infusion volume on infusion pain was studied at a constant flow rate of 0.3 mL/min. As shown in Fig. 2b, the pain for all three intradermal microneedle infusions (T1-T3) were not significantly affected by insertion depth or infusion volume up to 0.8 mL (two-way ANOVA; p > 0.05). At all of these conditions, the pain scores were significantly lower than the pain associated with intradermal insertion of a hypodermic needle (i.e., the pain score against which all measurements were normalized) (Student’s t-test; p < 0.05).
At the deeper insertion depths (T2, T3), there was a significant increase in pain associated with infusion beyond 0.8 mL (one-way ANOVA, Tukey’s post-hoc comparison; p < 0.05), which had a pain score similar to that of intradermal hypodermic needle insertion (Fig. 6) (Student’s t-test; p > 0.05). This increase in pain could be due to fluid flowing into the deeper dermis under high pressure, which stimulated pain receptors in the dermal plexus. The increased pain beyond infusion of 0.8 mL was described by subjects as slight burning, which suggests that mechanical receptors in the dermis were stimulated, as they are responsible for eliciting burning sensation [4].
Subcutaneous infusion through the 4 mm microneedle (T4) led to pain scores that were similar to the pain level associated with needle insertion (Fig. 6) (one-way ANOVA; p > 0.05); independent of infusion volume (one-way ANOVA; p > 0.05); and significantly higher than the pain of infusion through intradermal microneedles (T1-T3) up to an infusion volume of 0.8 mL (one-way ANOVA; p < 0.05).
Intradermal infusion through the hypodermic needle (T5) led to pain scores that were lower than the pain associated with needle insertion (Fig. 6) for the first 0.4 mL (one-way ANOVA, Tukey’s post-hoc comparison; p < 0.05). During infusion beyond 0.4 mL, pain scores increased with volume and were statistically indistinguishable from the pain score associated with needle insertion (one-way ANOVA; p > 0.05). Intradermal infusion through the hypodermic needle (T5) was significantly more painful than intradermal infusion through microneedles (T1-T3) at infusion volumes between 0.4 mL – 0.8 mL (two-way ANOVA, Tukey’s post-hoc comparison; p < 0.05) and statistically indistinguishable from the subcutaneous microneedle (T4) (two-way ANOVA, Tukey’s post-hoc comparison; p < 0.05).
3.3.2. Effect of microneedle retraction
Pain scores during infusion using a retracted microneedle increased with infusion volume, as shown in Fig. 3b (one-way ANOVA, p < 0.05). Pain score markedly increased at 0.6 mL, which is also the point at which the infusion pressure began to stabilize (Fig. 3a). The retraction delivery pain scores were significantly higher than the T1 and T3 scores for the 0.6 mL and 0.8 mL measurements (one-way ANOVA, p < 0.05). This is probably because fluid was initially accommodated by the skin independent of the effects of retraction. However, as the infusion pressure continued to the rise, the tear in skin created by the needle retraction expanded, possibly leading to tissue damage that facilitated fluid flow and also caused pain.
3.3.3. Effect of infusion flow rate
Fig. 4b shows effect of infusion flow rate on pain. Over the 10-fold range in flow rates considered, there was no significant difference in pain scores, except at the final measurement (1 mL), where pain at the low flow rate (T8) was significantly less than at the high flow rate (T7) (two-way ANOVA, Tukey’s post-hoc comparison; p < 0.05). Pain at the low flow rate (T8) did not significantly change as a function of volume (one-way ANOVA, p > 0.05), and pain at the medium (T2) and high (T7) flow rates only increased significantly at the final measurement (1 mL) (one-way ANOVA, Tukey’s post-hoc comparison; p < 0.05). At the high flow rate (T7), 70% of subjects reported a sharp, piercing sensation during infusion of the last 0.2 mL, which suggests that there was tissue damage. As mentioned above, infusion pressure suddenly stabilized at this same point (Fig. 4a), which is consistent with the tissue damage hypothesis.
3.3.4. Effect of hyaluronidase
As seen in Fig. 5b, pain scores during infusion of hyaluronidase (T9) did not significantly change with infusion volume (one-way ANOVA; p > 0.05) and was not significantly different from the pain associated with infusion of saline (T2), expect at the final measurement (1 mL), where saline infusion was more painful than hyaluronidase (two-way ANOVA, Tukey’s post-hoc comparison; p < 0.05). We hypothesize that this is because the hyaluronidase reduced the infusion pressure (Fig. 5a) and thereby reduced the need to form micro-cracks in the tissue which could be painful.
3.4. Relationship between pain and pressure
We hypothesize that pain is associated with high infusion pressure, which may act directly to stimulate pain receptors or may act indirectly by causing tissue damage. As shown in Fig. 7, there is not a simple relationship between infusion pressure and pain. However, if the sets of data points corresponding to each experimental group (T1-T9) are examined separately, there is a general trend of pain increasing with pressure.
Figure 7.
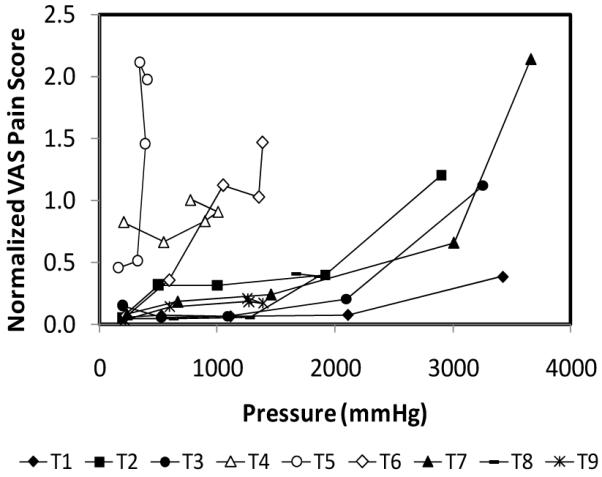
Scatter plot representation of the normalized VAS pain scores for all experimental conditions as a function of infusion pressure. See Table 1 for definitions of groups. Data are obtained from Figs. 2 – 6 and represent the average of 10 replicates expressed as mean ± SD.
Upon further inspection, high levels of pain (i.e., VAS > 1) occur at low pressure (i.e., < 1500 mmHg) only for the subcutaneous microneedle (T4), intradermal hypodermic needle (T5) and retracted microneedles (T6), which are all depicted with white data points on the graph to emphasize this point. The large needles used in groups T4 and T5 and the formation of a tissue pocket during retraction in group T6 are all believed to lead to increased tissue damage, which can explain the higher pain levels at lower pressures.
The remaining microneedles groups (T1-T3, T7-T9) all fall in a more narrow band of data points that only correspond to high pain levels (VAS > 1) at high pressures (> 2500 mmHg), with the notable exception of the shortest microneedle group (T1), which maintained a low pain score even at a pressure of almost 3500 mmHg.
3.5 Overall perception of pain
Upon completion of infusion for each treatment site, subjects were asked to rate their perception of pain for the overall infusion procedure ranging from no pain to worst possible pain. As shown in Fig. 8, all microneedle treatment sites (all sites except T5) were rated as being no more than mildly painful by at least 70% of subjects. The 500 μm-long microneedle (T1), slow flow rate (T8) and infusion using hyaluronidase (T9) were rated as no more than mildly painful by 90% of subjects. In contrast, only 30% rated the hypodermic needle (T5) this way. Moreover, 30-40% of the subjects rated the 500 μm-long microneedle (T1) and slow flow rate (T8) delivery procedures to cause no pain at all. No intradermal microneedle procedures were considered to be more than moderately painful.
Figure 8.
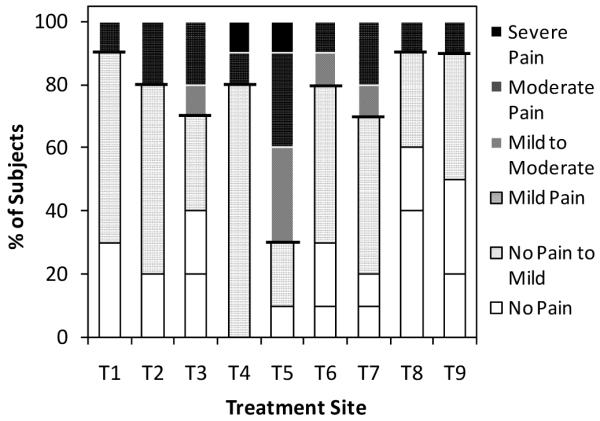
Overall perception of pain for the nine treatments (as defined in Table 1). Subjects were asked to rate the overall pain associated with insertion and infusion for each treatment as: no pain, no pain to mild pain, mild pain, mild to moderate pain, moderate pain, moderate to severe pain, severe pain, or worst possible pain. Each bar represents the input from 10 subjects.
3.6. Skin observation
Before and after each treatment, all skin sites were visually examined and imaged by photography and ultrasound echography, as shown in Fig. 9. Visual observation immediately after infusion revealed that all sites with the exception of subcutaneous injection (T4) were characterized by the formation of a skin wheal or bleb (i.e., raised skin surface due to stretching of the skin) indicating that fluid was delivered within the skin. Formation of such a wheal is a well known characteristic of intradermal injections [38]. Raised local blanching was also seen at the injection site. The wheal completely subsided within 2 h for all treatment sites. All 9 treatment sites experienced slight erythema which was mostly resolved within 2 h and completely resolved in 24 h. The hypodermic needle site also experienced punctate redness at the needle insertion site which resolved within 24-48 h.
Figure 9.

Photographs and ultrasound echographs of skin before and after microneedle-based infusion. For each treatment (as defined in Table 1), the upper pair of images displays a photograph of the skin surface (on the left) and an echograph of the skin thickness (on the right) taken before infusion. The lower pair of images displays a photograph of the skin surface immediately after infusion (on the left) and an echograph of the skin thickness ~5 min after infusion (on the right). The bright white line on the top of the echographs represents the epidermis; the green layer below it depicts the dermis; and the black region below the dermis is hypodermis. The regions of red and yellow in the dermis represent areas of higher acoustic reflection corresponding to denser tissue. Red arrows indicate black space between epidermis and dermis with low acoustic reflection, which are believed to correspond to saline pools. Yellow arrows indicate black spaces corresponding to possible saline pools within the dermis.
Fig. 9 also shows ultrasound echographs that noninvasively image the skin. The thin bright white line at the topmost part of the image corresponds to the epidermis; the green layer (with regions of red and yellow) below it is the dermis; and the black area below the dermis is the hypodermis. Comparison of echographs from before and after fluid infusion for all intradermal microneedle sites (T1-T3, T6-T9) shows a thicker dermis and a curved skin surface after infusion. The thicker dermis can be explained by skin swelling as a result of fluid injection within the dermis and the curved structure represents the curvature of the skin wheal. The subcutaneous delivery site does not show these characteristics, which is consistent with the expectation that fluid was delivered to the hypodermis.
Continued inspection shows that most intradermal images also exhibit a thin dark region between the epidermis and dermis after infusion (illustrated by red arrows in Fig. 9). We hypothesize that this dark space represents saline pooled at the dermal/epidermal junction and the papillary dermis. Dark spaces are also seen within the dermis after infusion for all intradermal delivery sites, which we interpret as pools of saline as well. The dark spaces for the echographs of 500 μm (T1), 750 μm (T2) and 1 mm (T3) microneedle infusions (yellow arrows) show a trend of moving deeper in the dermis for longer microneedles.
3.7. Discussion
This paper presents the first study examining the fluid mechanical properties of injection into skin using microneedles as a function of microneedle insertion depth, needle retraction, infusion flow rate, and the presence of hyaluronidase. We also provide the first detailed study of pain levels reported during fluid infusion into the skin using microneedles.
When injecting volumes up to a few hundred microliters as typically done in clinical practice [39], microneedle length, retraction, flow rate and use of hyaluronidase had no significant effect on the pressure required to infuse into skin or on the associated pain, which was low. The pressure increased as a function of volume over the range of a few hundred mmHg in a manner similar to intradermal injection using a hypodermic needle. Insertion of a microneedle into the skin was less painful that inserting a hypodermic needle.
If it is necessary to inject larger volumes approaching 1 mL, intradermal microneedles required up to a few thousand mmHg pressure, but still generally caused little pain. In contrast, intradermal injection using a hypodermic needle required much lower pressures, but caused significantly more pain. In general, injection of larger volumes of fluid required larger pressures and application of larger pressures caused more pain, although other experimental parameters also played a significant role. Among the intradermal microneedle groups, microneedle length still had little effect; microneedle retraction lowered infusion pressure but increased pain; reduced flow rate lowered infusion pressure and kept pain low; and use of hyaluronidase also lowered infusion pressure and kept pain low. Overall perception of pain from the treatments were lowest when using a short microneedle (T1), slow flow rate (T8) and hyaluronidase (T9).
Mechanistically, we observed that skin can accommodate a few hundred microliters of fluid by stretching to form a bleb at moderate pressures and little pain. Increasing infusion volume up to 1 mL cannot be accommodated as easily by the skin and therefore requires much greater pressures that appear to cause more extreme tissue deformation and possible tissue damage, as suggested by reported pain. The greatest pain was associated with use of a hypodermic needle, retracted microneedle and infusion of the largest volume (1 mL) at the fastest flow rate (1 mL/min).
4. CONCLUSIONS
In conclusion, microneedles offer a simple method to infuse fluid into the skin. For volumes up to a few hundred microliters, infusion pressure and reported pain depend less on microneedle design and operating parameters, and injections can be carried out with little or no pain. To inject larger volumes, shorter needles, slower flow rates and the possible use of hyaluronidase can be used to inject up to 1 mL into the skin while keeping reported pain low.
ACKNOWLEDGEMENTS
We thank James Norman for providing Figure 1 and Donna Bondy for administrative support. This work was carried out at the Center for Drug Design, Development and Delivery and the Institute for Bioengineering and Biosciences at the Georgia Institute of Technology. This work was supported in part by the National Institutes of Health (NIH). The NIH played no role in the design, conduct, interpretation or publication of this work. MRP serves as a consultant and is an inventor on patents licensed to companies developing microneedle-based products. This potential conflict of interest has been disclosed and is being managed by Georgia Tech and Emory University.
Footnotes
Publisher's Disclaimer: This is a PDF file of an unedited manuscript that has been accepted for publication. As a service to our customers we are providing this early version of the manuscript. The manuscript will undergo copyediting, typesetting, and review of the resulting proof before it is published in its final citable form. Please note that during the production process errors may be discovered which could affect the content, and all legal disclaimers that apply to the journal pertain.
REFERENCES
- [1].Hanas R. Reducing injection pain in children and adolescents with diabetes: a review of indwelling catheters. Pediatr Diabetes. 2004;5:102–11. doi: 10.1111/j.1399-543X.2004.00048.x. [DOI] [PubMed] [Google Scholar]
- [2].WHO . Safety of Injections: Global Facts and Figures (WHO/EHT 04/563 04) World Health Organization; Geneva: 2004. [Google Scholar]
- [3].Arendt-Nielsen L, Egekvist H, Bjerring P. Pain following controlled cutaneous insertion of needles with different diameters. Somatosens Mot Res. 2006;23:37–43. doi: 10.1080/08990220600700925. [DOI] [PubMed] [Google Scholar]
- [4].Bolognia JL, Jorizzo JL, Rapini RP. Dermatology. 2nd ed. Mosby; St. Louis: 2003. [Google Scholar]
- [5].Glenn GM, Kenney RT. Mass vaccination: solutions in the skin. Curr Top Microbiol Immunol. 2006;304:247–68. doi: 10.1007/3-540-36583-4_14. [DOI] [PubMed] [Google Scholar]
- [6].Gupta J, Felner EI, Prausnitz MR. Rapid pharmacokinetics of intradermal insulin administered using microneedles in type 1 diabetes subjects. Diabetes Technol Ther. 2011 doi: 10.1089/dia.2010.0204. in press. [DOI] [PMC free article] [PubMed] [Google Scholar]
- [7].Howard A, Mercer P, Nataraj HC, Kang BC. Bevel-down superior to bevel-up in intradermal skin testing. Ann Allergy Asthma Immunol. 1997;78:594–6. doi: 10.1016/s1081-1206(10)63222-x. [DOI] [PubMed] [Google Scholar]
- [8].Prausnitz MR, Langer R. Transdermal drug delivery. Nat Biotechnol. 2008;26:1261–8. doi: 10.1038/nbt.1504. [DOI] [PMC free article] [PubMed] [Google Scholar]
- [9].Lin L, Pisano AP. Silicon processed microneedles. J MEMS. 1999;8:78–84. [Google Scholar]
- [10].Gardeniers JGE, Luttge R, Berenschot JW, de Boer MJ, Yeshurun Y, Hefetz M, et al. Silicon micromachined hollow microneedles for transdermal liquid transport. J MEMS. 2003;6:855–62. [Google Scholar]
- [11].McAllister DV, Wang PM, Davis SP, Park J-H, Canatella PJ, Allen MG, et al. Microfabricated needles for transdermal delivery of macromolecules and nanoparticles: fabrication methods and transport studies. Proc Natl Acad Sci U S A. 2003;100:13755–60. doi: 10.1073/pnas.2331316100. [DOI] [PMC free article] [PubMed] [Google Scholar]
- [12].Sivamani RK, Stoeber B, Wu GC, Zhai H, Liepmann D, Maibach H. Clinical microneedle injection of methyl nicotinate: stratum corneum penetration. Skin Res Technol. 2005;11:152–6. doi: 10.1111/j.1600-0846.2005.00107.x. [DOI] [PubMed] [Google Scholar]
- [13].Stoeber B, Liepmann D. Arrays of hollow out-of-plane microneedles for drug delivery. J MEMS. 2005;15:472–9. [Google Scholar]
- [14].Wang PM, Cornwell M, Hill J, Prausnitz MR. Precise microinjection into skin using hollow microneedles. J Invest Dermatol. 2006;126:1080–7. doi: 10.1038/sj.jid.5700150. [DOI] [PubMed] [Google Scholar]
- [15].Laurent PE, Bonnet S, Alchas P, Regolini P, Mikszta JA, Pettis R, et al. Evaluation of the clinical performance of a new intradermal vaccine administration technique and associated delivery system. Vaccine. 2007;25:8833–42. doi: 10.1016/j.vaccine.2007.10.020. [DOI] [PubMed] [Google Scholar]
- [16].Roxhed N, Samel B, Nordquist L, Griss P, Stemme G. Painless drug delivery through microneedle-based transdermal patches featuring active infusion. IEEE Trans Biomed Eng. 2008;55:1063–71. doi: 10.1109/TBME.2007.906492. [DOI] [PubMed] [Google Scholar]
- [17].Burton SA, Ng CY, Simmers R, Moeckly C, Brandwein D, Gilbert T, et al. Rapid intradermal delivery of liquid formulations using a hollow microstructured array. Pharm Res. 28:31–40. doi: 10.1007/s11095-010-0177-8. [DOI] [PMC free article] [PubMed] [Google Scholar]
- [18].Prausnitz MR, Mikszta JA, Cormier M, Andrianov AK. Microneedle-based vaccines. Curr Top Microbiol Immunol. 2009;333:369–93. doi: 10.1007/978-3-540-92165-3_18. [DOI] [PMC free article] [PubMed] [Google Scholar]
- [19].Donnelly RF, Raj Singh TR, Woolfson AD. Microneedle-based drug delivery systems: microfabrication, drug delivery, and safety. Drug Deliv. 2010;17:187–207. doi: 10.3109/10717541003667798. [DOI] [PMC free article] [PubMed] [Google Scholar]
- [20].Arnou R, Icardi G, De Decker M, Ambrozaitis A, Kazek MP, Weber F, et al. Intradermal influenza vaccine for older adults: A randomized controlled multicenter phase III study. Vaccine. 2009;27:7304–12. doi: 10.1016/j.vaccine.2009.10.033. [DOI] [PubMed] [Google Scholar]
- [21].Van Damme P, Oosterhuis-Kafeja F, Van der Wielen M, Almagor Y, Sharon O, Levin Y. Safety and efficacy of a novel microneedle device for dose sparing intradermal influenza vaccination in healthy adults. Vaccine. 2009;27:454–9. doi: 10.1016/j.vaccine.2008.10.077. [DOI] [PubMed] [Google Scholar]
- [22].Arnou R, Eavis P, Pardo JR, Ambrozaitis A, Kazek MP, Weber F. Immunogenicity, large scale safety and lot consistency of an intradermal influenza vaccine in adults aged 18-60 years: Randomized, controlled, phase III trial. Hum Vaccin. 6:346–54. doi: 10.4161/hv.6.4.10961. [DOI] [PubMed] [Google Scholar]
- [23].Martanto W, Smith MK, Baisch SM, Costner EA, Prausnitz MR. Fluid dynamics in conically tapered microneedles. AICHE J. 2005;51:1599–607. [Google Scholar]
- [24].Martanto W, Moore JS, Kashlan O, Kamath R, Wang PM, O’Neal JM, et al. Microinfusion using hollow microneedles. Pharm Res. 2006;23:104–13. doi: 10.1007/s11095-005-8498-8. [DOI] [PubMed] [Google Scholar]
- [25].Levick JR. Flow through interstitium and other fibrous matrices. Q J Exp Physiol. 1987;72:409–37. doi: 10.1113/expphysiol.1987.sp003085. [DOI] [PubMed] [Google Scholar]
- [26].Swartz MA, Fleury ME. Interstitial flow and its effects in soft tissues. Annu Rev Biomed Eng. 2007;9:229–56. doi: 10.1146/annurev.bioeng.9.060906.151850. [DOI] [PubMed] [Google Scholar]
- [27].Frost GI. Recombinant human hyaluronidase (rHuPH20): an enabling platform for subcutaneous drug and fluid administration. Expert Opin Drug Deliv. 2007;4:427–40. doi: 10.1517/17425247.4.4.427. [DOI] [PubMed] [Google Scholar]
- [28].Martanto W, Moore JS, Couse T, Prausnitz MR. Mechanism of fluid infusion during microneedle insertion and retraction. J Control Release. 2006;112:357–61. doi: 10.1016/j.jconrel.2006.02.017. [DOI] [PubMed] [Google Scholar]
- [29].Kiernan JA. Barr’s The Human Nervous System: An Anatomical Viewpoint. 9th ed. Lippincott, Williams and Wilkins; Philadelphia: 2009. [Google Scholar]
- [30].Kandel ER, Schwartz JH, Jessell TM. Principles of Neural Science. 4th ed. McGraw-Hill; New York: 2000. [Google Scholar]
- [31].Palastanga N, Field D, Soames R. Anatomy and Human Movement: Structure and Function. 5th ed. Elsevier; London: 2006. [Google Scholar]
- [32].Gajraj NM, Pennant JH, Watcha MF. Eutectic mixture of local anesthetics (EMLA) cream. Anesth Analg. 1994;78:574–83. [PubMed] [Google Scholar]
- [33].Jensen MP, Chen C, Brugger AM. Interpretation of visual analog scale ratings and change scores: a reanalysis of two clinical trials of postoperative pain. J Pain. 2003;4:407–14. doi: 10.1016/s1526-5900(03)00716-8. [DOI] [PubMed] [Google Scholar]
- [34].Bert J, Reed RK. Hyaluronan, hydration and flow conductivity of rat dermis. Biorheology. 1998;35:211–9. doi: 10.1016/S0006-355X(99)80008-0. [DOI] [PubMed] [Google Scholar]
- [35].Pereira BP, Lucas PW, Swee-Hin T. Ranking the fracture toughness of thin mammalian soft tissues using the scissors cutting test. J Biomech. 1997;30:91–4. doi: 10.1016/s0021-9290(96)00101-7. [DOI] [PubMed] [Google Scholar]
- [36].Gill HS, Denson DD, Burris BA, Prausnitz MR. Effect of microneedle design on pain in human volunteers. Clin J Pain. 2008;24:585–94. doi: 10.1097/AJP.0b013e31816778f9. [DOI] [PMC free article] [PubMed] [Google Scholar]
- [37].Haq MI, Smith E, John DN, Kalavala M, Edwards C, Anstey A, et al. Clinical administration of microneedles: skin puncture, pain and sensation. Biomed Microdevices. 2009;11:35–47. doi: 10.1007/s10544-008-9208-1. [DOI] [PubMed] [Google Scholar]
- [38].Springhouse . Portable LPN: The All-in-One Reference for Practical Nurses. Lippincott, Williams & Wilkins; Philadelphia: 2005. [Google Scholar]
- [39].Evans-Smith P. Lippincott’s Photo Atlas of Medication Administration. 2nd ed. Lippincott, Williams & Wilkins; Philadelphia: 2006. [Google Scholar]