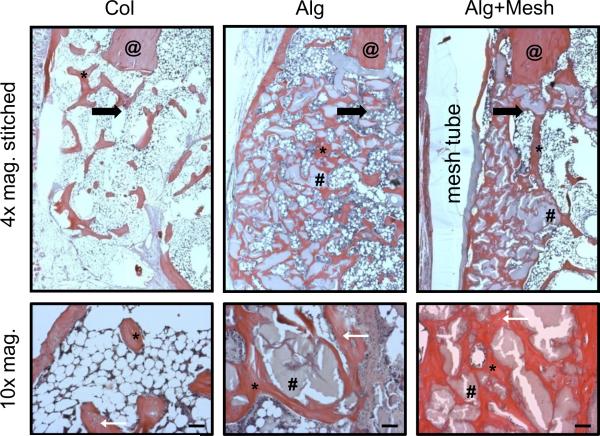
Figure 7.
Histological analysis at 12 weeks (4× and 10× magnification). H&E staining revealed improved bone regeneration in the two alginate groups, despite presence of residual alginate. The mesh tube in the Alg+Mesh group was able to constrain bone formation within the defect region. The black arrows are at located at the edges of the defects and point towards the center of the defects. The higher magnification images reveal osteocytes embedded in the newly formed bone (located with white arrows). Scale bars are 200 μm. @ - native bone end; * - regenerated bone; # - residual alginate. n = 2 defects per group.

