

Abstract
The calmodulin hypothesis of ectodomain shedding stipulates that calmodulin, an intracellular Ca2+-dependent regulatory protein, associates with the cytoplasmic domain of L-selectin to regulate ectodomain shedding of L-selectin on the other side of the plasma membrane. To understand the underlying molecular mechanism, we have characterized the interactions of calmodulin with two peptides derived from human L-selectin. The peptide ARR18 corresponds to the entire cytoplasmic domain of L-selectin (residues Ala317–Tyr334 in the mature protein), and CLS corresponds to residues Lys280–Tyr334, which contains the entire transmembrane and cytoplasmic domains of L-selectin. Monitoring the interaction by fluorescence spectroscopy and other biophysical techniques, we found that calmodulin can bind to ARR18 in aqueous solutions or the L-selectin cytoplasmic domain of CLS reconstituted in the phosphatidylcholine bilayer, both with an affinity of approximate 2 μM. The association is calcium-independent, dynamic and involves both lobes of calmodulin. In a phospholipid bilayer, the positively charged L-selectin cytoplasmic domain of CLS is associated with anionic phosphatidylserine lipids at the membrane interface through electrostatic interactions. Under conditions where the phosphatidylserine content mimics that in the inner leaflet of the cell plasma membrane, the interaction between calmodulin and CLS becomes undetectable. These results suggest that the association of calmodulin with L-selectin in the cell can be influenced by the membrane bilayer, and that anionic lipids may modulate ectodomain shedding of transmembrane receptors.
Keywords: Ectodomain shedding, protein interaction, fluorescence spectroscopy, L-selectin, calmodulin
Introduction
Protein ectodomain shedding, a process in which a transmembrane protein is proteolytically cleaved and its extracellular domain released from the cell, is an important regulatory mechanism employed by mammalian cells to respond to environmental and physiological changes.1 Ectodomain shedding affects a vast number of membrane proteins, including growth factor precursors, cytokine receptors, cell adhesion receptors and proteoglycans.1 As an essential physiological process, ectodomain shedding can be stimulated and regulated by a variety of factors.2 Many of them affect the activity of ADAMs, the proteases that catalyze the proteolytic reaction on the membrane protein substrates.3; 4 Although ectodomain shedding happens on the extracellular side of the cell membrane, intracellular proteins have been implicated in modulating proteolysis in an apparently transmembrane fashion.5 While in many cases it is believed that these intracellular proteins regulate shedding by interacting directly with the cytoplasmic domain of the shedding substrate rather than by modulating the activity of ADAMs,6–9 the underlying molecular basis remains to be elucidated.
The first reported example is the putative regulation of L-selectin shedding by calmodulin (CaM).6 L-selectin, a type I transmembrane protein and a member of the C-type lectin family, is expressed on the surface of leukocytes and involved in recruitment of leukocytes to inflammatory sites.10 It mediates the initial tethering and subsequent rolling of circulating leukocytes on the surface of endothelial cells.11; 12 Upon cell adhesion and activation, L-selectin is rapidly cleaved at the peptide bond between residues Lys283 and Ser284.13; 14 Physiological shedding of L-selectin is catalyzed by ADAM17, the canonical member of the ADAM protease family.15; 16 A CaM inhibitor induced dissociation of CaM from L-selectin and enhanced shedding of L-selectin in transfected cells expressing human L-selectin.6 This suggests that CaM associates with L-selectin in the cytoplasm and inhibits shedding of L-selectin on the other side of the cell membrane. Furthermore, mutations L320E and L320E/K321E/K322E in the membrane-proximal region of the L-selectin cytoplasmic domain abolished coimmunoprecipitation of CaM with L-selectin in transfected K562 cells and resulted in elevated shedding of L-selectin, suggesting that CaM regulates L-selectin shedding by dissociating from L-selectin rather than through a pathway independent of L-selectin.17 In addition to shedding of L-selectin, shedding of many other proteins can also be induced by treatment of CaM inhibitors.18–24 Like L-selectin, many of these proteins contain in their cytoplasmic domain a juxtamembrane region that is rich in basic residues and amenable to CaM association. Thus a general mechanism may underlie the shedding of these proteins induced by CaM inhibitors. However, there have been reports that suggest mechanisms independent of CaM interaction with the shedding substrate. For instance, CaM inhibitors can induce ectodomain shedding of TrkA, although CaM could not be coimmunoprecipitated with TrkA.18 Furthermore, deletion of the entire TrkA cytoplasmic domain except for the juxtamembrane 7 residues, or introducing glutamate residues to a basic-rich putative CaM-binding site, did not prevent CaM inhibitor-induced shedding of TrkA.18 Similarly, while shedding of the GPIbα subunit in the GPIb-IX receptor complex can be stimulated by CaM inhibitors, a mutation in the cytoplasmic domain of the complex that abolishes CaM association does not lead to elevated shedding of GPIbα.25
The interaction between CaM and full-length L-selectin, as well as those between CaM and peptides corresponding to a part of or the entire cytoplasmic domain of L-selectin, were demonstrated by solid phase binding assays and coimmunoprecipitation.6; 17 Like in many shedding substrates, the residues in the L-selectin cytoplasmic domain that participate directly in CaM association are located in close proximity to the transmembrane domain of L-selectin.17 The importance of such membrane proximity, considering that the effect of CaM association on ectodomain shedding is of transmembrane nature, has not been explored. Nor has the effect of membrane bilayer on the interaction between CaM and L-selectin, since the cell membrane had been absent or removed by detergents in previous studies.6; 17 In this study we have characterized the interaction between CaM and L-selectin-derived peptides in the presence of cell-mimicking membrane bilayers. Our results have shown that the L-selectin cytoplasmic domain binds to the negatively charged membrane surface and, contrary to general expectations, that CaM is unable to compete with the latter for binding to the former. These results suggest that lipids in the cell membrane may play an important role in the regulation of ectodomain shedding. The implication on the role of CaM in shedding regulation is also discussed.
Results
Two L-selectin-derived peptides were synthesized for this study (Fig. 1). The first peptide, named ARR18, corresponds to the entire cytoplasmic domain of human L-selectin (residues Ala317 – Tyr334 in the mature protein; Fig. S1). The other peptide, named CLS, covers the extracellular stalk region including the shedding cleavage site, and both the transmembrane and cytoplasmic domains of L-selectin (residues Lys280 – Tyr334).26 ARR18 is soluble in water up to millimolar concentration. In contrast, CLS is not soluble in aqueous solutions and can only be resuspended in either detergent micelles or liposomes. Thus, this study is divided into two parts. The first part focuses on the interaction of CaM with ARR18 in aqueous solutions, whereas the second focuses on the interaction of CaM with CLS reconstituted in large unilamellar lipid vesicles.
Figure 1. Sequences of L-selectin-derived peptides used in this study.

Sequence of the C-terminal portion of human L-selectin, including the entire transmembrane and cytoplasmic domains, is shown on the top. The boundary of the transmembrane domain is marked. The shedding cleavage site is indicated by the inverted triangle. Several key residues in the cytoplasmic domain are labeled by their respective residue numbers. The sequences of ARR18 and CLS are positioned to indicate their respective locations in L-selectin. For CLS variants, only the changed residues are highlighted.
CaM binds to ARR18 with micromolar affinity
To monitor the interaction between CaM and ARR18, a fluorescent probe IAEDANS was attached to the thiol group of the CaM-K75C mutant and purified by HPLC to homogeneity (Fig. S2). The IAEDANS-labeled CaM-K75C, designated in this paper as I-CaM, has the same function as wild-type CaM and had been used successfully to study the association of CaM with peptides derived from CaM-dependent protein kinase II (CaMKII).27 Addition of ARR18 to ICaM dissolved in 10 mM MOPS, 100 mM NaCl, pH 7.4, induced an increase in IAEDANS fluorescence emission in the presence or absence of calcium ion (Fig. 2A). Titrations of ARR18 to I-CaM, monitored by the change in IAEDANS fluorescence, could be fitted to the standard hyperbolic function (Fig. 2B). The equilibrium dissociation constants were 2.1 ± 0.1 μM in the presence of calcium ion and 2.5 ± 0.1 μM in its absence. Therefore, calcium does not influence the association of CaM with ARR18. Association of ARR18 with unlabeled CaM in the presence of calcium was also monitored by ITC (Fig. 2C), and gave a dissociation constant of 4.9 ± 0.3 μM with a binding stoichiometry of 1:1. The dissociation constant obtained from the ITC experiment was close to that measured by the change in IAEDANS fluorescence, indicating that the IAEDANS group does not significantly alter the binding interaction of CaM to ARR18.
Figure 2. CaM binds to ARR18 in a calcium-independent manner with a micromolar affinity.

(A) Fluorescence emission spectra of I-CaM in the presence and absence of ARR18 and Ca2+. △, I-CaM was added to 3 ml of 10 mM MOPS, pH 7.4, 0.1 mM CaCl2, 100 mM NaCl, 0.1 mg/ml BSA to 50 nM final concentration and an emission scan obtained; □, ARR18 was added to 24.2 μM final concentration and another scan was obtained; ▲, 50 nM I-CaM in the same buffer containing 0.3 mM EDTA; ■, 50 nM I-CaM with 24.2 μM ARR18 in the buffer containing 0.3 mM EDTA. The excitation wavelength was 340 nm. All spectra were corrected for background reading from the buffer. (B) Association of ARR18 to I-CaM in the presence (□) and absence (■) of Ca2+, monitored by the change in IAEDANS emission fluorescence at 470 nm. The buffers were the same as in (A). Disassociation constants were derived by fitting the data to the hyperbolic equation. (C) Association of ARR18 and CaM monitored by ITC. Top panel: calorimetric trace of heat released upon titration of ARR18 (316 μM, in 10 μl increments) into 27.6 μM CaM. Both ARR18 and CaM were dissolved in 10 mM MOPS, 2 mM CaCl2, 100 mM NaCl, pH 7.4. Bottom panel: the data were best fit to a one-site model. Values obtained for the binding of ARR18 to CaM were as follows: N, 0.92±0.05, Ka, 204,000±57,000 M−1; ΔH, −0.77±0.07 kcal/mol; ΔS, 21.7 cal/mol·K.
Dynamic interaction of CaM with ARR18
CaM can adopt many possible conformations when it associates with different peptides.28–30 CaM consists of two calcium-binding domains: N- and C-lobes. Both lobes can participate in peptide binding, but the relative position of the two lobes often varies for different ligands.31–36 A donor- and acceptor-labeled CaM (D/A-CaM) has been developed to quickly assess the conformation of CaM in its association with the peptide ligand.37 In D/A-CaM, the fluorescence donor group, IAEDANS, was attached to one lobe, whereas the non-fluorescence acceptor group, DDPM, was attached to the other. The extent of quenching of the IAEDANS fluorescence by DDPM is an indicator on the relative position of the two lobes, which can be affected by peptide association. For instance, a peptide derived from CaMKII (residues 293–312, FNARRKLKGAILTTMLATRN), with a nanomolar binding affinity to CaM, brings the two lobes of CaM into close proximity upon its association with CaM.32 Addition of this CaMKII-derived peptide to D/A-CaM caused significant quenching of the IAEDANS fluorescence,37 which was repeated in this study as a control. By comparison, addition of ARR18 to D/A-CaM induced much less quenching of the IAEDANS fluorescence, even at a peptide concentration under which most D/A-CaM was associated with ARR18 (Fig. 3). This result suggested that CaM associates with ARR18 in a much more extended conformation than that with the CaMKII-derived peptide.
Figure 3. Fluorescence emission spectra of D/A-CaM in the absence and presence of various associating peptides.
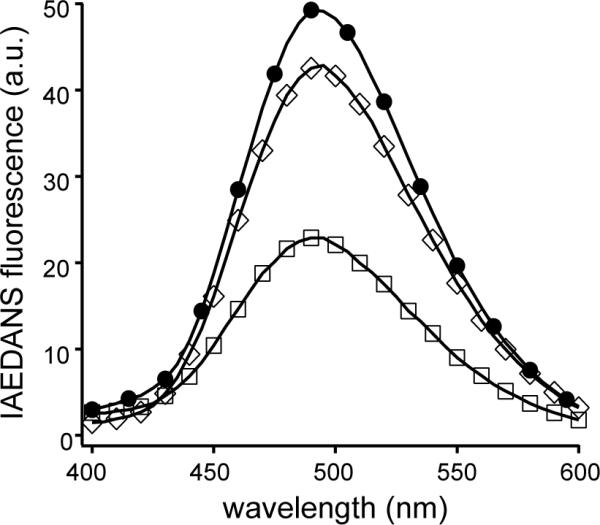
D/A-CaM was dissolved in 3 ml of calcium-containing buffer (10 mM MOPS, 0.1 mM CaCl2, 100 mM NaCl, pH 7.4) to a final concentration of 216 nM in each sample aliquot. Equal volume of buffer or that containing specified peptides was added to each aliquot before the fluorescence scan was obtained. The excitation wavelength was 340 nm. ●, no peptides; ◇, 8.1 μM ARR18; □, 416 nM FNA20.
We previously applied NMR to characterize interactions between CaM and PEP-19, an IQ motif protein with a binding affinity of 10–20 μM for CaM.38–40 Thus, we used 1H,15N-HSQC spectra to monitor changes in backbone amide cross peak chemical shifts and intensities as 15N-labeled Ca2+-loaded CaM was titrated with ARR18. Numerous cross peak assignments were made based on comparison to our previously assigned spectra for Ca2+-CaM.38–40 Figure 4A shows that the great majority of amide cross peaks are broadened beyond detection at an ARR18:CaM molar ratio of 1.4, which is characteristic of slow to intermediate exchange since the cross peaks do not reappear under these conditions. Cross peaks that remain observable at this concentration of ARR18 follow no obvious pattern with respect to the positions of corresponding residues in the structure of CaM. At lower molar ratios of ARR18:CaM the chemical shifts of the majority of cross peaks showed little or no change, but the peak intensity decreased significantly as shown in Figure 4B for a number of residues in both N- and C-lobes of CaM. Similar behavior is observed for many other residues. These results show that ARR18 binds to both the N- and C-lobes of Ca2+-CaM. Severe broadening of CaM backbone amide cross peaks even at saturating concentrations of ARR18 suggests that the binary complex is dynamic and exist as an ensemble of interconverting conformers.
Figure 4. Dynamic association of CaM with ARR18.

(A) 15N-HSQC NMR spectra of calcium-loaded CaM in the absence (red) and presence (blue) of the ARR18 peptide. (B) Cross peak intensities of backbone amides of CaM decrease with addition of ARR18.
The cytoplasmic domain of L-selectin binds negatively charged PS lipids
The cytoplasmic domain of L-selectin is highly enriched in basic residues, with 11 of the entire 17 residues being either Arg or Lys (Fig. 1). Moreover, all of these positively charged residues are located in the juxtamembrane region, which would place them near the cytoplasmic surface of the leukocyte plasma membrane. Since PS is the most abundant negatively charged lipid populating the inner leaflet of the plasma membrane,41; 42 we reasoned that PS may interact with positively charged juxtamembrane region of L-selectin.
To explore the interplay between the cytoplasmic domain of L-selectin and the membrane surface, we have reconstituted the CLS peptide into POPC-based liposomes. The zwitterionic phosphatidylcholine is the dominant lipid of the leukocyte cell membrane.43 POPC was chosen for this study because the thickness of the POPC membrane bilayer is 4.0 nm and resembles that of a cell membrane.44 When CLS liposomes were treated with trypsin, the cytoplasmic domain was cleaved from approximately half of the CLS molecules (Fig. S3), indicating that CLS was evenly oriented in both directions when reconstituted into the liposome. The leukocyte membrane contains approximately 7.5% PS.43 Moreover, PS is mostly located in the inner, not outer, leaflet of the plasma membrane.45 In order to mimic the natural abundance of PS in a cell membrane, up to 15% (molar ratio) POPS was incorporated into the POPC liposome in this study.
Circular dichroism (CD) spectra have been obtained for CLS reconstituted in liposomes that contained either all POPC (referred to henceforth as “POPC liposome”) or 85% POPC and 15% POPS (“15% POPS liposome”). Both CD spectra showed dual spectral minima at 208 and 222 nm that are characteristic of the α-helical secondary structure (Fig. 5). The significant content of α-helical conformation in CLS suggested that CLS was properly inserted into and traverses the membrane, with its transmembrane domain forming a helix. It was difficult to accurately determine the extent of α-helical conformation in regions outside the transmembrane domain of CLS based on CD spectra. However, the ellipticity at 222 nm in the 15% POPS liposome is less negative than that in the POPC liposome, suggesting that CLS has less α-helical secondary structure in the 15% POPS liposome than in the POPC liposome.
Figure 5. Far-UV CD spectra of CLS in POPC (solid line) and 15% POPS (dashed line) liposomes.
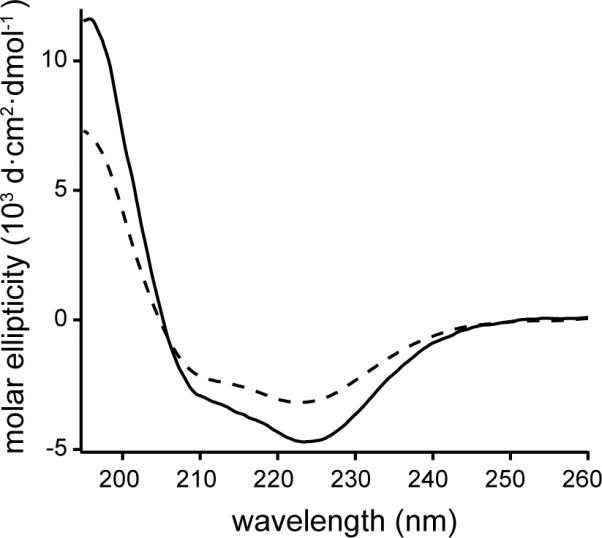
The liposome samples were prepared in 1 mM MOPS, pH 7.4. The spectra were collected at 20 °C.
To detect the association of juxtamembrane residues of CLS with PS lipids, Ser329 of CLS, which immediately follows the juxtamembrane basic residues, was mutated to cysteine (Fig. 1). Fluorescent TMR-conjugated CLS-S329C, termed TMR-CLS, was reconstituted into POPC liposomes that also contained various percentages of POPS. The proximity of the TMR group to the liposome membrane, or conversely, its exposure to the aqueous solution, was monitored by the collisional fluorescent quenching method in which the membrane-impermeable iodide ion was employed as the solute quencher.46; 47 The nitrate ion, for its much lower quenching capability (Fig. 6A), was added to TMR-CLS liposomes along with iodide to keep the total ionic strength constant at 200 mM. To preclude the effect caused by any difference in TMR concentration among various POPS-containing liposomes, the TMR fluorescence in a liposome at a given iodide concentration was expressed as a fraction of that in the absence of iodide. Figure 6B shows the effect of increasing POPS concentration on iodide quenching. Addition of sodium iodide decreased TMR fluorescence in all liposomes, but those with higher POPS content produced significantly higher TMR fluorescence and lower iodide quenching. This result established that the cytoplasmic domain of CLS is located closer to the surface of membranes that have higher concentrations of negatively charged lipids.
Figure 6. POPS reduces iodide quenching of TMR-CLS in liposomes.

(A) Sample fluorescence emission spectra of TMR-CLS showing the collisional quenching by iodide. For each emission spectrum, a 20-μl aliquot of TMR-CLS/POPC liposome was diluted into 0.4 ml of desired buffer to a final CLS concentration of approximately 32 nM. The excitation wavelength was 542 nm. All spectra were corrected for background signals from the buffer and the empty liposome. ◆, 10 mM MOPS, pH 7.4; △, 10 mM MOPS, 200 mM NaNO3, pH 7.4; ◇, 10 mM MOPS, 200 mM NaI, pH 7.4. (B) Plots of relative decrease in TMR fluorescence emission (F/F0) of TMR-CLS liposomes versus the concentration of NaI in the aqueous phase. F is the TMR fluorescence emission at 575 nm of the TMR-CLS liposome resuspended in the 10 mM MOPS, pH 7.4, buffer that contains a given concentration of NaI. F0 is that in the same buffer containing no NaI. NaNO3 was included in each sample to keep the combined salt concentration constant at 200 mM. The molar percentage of POPS in the liposome was 0% (□), 5% (▲), 10% (△) or 15% (■).
Additional experiments were carried out to characterize the nature of the forces underlying the association of CLS with PS lipids. In the first experiment, additional sodium nitrate was added to TMR-CLS liposomes that contained either 0% or 15% POPS while the iodide concentration was kept constant at 150 mM. With increasing concentration of sodium nitrate, TMR fluorescence was quenched more significantly in 15% POPS liposomes compared to POPC liposomes (Fig. 7A). This was not due to collisional quenching by the nitrate ion since TMR fluorescence in POPC liposomes stayed largely unchanged with addition of sodium nitrate. When the sodium nitrate concentration approached 800 mM, the difference in TMR fluorescence between two liposomes became diminished, indicating that the association between the cytoplasmic domain of CLS and PS lipids could be disrupted by high ionic strength in the solution. In the second experiment, residues Leu320-Lys322 in the juxtamembrane region of CLS were mutated to glutamates (CLS-EEE). Unlike results obtained with TMR-CLS, iodide quenching of TMR-conjugated CLS-EEE is largely independent of PS composition in the liposome (data not shown). The extent of fluorescent quenching of TMR-CLS-EEE in the 15% POPS liposome was similar to that of TMR-CLS in the POPC liposome rather than that of TMR-CLS in the 15% POPS liposome (Fig. 7B), indicating that the TMR group in CLS-EEE is exposed to the aqueous solution even when POPS is included in the membrane bilayer. This is consistent with the conclusion that the juxtamembrane region of CLS associates with PS lipids, likely through electrostatic interactions.
Figure 7. Electrostatic forces mediate the interaction between POPS and the cytoplasmic domain of CLS.

(A) Plots of relative decrease in TMR fluorescence emission (F/F0) of TMR-CLS liposomes versus the concentration of NaNO3. TMR-CLS in either POPC liposome (□) or 15% POPS liposome (■) was mixed with 10 mM MOPS, pH 7.4, buffer that contained 150 mM NaI and various amounts of NaNO3. Each sample was excited at 542 nm and the TMR emission intensity at 575 nm (F) was measured to calculate the F/F0 ratio. (B) Plots of relative decrease in TMR fluorescence emission (F/F0) of TMR-labeled CLS liposomes versus the concentration of NaI in the aqueous phase. The experiment was carried out as described in the legend of Figure 7B. □, TMR-CLS in POPC liposome; ■, TMR-CLS in 15% POPS liposome; ▲, TMR-CLS-EEE in 15% POPS liposome.
CaM binds to CLS in POPC liposomes with micromolar affinity
The presence of an intact transmembrane domain in CLS and the ability of CaM to associate with detergents dictated that the interaction of CaM with CLS be monitored in the presence of a membrane bilayer.48; 49 Although CLS in POPC liposomes, but not empty POPC liposomes, increased IAEDANS fluorescence of I-CaM, the IAEDANS fluorescence change was mixed with scattering background (Fig. S4). Thus, two systems were used to monitor the association of CaM with CLS in POPC liposomes. In the first system, TMR-CLS in POPC liposomes was titrated with unlabeled CaM, and the TMR fluorescence emission was monitored. Addition of CaM caused a small but consistent increase in the TMR fluorescence (Fig. 8A). The titration with CaM in the presence of EDTA gave a hyperbolic curve with a fitted equilibrium dissociation constant of 1.7 ± 0.6 μM (Fig. 8B). When the same titration was carried out in the presence of 0.1 mM CaCl2 instead of EDTA, essentially the same dissociation constant (1.5 ± 0.5 μM) was obtained (Fig. 9A). In the second system, CaM binding was monitored by fluorescence energy transfer between the lone Trp residue 315 of unlabeled CLS in POPC liposomes and the IAEDANS groups in I-CaM (Fig. 8C). Figure 8D shows that titration of CLS in POPC liposomes with I-CaM in the presence of EDTA gave a hyperbolic binding curve with a dissociation constant of 3.0 ± 0.4 μM. The same titration in the presence of calcium again produced a similar dissociation constant of 2.0 ± 0.4 μM (Fig. 9B). These results demonstrate that neither the conjugated IAEDANS group in CaM nor the TMR group in CLS affected significantly the interaction of CaM with CLS in POPC liposomes. Moreover, the interaction of CaM with CLS is independent of calcium ion. The measured dissociation constants are comparable to those obtained for the association of CaM with ARR18 (Fig. 2), suggesting that CaM associates with the cytoplasmic domain of CLS near the POPC membrane in a manner similar to it does with the isolated cytoplasmic peptide in aqueous solution.
Figure 8. Apo-CaM binds to CLS in POPC liposomes with a micromolar affinity.

(A) Fluorescence emission spectra of TMR-CLS in the absence □) and presence (◇) of CaM. The concentrations of TMR-CLS and CaM in the mixture were 32 nM and 10 μM, respectively. Both TMR-CLS/POPC liposome and CaM were prepared in 10 mM MOPS, 0.3 mM EDTA, pH 7.4. The excitation wavelength was 542 nm. Each spectrum was the average of 3 scans and corrected for background signals from the buffer and the empty liposome. (B) Binding of apo-CaM to TMR-CLS/POPC liposome, monitored by the change in TMR emission fluorescence at 575 nm. Dashed line indicates the fitted binding curve. (C) Fluorescence emission spectra showing fluorescence resonance energy transfer between Trp315 of CLS and I-CaM. Both CLS/POPC liposome and I-CaM were prepared in 10 mM MOPS, 0.3 mM EDTA, pH 7.4. The excitation wavelength was 295 nm. Each spectrum was the average of 3 scans and corrected for background signals. ◯, 30 nM CLS in the POPC liposome; ●, empty POPC liposome mixed with 10 μM I-CaM; ▲, 30 nM CLS in the POPC liposome mixed with 10 μM I-CaM. (D) Binding of apo-I-CaM to CLS/POPC liposome, monitored by the quenching of tryptophan emission fluorescence at 333 nm. The concentration of I-CaM was determined using the extinction coefficient of IAEDANS. Dashed line indicates the fitted binding curve.
Figure 9. Calcium does not affect CaM association with CLS in POPC liposomes.

The same experiments described in Figure 9 were repeated, except in the calcium-containing buffer (10 mM MOPS, 1 mM CaCl2, pH 7.4). (A) The association of CaM with TMR-CLS was monitored by the change in TMR emission fluorescence. (B) The association of I-CaM with CLS was monitored by the change in tryptophan emission fluorescence.
Lack of association of CaM with CLS in 15% POPS liposomes
We next measured the association of CaM with CLS that was reconstituted in the15% POPS liposome. When up to 10 μM CaM was added to TMR-CLS in 15% POPS liposomes that were resuspended in 10 mM MOPS, 100 mM NaCl, pH 7.4, either in the presence of 1 mM EDTA or 0.1 mM CaCl2, little change in TMR fluorescence emission was observed (Fig. 10). Similarly, mixing I-CaM with unlabeled CLS in 15% POPS liposomes did not produce a significant quenching of Trp315 fluorescence. Thus, in direct contrast to their association on the POPC membrane, CaM does not associate with CLS when the latter is embedded in the membrane bilayer that contains 15% POPS. These results suggest that the association with PS lipids prevents the cytoplasmic domain of CLS from interacting directly with CaM.
Figure 10. CaM does not bind to TMR-CLS in 15% POPS liposomes.

Titration of CaM to TMR-CLS in 15% POPS liposomes in the absence (A) and presence (B) of calcium was monitored by the TMR emission fluorescence essentially as described in Figures 9 and 10.
Discussion
The CaM hypothesis for the regulation of ectodomain shedding stipulates that CaM binds to the basic-rich juxtamembrane region of the L-selectin cytoplasmic domain and inhibits shedding of L-selectin.6 It would explain the experimental observation that treatment of CaM inhibitors up-regulates shedding of L-selectin on the cell surface, presumably by dissociating CaM from the L-selectin cytoplasmic domain. The CaM hypothesis has since been extended to other membrane proteins because many proteins contain in their cytoplasmic domain a region rich in basic residues and their shedding can be induced by treatment of CaM inhibitors.18–23 However, there have been observations that do not seem consistent with the CaM hypothesis.18; 25 It also remains unclear how CaM binding to the cytoplasmic domain of a shedding substrate can influence its proteolytic cleavage on the other side of the membrane. In this study we have characterized the association of CaM with CLS, a peptide containing both transmembrane and cytoplasmic domains of L-selectin, at the surface of a membrane bilayer. When CLS is embedded in the POPC membrane bilayer, CaM binds to it with a binding affinity of approximately 2–3 μM (Fig. 8,9). The measured dissociation constant matches perfectly with that for the association of CaM with ARR18 in aqueous solutions, suggesting that CaM associates with the cytoplasmic domain of CLS in a manner similar to it does with ARR18: dynamic and independent of calcium. However, when CLS is embedded in a membrane bilayer that contains negatively charged PS lipids to mimic the inner leaflet of the plasma membrane, CaM fails to bind, likely because that the cytoplasmic domain of CLS is instead associated with the PS lipids in the membrane bilayer (Fig. 7,11).
The interaction of CaM with the L-selectin cytoplasmic domain had been demonstrated in earlier studies by coimmunoprecipitation and solid phase binding assays.6; 17 An apparent binding affinity in the low micromolar range was shown for the association of CaM with immobilized peptides that correspond to the L-selectin cytoplasmic domain,6 which is consistent with the measurements reported in this study. However, these previous studies were carried out under conditions where the membrane environment was missing or its integrity compromised by the addition of detergents. Our study has for the first time characterized the interaction of CaM with L-selectin at a membrane interface and thus was able to investigate the effects of natural phospholipids on this interaction. In this study 15% POPS was incorporated into the POPC membrane bilayer to mimic the lipid composition in the inner leaflet of the plasma membrane. Our results indicate that although CaM is capable of interacting with the L-selectin cytoplasmic domain, it may not do so under conditions where the cytoplasmic domain of L-selectin is in close proximity to the negatively charged membrane surface. It should be kept in mind that 15% POPS is a rough approximation to the natural leukocyte membrane environment. Other negatively charged phospholipids such as phosphorylated phosphatidylinositols are also enriched in the inner leaflet. Moreover, the conformation of the L-selectin cytoplasmic domain near the plasma membrane in a living cell may be different from that in our synthetic POPC/POPS liposomes. Nonetheless, our results suggest that negatively charged lipids may influence association of the L-selectin cytoplasmic domain with CaM or other proteins and in turn modulate ectodomain shedding of L-selectin.
The association of the basic-rich juxtamembrane region of the L-selectin cytoplasmic domain with negatively charged lipids is mostly through electrostatic interactions (Fig. 8). A similar association of the basic-rich juxtamembrane region of the EGFR cytoplasmic domain with negatively charged lipids has been reported.50 Many receptors contain in their cytoplasmic domain a juxtamembrane region that is rich in basic residues. Its association with negatively charged lipids and thus the cytoplasmic membrane surface may be a universal feature. But the ability of CaM to compete with negatively charged lipids for binding to the cytoplasmic domain varies with individual receptors. In the case of L-selectin, CaM fails to bind in the presence of PS lipids. In contrast, CaM can bind to the juxtamembrane region of EGFR and dissociate it from the negatively charged membrane surface.50 Such difference between L-selectin and EGFR is likely due to the difference in their binding affinities. Comparing to the calcium-independent micromolar binding affinity for L-selectin, calcium-loaded CaM exhibits a much tighter affinity to the juxtamembrane region of EGFR.50
The CaM hypothesis was generated to explain two potentially inter-related experimental observations. The first observation is that the basic-rich juxtamembrane region of the L-selectin cytoplasmic domain is important to the regulation of its shedding.17 The other is that treatment of membrane-permeable CaM inhibitors induces shedding of L-selectin from the cell surface.6 Since our results suggest that CaM may not by itself associate directly with L-selectin in the cell, alternative mechanisms should be sought to explain the above observations. For instance, instead of directly associating with the L-selectin cytoplasmic domain and modulating L-selectin shedding by itself, it is possible that CaM modulates the association of other intracellular proteins with the L-selectin cytoplasmic domain. It has recently been suggested that the L-selectin cytoplasmic domain, CaM and moesin form a ternary complex in the cell.51 The FERM domain in moesin or its closely related ezrin and radixin can bind to phosphatidylinositol-4,5-biphosphate and the juxtamembrane region of a number of membrane proteins.52–55 Moreover, the effects of membrane-permeable CaM inhibitors may not be limited to dissociating CaM from its protein ligands in the cell. Instead, these CaM inhibitors such as W-7 can directly bind to membrane and alter the electrostatic surface potential.56 A change in the surface potential is likely to alter the environment at the membrane interface and therefore the interactions among intracellular proteins. This is consistent with our findings here that anionic lipids can influence the protein interactions through their association with the cytoplasmic domain of the membrane receptor. Therefore, considering the likely involvement and influence of lipids on protein interactions that are critical to the regulation of ectodomain shedding, it will be critical that future investigations are carried out in a membrane environment.
Materials and methods
Materials
Human L-selectin cDNA was purchased from ATCC (Manassas, VA). The pET vector expressing CaM was a gift from Kevin MacKenzie.36 Restriction enzymes used in cloning were purchased from New England Biolabs (Ipswich, MA). Thrombin was purchased from GE Healthcare (Pittsburgh, PA). The TMR fluorescence dye was purchased from Anaspec (Fremont, CA), and 1,5-IAEDANS from Invitrogen (Carlsbad, CA). POPC and POPS lipids were purchased from Avanti Polar Lipids (Alabaster, AL). The ARR18 peptide was synthesized by Sigma Genosys (Woodlands, TX) and further purified to 90–95% purity by reverse-phase HPLC. The extinction coefficient of ARR18, 1,490 M−1·cm−1 at 280 nm, was estimated from the primary sequence by the method of Pace et al.57 FNA20 was synthesized in the core facility at Baylor College of Medicine and has been described before.37
Preparation of calmodulin and fluorophore-conjugated calmodulin variants
The pET vector expressing CaM was cloned into E.coli BL21 and the expression was induced by IPTG. The cell pellet was lysed by sonication and the CaM was purified through a pre-packed Macro-Prep Q 2.5×30 cm column. The purity of CaM was determined by SDS-PAGE to be >95%. The purified protein was dialyzed extensively against 5 mM ammonium bicarbonate and distilled water, and stored as lyophilized powder. The extinction coefficient of CaM is 3,006 M−1·cm−1 at 280 nm. The K75C mutation was introduced to the CaM gene using the primer 5'-CGATGATGGCGAGGTGCAT-GAAGGACACGGAC-3' and its complementary primer. The mutant gene sequence was confirmed by sequencing (SeqWright, Houston, TX). Expression and purification of mutant CaM was carried out as the wild type protein.
Thiol-specific labeling of CaM-K75C with 1,5-IAEDANS was carried out based on the published protocol.27; 58 Briefly, lyophilized CaM-K75C protein was dissolved to 140 μM in 50 mM Tris·HCl, pH 8.0 containing 0.2 mM CaCl2 and 1 mM TCEP·HCl. 1,5-IAEDANS, freshly dissolved in N,N'-dimethylformamide at a concentration of 8.0 mg/ml, was added slowly, in the dark, to the CaM-K75C solution. The mixture was stirred for 20 hours at room temperature before the reaction was quenched by addition of excess reduced glutathione. Finally, IAEDANS-labeled CaM-K75C, named I-CaM, was separated from unlabeled K75C protein by reverse-phase HPLC and stored as the lyophilized powder. The purity of I-CaM was determined by analytical HPLC to be >95%. The concentration of I-CaM stock solution was determined using the IAEDANS absorption extinction coefficient of 4700 M−1·cm−1 at 340 nm.
Expression and purification of double Cys mutant, CaM-T34C/T110C, has been described.37 Donor/acceptor-labeled CaM, designated D/A-CaM, was obtained by labeling CaMT34C/T110C first with 0.4 mol of 1.5-IAEDANS (donor) per mol of protein and then with excess DDPM (acceptor).37 Approximately 31% of D/A-CaM contains an IAEDANS donor group. Its concentration was determined from IAEDANS absorbance as described above.
I-CaM fluorescence titration of water-soluble peptides
The stock solution of I-CaM was added to approximate 4 ml of 10 mM MOPS buffer, pH 7.4, containing 100 mM NaCl, 0.1 mg/ml bovine serum albumin and 0.1 mM CaCl2 (or 0.3 mM EDTA for calcium-free experiments), to achieve a final protein concentration of 20–40 nM. Ligand peptide solutions were prepared with the same buffer containing I-CaM so that the I-CaM concentration was kept constant during titration. All the solutions were filtered with 0.2 μm filter prior to the experiments. The steady-state IAEDANS fluorescence of the peptide-CaM mixture was acquired on PTI QuantaMaster spectrometer (Photon Technology International, Birmingham, NJ) using a 3-ml cuvette. The excitation and emission wavelength were 340 nm and 470 nm, respectively. The slit widths for excitation and emission were adjusted to minimize photo bleaching of the sample and to achieve sufficient fluorescent signal intensity. When applicable, the fluorescence measurements as a function of peptide concentration were fitted with the hyperbolic function
where F is the observed fluorescence, Ff is the fluorescence of unbound I-CaM, Fb is the fluorescence of I-CaM-peptide complex, [ligandf] is the concentration of free ligand, and Kd is the dissociation constant.59
Isothermal titration calorimetry (ITC)
Titration of the L-selectin peptides to CaM at 30 °C was monitored using a VP-ITC titration microcalorimeter (MicroCal Inc., Northampton, MA) following the documented procedure.60 Briefly, CaM at approximate 2.5 mg/ml was dialyzed extensively against 10 mM MOPS, 2 mM CaCl2, 100 mM NaCl, pH 7.4 at 4 °C for 24 hours. The dialysis buffer was used to dilute CaM and dissolve lyophilized peptides to desired concentrations. The peptide at a concentration around 300 μM was injected in 10 μl increments into the reaction cell containing 20–30 μM CaM. The stoichiometry of binding, N, and the values of Ka (association constant) and ΔH (enthalpy change per mole of ligand) were obtained by fitting the ITC titration curve to the equation
where Q is the heat evolved during the course of the reaction, V is the cell volume, [CaM] is the total calmodulin concentration, and [ARR18] is the ARR18 concentration. The free energy change, ΔG, and the entropy change, ΔS, were subsequently derived from Ka and ΔH.
Fluorescence resonance energy transfer (FRET) measurements using D/A-CaM
To measure quenching of the IAEDANS fluorescence in D/A-CaM as a result of peptide association, the excitation wavelength was set to 340 nm and the emission was scanned from 400 to 600 nm. The peptides were added, at various concentrations, to D/A-CaM (in 10 mM MOPS, 0.1 mM CaCl2, 100 mM NaCl, pH 7.4), and the spectra collected. All spectra were corrected with background fluorescence from the buffer.
Nuclear magnetic resonance (NMR) spectroscopy
All NMR experiments were performed using a Bruker Avance spectrometer operating at a proton frequency of 600.21 MHz and equipped with a triple channel (1H, 15N, 13C) 5mm, z-gradient cryoprobe. Lyophilized 15N-labeled CaM was dissolved in 600 μl of 10mM MOPS, 100mM NaCl, 5mM CaCl2, 10% D2O, pH 6.3 at a concentration of 0.35mM. When needed, ARR18 was added to the CaM sample to achieve a final concentration of 0.5mM. For each sample, 8 scans were collected for a 2D 15N-HSQC spectrum at 310 K. The spectra were processed using 1024×1024 complex points with a sinebell window function and cnv solvent suppression using Felix 2004 (Accelrys Inc, San Diego, CA). 1H chemical shifts were referenced to 2,2-dimethyl-2-silapentane-5-sulfonic acid and 15N chemical shifts were referenced using the gyromagnetic ratio.
Reconstitution of CLS in liposomes
Production and purification of CLS and mutants had been described earlier.26 The concentration of CLS stock dissolved in ethanol was estimated using an extinction coefficient of 8747.5 M−1·cm−1 at 280 nm.57. To prepare proteoliposomes of defined size distribution, appropriate amount of CLS dissolved in ethanol was mixed with desired phospholipids dissolved in chloroform at the molar ratio of 1:1,500. The mixture was gently dried under nitrogen stream before being placed under vacuum overnight. The dried film was rehydrated and resuspended in 10 mM MOPS, pH 7.4, buffer to a final protein concentration of approximately 4 μM. The CLS/lipid mixture was converted to large unilamellar vesicles by using a mini-extruder extruder (Avanti polar lipids) with a 400-nm pore sized filter. To estimate the CLS concentration reconstituted in a liposome sample, 20 μl aliquot was diluted into 480 μl of the same aqueous buffer containing 2% SDS. The tryptophan fluorescence emission intensity at 330 nm was then measured and compared to a standard curve, from which the CLS concentration was derived. The linear standard curve was obtained by measuring the tryptophan fluorescence emission of various amounts of purified CLS that was dissolved directly in the buffer containing 2% SDS. The reconstitution efficiency was generally over 90%.
CD spectroscopy
Far-UV CD spectra (190–260 nm) of CLS in desired liposomes were collected on a JASCO J815 circular dichroism spectrometer using a 0.1-cm quartz cuvette at 20 °C. The step-wise wavelength was set to 0.2 nm/step. To reduce the background absorbance, liposomes containing approximately 10 μM CLS were prepared in 1 mM MOPS, pH 7.4 buffer. Each spectrum was scanned 10 times and corrected for background signal (empty liposome resuspended in 1 mM MOPS buffer). The concentration of CLS in each sample was measured by comparing the Trp fluorescence emission after dissolving the sample in 2% SDS-containing MOPS buffer to a previously established standard curve.
Collisional fluorescence quenching
Thiol-specific conjugation of TMR to CLS-S329C in a detergent-free environment had been described earlier.26 TMR-CLS was purified by reverse-phase HPLC and the labeling efficiency was approximately 90%.26 The concentration of TMR-CLS was estimated by the extinction coefficient of TMR (62,000 M−1·cm−1 at 542 nm). Reconstitution of TMR-CLS into large unilamellar vesicles was carried out as described above. For each TMR-CLS liposome with a given POPC/POPS composition, a series of samples were prepared from dilution of the same liposome stock with 10 mM MOPS, pH 7.4, buffer that also contained varying amounts of NaNO3 and NaI. Each sample, with the final CLS concentration at approximately 30 nM, was equilibrated at 20 °C for at least 15 min before the TMR fluorescence emission was measured on the PTI QuantaMaster spectrometer using a 1-ml cuvette. The excitation and emission wavelength were 540 nm and 575 nm, respectively. The slit widths were set to 5 nm. Each spectrum was the average of 3 scans and corrected for background signal. To accommodate the small difference in TMR-CLS concentration between different batches of liposomes, the quenching efficiency was expressed as the ratio of the TMR emission intensity at 575 nm at a given NaI concentration versus that in its absence (F/F0).
CaM titration to CLS liposomes
Both CaM and TMR-CLS liposomes were prepared in 10 mM MOPS, 100 mM NaCl, pH 7.4, buffer that contained either 0.3 mM EDTA or 1 mM CaCl2. All titrations were monitored in a 1-ml cuvette at 20 °C using the PTI fluorimeter. The titration of unlabeled CaM to TMR-CLS (approximate 32 nM final concentration) reconstituted in the desired liposome was followed by the change in the TMR fluorescence emission. The excitation wavelength was set to 542 nm. The titration of I-CaM to unlabeled CLS (30 nM) reconstituted in the desired liposome was followed by the quenching of the Trp fluorescence by IAEDANS. The excitation wavelength was set to 295 nm. Each spectrum was the average of 3 scans. Empty liposomes without CLS were used for correction of background reading. The fluorescence change as a function of the CaM concentration was fitted to the standard hyperbolic equation as described above.
Supplementary Material
Acknowledgment
We thank Dr. Kevin MacKenzie for sharing the calmodulin expression vector, Dr. Vishwa Trivedi for assistance with the microcalorimeter, Drs. Quinn Kleerokoper and Peng Ji for assistance with NMR data processing, and members of the Li Laboratory for helpful discussion. This work is supported in part by NIH (GM084175).
Abbreviations
- ADAM
a disintegrin and metalloprotease
- CaM
calmodulin
- CaMKII
calmodulin-dependent protein kinase II
- CD
circular dichroism
- D/A-CaM
donor/acceptor-labeled CaM
- DDPM
N-(4-dimethylamino-3,5-dinitrophenyl)maleimide
- EGFR
epidermal growth factor receptor
- FRET
fluorescence resonance energy transfer
- HFIP
hexafluoroisopropanol
- HPLC
high performance liquid chromatography
- HSQC
heteronuclear single quantum coherence
- 1,5-IAEDANS
5-((((2-iodoacetyl)amino)ethyl)amino)naphthalene-1-sulfonic acid
- I-CaM
IAEDANS-labeled CaM K75C mutant
- ITC
isothermal titration calorimetry
- MOPS
3-(N-morpholino)propanesulfonic acid
- NMR
nuclear magnetic resonance
- POPC
1-palmitoyl-2-oleoyl-sn-glycero-3-phosphocholine
- POPS
1-palmitoyl-2-oleoyl-sn-glycero-3-phospho-L-serine
- PS
phosphatidylserine
- SDS-PAGE
sodium dodecyl sulfate polyacrylamide gel electrophoresis
- TCEP·HCl
Tris(2-carboxyethyl) phosphine hydrochloride
- TMR
tetramethylrhodamine-5-maleimide
Footnotes
Publisher's Disclaimer: This is a PDF file of an unedited manuscript that has been accepted for publication. As a service to our customers we are providing this early version of the manuscript. The manuscript will undergo copyediting, typesetting, and review of the resulting proof before it is published in its final citable form. Please note that during the production process errors may be discovered which could affect the content, and all legal disclaimers that apply to the journal pertain.
References
- 1.Arribas J, Borroto A. Protein ectodomain shedding. Chem Rev. 2002;102:4627–38. doi: 10.1021/cr010202t. [DOI] [PubMed] [Google Scholar]
- 2.Seals DF, Courtneidge SA. The ADAMs family of metalloproteases: multidomain proteins with multiple functions. Genes Dev. 2003;17:7–30. doi: 10.1101/gad.1039703. [DOI] [PubMed] [Google Scholar]
- 3.Schlondorff J, Blobel CP. Metalloprotease-disintegrins: modular proteins capable of promoting cell-cell interactions and triggering signals by protein-ectodomain shedding. J Cell Sci. 1999;112:3603–17. doi: 10.1242/jcs.112.21.3603. [DOI] [PubMed] [Google Scholar]
- 4.Li X, Perez L, Pan Z, Fan H. The transmembrane domain of TACE regulates protein ectodomain shedding. Cell Res. 2007;17:985–98. doi: 10.1038/cr.2007.98. [DOI] [PubMed] [Google Scholar]
- 5.Xu P, Derynck R. Direct activation of TACE-mediated ectodomain shedding by p38 MAP kinase regulates EGF receptor-dependent cell proliferation. Mol Cell. 2010;37:551–66. doi: 10.1016/j.molcel.2010.01.034. [DOI] [PMC free article] [PubMed] [Google Scholar]
- 6.Kahn J, Walcheck B, Migaki GI, Jutila MA, Kishimoto TK. Calmodulin regulates L-selectin adhesion molecule expression and function through a protease-dependent mechanism. Cell. 1998;92:809–18. doi: 10.1016/s0092-8674(00)81408-7. [DOI] [PubMed] [Google Scholar]
- 7.Gutwein P, Oleszewski M, Mechtersheimer S, Agmon-Levin N, Krauss K, Altevogt P. Role of Src kinases in the ADAM-mediated release of L1 adhesion molecule from human tumor cells. J Biol Chem. 2000;275:15490–7. doi: 10.1074/jbc.275.20.15490. [DOI] [PubMed] [Google Scholar]
- 8.Shi M, Dennis K, Peschon JJ, Chandrasekaran R, Mikecz K. Antibody-induced shedding of CD44 from adherent cells is linked to the assembly of the cytoskeleton. J Immunol. 2001;167:123–31. doi: 10.4049/jimmunol.167.1.123. [DOI] [PubMed] [Google Scholar]
- 9.Park PW, Foster TJ, Nishi E, Duncan SJ, Klagsbrun M, Chen Y. Activation of syndecan-1 ectodomain shedding by Staphylococcus aureus α-toxin and β-toxin. J Biol Chem. 2004;279:251–8. doi: 10.1074/jbc.M308537200. [DOI] [PubMed] [Google Scholar]
- 10.Rosen SD. Ligands for L-selectin: homing, inflammation, and beyond. Annu Rev Immunol. 2004;22:129–56. doi: 10.1146/annurev.immunol.21.090501.080131. [DOI] [PubMed] [Google Scholar]
- 11.Walcheck B, Kahn J, Fisher JM, Wang BB, Fisk RS, Payan DG, Feehan C, Betageri R, Darlak K, Spatola AF, Kishimoto TK. Neutrophil rolling altered by inhibition of L-selectin shedding in vitro. Nature. 1996;380:720–3. doi: 10.1038/380720a0. [DOI] [PubMed] [Google Scholar]
- 12.Kansas GS. Selectins and their ligands: current concepts and controversies. Blood. 1996;88:3259–87. [PubMed] [Google Scholar]
- 13.Kahn J, Ingraham RH, Shirley F, Migaki GI, Kishimoto TK. Membrane proximal cleavage of L-selectin: identification of the cleavage site and a 6-kD transmembrane peptide fragment of L-selectin. J Cell Biol. 1994;125:461–70. doi: 10.1083/jcb.125.2.461. [DOI] [PMC free article] [PubMed] [Google Scholar]
- 14.Chen A, Engel P, Tedder TF. Structural requirements regulate endoproteolytic release of the L-selectin (CD62L) adhesion receptor from the cell surface of leukocytes. J Exp Med. 1995;182:519–30. doi: 10.1084/jem.182.2.519. [DOI] [PMC free article] [PubMed] [Google Scholar]
- 15.Peschon JJ, Slack JL, Reddy P, Stocking KL, Sunnarborg SW, Lee DC, Russell WE, Castner BJ, Johnson RS, Fitzner JN, Boyce RW, Nelson N, Kozlosky CJ, Wolfson MF, Rauch CT, Cerretti DP, Paxton RJ, March CJ, Black RA. An essential role for ectodomain shedding in mammalian development. Science. 1998;282:1281–4. doi: 10.1126/science.282.5392.1281. [DOI] [PubMed] [Google Scholar]
- 16.Li Y, Brazzell J, Herrera A, Walcheck B. ADAM17 deficiency by mature neutrophils has differential effects on L-selectin shedding. Blood. 2006;108:2275–9. doi: 10.1182/blood-2006-02-005827. [DOI] [PMC free article] [PubMed] [Google Scholar]
- 17.Matala E, Alexander SR, Kishimoto TK, Walcheck B. The cytoplasmic domain of L-selectin participates in regulating L-selectin endoproteolysis. J Immunol. 2001;167:1617–23. doi: 10.4049/jimmunol.167.3.1617. [DOI] [PubMed] [Google Scholar]
- 18.Diaz-Rodriguez E, Esparis-Ogando A, Montero JC, Yuste L, Pandiella A. Stimulation of cleavage of membrane proteins by calmodulin inhibitors. Biochem J. 2000;346:359–67. [PMC free article] [PubMed] [Google Scholar]
- 19.Dong J, Wiley HS. Trafficking and proteolytic release of epidermal growth factor receptor ligands are modulated by their membrane-anchoring domains. J Biol Chem. 2000;275:557–64. doi: 10.1074/jbc.275.1.557. [DOI] [PubMed] [Google Scholar]
- 20.Wong MX, Harbour SN, Wee JL, Lau LM, Andrews RK, Jackson DE. Proteolytic cleavage of platelet endothelial cell adhesion molecule-1 (PECAM-1/CD31) is regulated by a calmodulin-binding motif. FEBS Lett. 2004;568:70–8. doi: 10.1016/j.febslet.2004.04.094. [DOI] [PubMed] [Google Scholar]
- 21.Gardiner EE, Arthur JF, Kahn ML, Berndt MC, Andrews RK. Regulation of platelet membrane levels of glycoprotein VI by a platelet-derived metalloproteinase. Blood. 2004;104:3611–7. doi: 10.1182/blood-2004-04-1549. [DOI] [PubMed] [Google Scholar]
- 22.Chattopadhyay S, Santhamma KR, Sengupta S, McCue B, Kinter M, Sen GC, Sen I. Calmodulin binds to the cytoplasmic domain of angiotensin-converting enzyme and regulates its phosphorylation and cleavage secretion. J Biol Chem. 2005;280:33847–55. doi: 10.1074/jbc.M501718200. [DOI] [PubMed] [Google Scholar]
- 23.Lambert DW, Clarke NE, Hooper NM, Turner AJ. Calmodulin interacts with angiotensin-converting enzyme-2 (ACE2) and inhibits shedding of its ectodomain. FEBS Lett. 2008;582:385–90. doi: 10.1016/j.febslet.2007.11.085. [DOI] [PMC free article] [PubMed] [Google Scholar]
- 24.Canobbio I, Catricala S, Balduini C, Torti M. Calmodulin regulates the nonamyloidogenic metabolism of amyloid precursor protein in platelets. Biochim Biophys Acta. 2011;1813:500–6. doi: 10.1016/j.bbamcr.2010.12.002. [DOI] [PubMed] [Google Scholar]
- 25.Mo X, Nguyen NX, Mu FT, Yang W, Luo SZ, Fan H, Andrews RK, Berndt MC, Li R. Transmembrane and trans-subunit regulation of ectodomain shedding of platelet glycoprotein Ibalpha. J Biol Chem. 2010;285:32096–104. doi: 10.1074/jbc.M110.111864. [DOI] [PMC free article] [PubMed] [Google Scholar]
- 26.Srinivasan S, Deng W, Li R. L-selectin transmembrane and cytoplasmic domains are monomeric in membranes. Biochim Biophys Acta. 2011;1808:1709–15. doi: 10.1016/j.bbamem.2011.02.006. [DOI] [PMC free article] [PubMed] [Google Scholar]
- 27.Putkey JA, Waxham MN. A peptide model for calmodulin trapping by calcium/calmodulin-dependent protein kinase II. J Biol Chem. 1996;271:29619–23. doi: 10.1074/jbc.271.47.29619. [DOI] [PubMed] [Google Scholar]
- 28.Persechini A, Kretsinger RH. The central helix of calmodulin functions as a flexible tether. J Biol Chem. 1988;263:12175–8. [PubMed] [Google Scholar]
- 29.Afshar M, Caves LS, Guimard L, Hubbard RE, Calas B, Grassy G, Haiech J. Investigating the high affinity and low sequence specificity of calmodulin binding to its targets. J Mol Biol. 1994;244:554–71. doi: 10.1006/jmbi.1994.1752. [DOI] [PubMed] [Google Scholar]
- 30.Hoeflich KP, Ikura M. Calmodulin in action: diversity in target recognition and activation mechanisms. Cell. 2002;108:739–42. doi: 10.1016/s0092-8674(02)00682-7. [DOI] [PubMed] [Google Scholar]
- 31.Meador WE, Means AR, Quiocho FA. Target enzyme recognition by calmodulin: 2.4 Å structure of a calmodulin-peptide complex. Science. 1992;257:1251–5. doi: 10.1126/science.1519061. [DOI] [PubMed] [Google Scholar]
- 32.Meador WE, Means AR, Quiocho FA. Modulation of calmodulin plasticity in molecular recognition on the basis of X-ray structures. Science. 1993;262:1718–21. doi: 10.1126/science.8259515. [DOI] [PubMed] [Google Scholar]
- 33.Osawa M, Tokumitsu H, Swindells MB, Kurihara H, Orita M, Shibanuma T, Furuya T, Ikura M. A novel target recognition revealed by calmodulin in complex with Ca2+-calmodulin-dependent kinase kinase. Nat Struct Biol. 1999;6:819–24. doi: 10.1038/12271. [DOI] [PubMed] [Google Scholar]
- 34.Kurokawa H, Osawa M, Kurihara H, Katayama N, Tokumitsu H, Swindells MB, Kainosho M, Ikura M. Target-induced conformational adaptation of calmodulin revealed by the crystal structure of a complex with nematode Ca2+/calmodulin-dependent kinase kinase peptide. J Mol Biol. 2001;312:59–68. doi: 10.1006/jmbi.2001.4822. [DOI] [PubMed] [Google Scholar]
- 35.Yamauchi E, Nakatsu T, Matsubara M, Kato H, Taniguchi H. Crystal structure of a MARCKS peptide containing the calmodulin-binding domain in complex with Ca2+-calmodulin. Nat Struct Biol. 2003;10:226–31. doi: 10.1038/nsb900. [DOI] [PubMed] [Google Scholar]
- 36.Maximciuc AA, Putkey JA, Shamoo Y, Mackenzie KR. Complex of calmodulin with a ryanodine receptor target reveals a novel, flexible binding mode. Structure. 2006;14:1547–56. doi: 10.1016/j.str.2006.08.011. [DOI] [PubMed] [Google Scholar]
- 37.Xiong L, Kleerekoper QK, He R, Putkey JA, Hamilton SL. Sites on calmodulin that interact with the C-terminal tail of Cav1.2 channel. J Biol Chem. 2005;280:7070–9. doi: 10.1074/jbc.M410558200. [DOI] [PubMed] [Google Scholar]
- 38.Putkey JA, Kleerekoper Q, Gaertner TR, Waxham MN. A new role for IQ motif proteins in regulating calmodulin function. J Biol Chem. 2003;278:49667–70. doi: 10.1074/jbc.C300372200. [DOI] [PubMed] [Google Scholar]
- 39.Kleerekoper QK, Putkey JA. PEP-19, an intrinsically disordered regulator of calmodulin signaling. J Biol Chem. 2009;284:7455–64. doi: 10.1074/jbc.M808067200. [DOI] [PMC free article] [PubMed] [Google Scholar]
- 40.Wang X, Kleerekoper QK, Xiong LW, Putkey JA. Intrinsically disordered PEP-19 confers unique dynamic properties to apo and calcium calmodulin. Biochemistry. 2010;49:10287–97. doi: 10.1021/bi100500m. [DOI] [PMC free article] [PubMed] [Google Scholar]
- 41.Vance JE, Steenbergen R. Metabolism and functions of phosphatidylserine. Prog Lipid Res. 2005;44:207–34. doi: 10.1016/j.plipres.2005.05.001. [DOI] [PubMed] [Google Scholar]
- 42.Yeung T, Gilbert GE, Shi J, Silvius J, Kapus A, Grinstein S. Membrane phosphatidylserine regulates surface charge and protein localization. Science. 2008;319:210–3. doi: 10.1126/science.1152066. [DOI] [PubMed] [Google Scholar]
- 43.Gottfried EL. Lipids of human leukocytes: relation to celltype. J Lipid Res. 1967;8:321–7. [PubMed] [Google Scholar]
- 44.Crane JM, Kiessling V, Tamm LK. Measuring lipid asymmetry in planar supported bilayers by fluorescence interference contrast microscopy. Langmuir. 2005;21:1377–88. doi: 10.1021/la047654w. [DOI] [PubMed] [Google Scholar]
- 45.Zachowski A. Phospholipids in animal eukaryotic membranes: transverse asymmetry and movement. Biochem J. 1993;294:1–14. doi: 10.1042/bj2940001. [DOI] [PMC free article] [PubMed] [Google Scholar]
- 46.Lehrer SS. Solute perturbation of protein fluorescence. The quenching of the tryptophyl fluorescence of model compounds and of lysozyme by iodide ion. Biochemistry. 1971;10:3254–63. doi: 10.1021/bi00793a015. [DOI] [PubMed] [Google Scholar]
- 47.Lehrer SS, Leavis PC. Solute quenching of protein fluorescence. Methods Enzymol. 1978;49:222–36. doi: 10.1016/s0076-6879(78)49012-3. [DOI] [PubMed] [Google Scholar]
- 48.Chiba K, Kurashima S, Mohri T. Interaction between lipids and bovine brain calmodulin: lysophosphatidylcholine-induced conformation change. Life Sci. 1990;47:953–60. doi: 10.1016/0024-3205(90)90542-y. [DOI] [PubMed] [Google Scholar]
- 49.Chiba K, Mohri T. Conformation change of the intestinal calcium-binding protein induced by phospholipids in the presence and absence of Ca2+ Biochemistry. 1989;28:2995–9. doi: 10.1021/bi00433a039. [DOI] [PubMed] [Google Scholar]
- 50.Sato T, Pallavi P, Golebiewska U, McLaughlin S, Smith SO. Structure of the membrane reconstituted transmembrane-juxtamembrane peptide EGFR(622–660) and its interaction with Ca2+/calmodulin. Biochemistry. 2006;45:12704–14. doi: 10.1021/bi061264m. [DOI] [PubMed] [Google Scholar]
- 51.Killock DJ, Parsons M, Zarrouk M, Ameer-Beg SM, Ridley AJ, Haskard DO, Zvelebil M, Ivetic A. In Vitro and in Vivo Characterization of Molecular Interactions between Calmodulin, Ezrin/Radixin/Moesin, and L-selectin. J Biol Chem. 2009;284:8833–45. doi: 10.1074/jbc.M806983200. [DOI] [PMC free article] [PubMed] [Google Scholar]
- 52.Niggli V, Andreoli C, Roy C, Mangeat P. Identification of a phosphatidylinositol-4,5-bisphosphate-binding domain in the N-terminal region of ezrin. FEBS Lett. 1995;376:172–6. doi: 10.1016/0014-5793(95)01270-1. [DOI] [PubMed] [Google Scholar]
- 53.Yonemura S, Hirao M, Doi Y, Takahashi N, Kondo T, Tsukita S. Ezrin/radixin/moesin (ERM) proteins bind to a positively charged amino acid cluster in the juxta-membrane cytoplasmic domain of CD44, CD43, and ICAM-2. J Cell Biol. 1998;140:885–95. doi: 10.1083/jcb.140.4.885. [DOI] [PMC free article] [PubMed] [Google Scholar]
- 54.Barret C, Roy C, Montcourrier P, Mangeat P, Niggli V. Mutagenesis of the phosphatidylinositol 4,5-bisphosphate (PIP2) binding site in the NH2-terminal domain of ezrin correlates with its altered cellular distribution. J Cell Biol. 2000;151:1067–80. doi: 10.1083/jcb.151.5.1067. [DOI] [PMC free article] [PubMed] [Google Scholar]
- 55.Hamada K, Shimizu T, Matsui T, Tsukita S, Hakoshima T. Structural basis of the membrane-targeting and unmasking mechanisms of the radixin FERM domain. EMBO J. 2000;19:4449–62. doi: 10.1093/emboj/19.17.4449. [DOI] [PMC free article] [PubMed] [Google Scholar]
- 56.Sengupta P, Ruano MJ, Tebar F, Golebiewska U, Zaitseva I, Enrich C, McLaughlin S, Villalobo A. Membrane-permeable calmodulin inhibitors (e.g. W-7/W-13) bind to membranes, changing the electrostatic surface potential: dual effect of W-13 on epidermal growth factor receptor activation. J Biol Chem. 2007;282:8474–86. doi: 10.1074/jbc.M607211200. [DOI] [PubMed] [Google Scholar]
- 57.Pace CN, Vajdos F, Fee L, Grimsley G, Gray T. How to measure and predict the molar absorption coefficient of a protein. Protein Sci. 1995;4:2411–23. doi: 10.1002/pro.5560041120. [DOI] [PMC free article] [PubMed] [Google Scholar]
- 58.Waxham MN, Tsai AL, Putkey JA. A mechanism for calmodulin (CaM) trapping by CaM-kinase II defined by a family of CaM-binding peptides. J Biol Chem. 1998;273:17579–84. doi: 10.1074/jbc.273.28.17579. [DOI] [PubMed] [Google Scholar]
- 59.Viguera AR, Arrondo JL, Musacchio A, Saraste M, Serrano L. Characterization of the interaction of natural proline-rich peptides with five different SH3 domains. Biochemistry. 1994;33:10925–33. doi: 10.1021/bi00202a011. [DOI] [PubMed] [Google Scholar]
- 60.Wintrode PL, Privalov PL. Energetics of target peptide recognition by calmodulin: a calorimetric study. J Mol Biol. 1997;266:1050–62. doi: 10.1006/jmbi.1996.0785. [DOI] [PubMed] [Google Scholar]
Associated Data
This section collects any data citations, data availability statements, or supplementary materials included in this article.