

Abstract
Background
Alcohol abuse has long-term deleterious effects on the immune system, and results in a depletion and loss of function of CD4+ T lymphocytes, which regulate both innate and adaptive immunity. T-lymphocyte activation via T-cell receptor (TCR) involves the lipid raft colocalization and aggregation of proteins into the immunological signalosome, which triggers a signaling cascade resulting in the production of interleukin-2 (IL-2). IL-2 regulates the proliferation and clonal expansion of activated T cells and is essential for an effective immune response. The present work examines the mechanisms underlying ethanol-induced dysfunction of CD4+ T lymphocytes based on the hypothesis that ethanol downregulates lipid raft-mediated TCR signal transduction and resultant IL-2 production.
Methods
Primary or cultured human T lymphocytes were exposed to ethanol for 24 hours prior to stimulation with anti-CD3/anti-CD28 antibodies or phytohemagglutinin. Effects of ethanol exposure on TCR-signaling (including activation of Lck, ZAP70, LAT, and PLCγ1) and IL-2 gene expression were examined.
Results
Exposure of both primary and cultured human CD4+ T lymphocytes to physiologically relevant concentrations of ethanol leads to down-regulation of IL-2 mRNA and protein via inhibition of DNA-binding activity of NFAT, the essential transcription factor for IL-2. Ethanol decreases tyrosine phosphorylation and activation of upstream signaling proteins PLCγ1, LAT, ZAP70, and Lck. These effects are prevented by inhibition of metabolism of ethanol. Sucrose density gradient fractionation and confocal microscopy revealed that ethanol inhibited essential upstream lipid raft-mediated TCR-dependent signaling events, namely colocalization of Lck, ZAP70, LAT, and PLCγ1 with plasma membrane lipid rafts.
Conclusions
Overall, our data demonstrate that ethanol inhibits lipid raft-mediated TCR-signaling in CD4+ T lymphocytes, resulting in suppression of IL-2 production. These findings may represent a novel mechanism underlying alcohol abuse-associated immune suppression and may be particularly relevant in diseases such as HIV/AIDS and hepatitis C virus infection where alcohol abuse is a known comorbidity.
Keywords: T lymphocytes, Ethanol, Interleukin-2, TCR, Lipid Raft, LAT
Alcohol abuse imposes a heavy burden on the U.S. healthcare system. Immunosuppression associated with chronic alcohol abuse is an important predisposing factor to opportunistic infections and cancer. Clinical complications of alcohol abuse are associated with induction of immune dysfunction. The mechanisms of alcohol-induced immunosuppression include defects in both humoral and cell-mediated immunity (Adams and Jordan, 1984; Eckardt et al., 1981; MacGregor, 1986; Szabo and Mandrekar, 2009). Although many types of immune cells are affected by alcohol, including neutrophils, natural killer cells, and monocytes/macrophages, the effect of alcohol on thymus-derived lymphocytes (T lymphocytes) is a major factor that contributes to overall immune suppression (Bagasra et al., 1987; Glassman et al., 1985). Additionally, clinical and experimental data show that ethanol exposure leads to alterations in the extent and pattern of T-lymphocyte cytokine production, and T-lymphocyte hyporesponsiveness (Chadha et al., 1991; Jerrells et al., 1990; Laso et al., 1999; Mutchnick and Lee, 1988; Peterson et al., 1998; Spinozzi et al., 1991). These observations suggest that alcohol intake can adversely affect T lymphocytes, leading to multiple immune defects. However, the molecular mechanisms behind these alterations are not clearly understood.
Stimulation of CD4+ T cells initiates an intracellular signaling cascade via the T-cell receptor (TCR), leading to T-cell activation and interleukin-2 (IL-2) production. These initial events take place in plasma membrane microdomains that are termed as lipid rafts. Several studies demonstrate that the clustering or aggregation of lipid rafts plays a crucial role in TCR-mediated signaling by providing a platform for recruitment of proteins involved in signal transduction (Chan et al., 1994; Hunter, 2000; Janes et al., 1999, 2000; Simons and Toomre, 2000). In the lipid rafts, TCR ligation results in the activation of a Src family kinase Lck (lymphocyte-specific protein tyrosine kinase), leading to phosphorylation of immunoreceptor-based tyrosine-activated motifs (ITAMS) on TCR-associated CD3 zeta chain (Moarefi et al., 1997; Reynolds et al., 1992). These phosphorylated ITAMS create a docking site for ZAP70 (zeta chain associated protein) to bind, which subsequently is activated via Lck phosphorylation and plays a critical role in coordinating the downstream molecular signaling essential for T-cell activation and function (Chan et al., 1992, 1995). Further, activated ZAP70 phosphorylates LAT (linker for activated T cells), an adapter protein which in turn recruits PLCγ1 (phospholipase C) to the raft assembly (Finco et al., 1998; Zhang et al., 1998a). These proximal plasma membrane lipid raft-associated signaling events initiated by TCR ligand binding lead to the activation of distal signaling components, including transcription factors like NFAT (nuclear factor for activated T cell), ultimately resulting in IL-2 gene expression (Chow et al., 1999; Porter and Clipstone, 2002).
IL-2 is a critical lymphokine and growth factor for T cells; it plays a major role in regulating both immune activation and homeostasis (Bachmann and Oxenius, 2007; Malek, 2008). It exerts a wide spectrum of effects on the immune system including the expansion of activated T cells and effector T-cell function. Furthermore, clinical conditions leading to immunosuppression such as chronic alcohol abuse are characterized by a decrease in IL-2 expression. Serum levels of IL-2 (also, alpha-interferon and gamma-interferon) are significantly depressed in alcoholic cirrhotics compared with nonalcoholic subjects (Vicente-Gutierrez et al., 1991). CD4+ T-cell function in human immunodeficiency virus (HIV) disease is markedly impaired, and these defects are accompanied by reduced production of the immunoregulatory cytokine IL-2 (Sieg et al., 2001). Moreover, ethanol-induced hyporesponsiveness of T lymphocytes involves a membrane-specific interaction which affects transmembrane signaling upon ex vivo exposure to ethanol (Spinozzi et al., 1992), suggesting that ethanol can alter membrane-associated events.
The present study investigates the mechanisms underlying the immunosuppressive effects of ethanol on proximal TCR-mediated lipid raft-associated events, as well as distal intracellular signaling events leading to IL-2 expression in CD4+ T lymphocytes. Our data show that physiologically relevant concentrations of ethanol significantly inhibited the lipid raft colocalization of essential signaling components and downregulated the activation/DNA binding of NFAT, and decreased IL-2 production in cultured as well as freshly isolated primary human T lymphocytes.
MATERIALS AND METHODS
Isolation of Human CD4+ T Lymphocytes
Peripheral blood mononuclear cells (PBMCs) were isolated from buffy coat (SeraCare Life Sciences, Milford, MA) using Histopaq (Sigma-Aldrich, St. Louis, MO). CD4+ T lymphocytes were separated using CD4 microbeads and magnetic MACS separation column according to manufacturer’s instructions (Miltenyi Biotec Inc., Auburn, CA). Briefly, PBMCs were incubated with CD4 microbeads for 15 minutes at 4°C and then washed prior to separation. Separation was performed using a mini-MACS column. The column was placed in the magnetic separator, magnetically labeled cells were passed down the column, and the column was washed extensively. The column was removed from the magnetic separator, and cells retained were eluted. The purity of sorted populations was determined by flow cytometry and was always more than 90%.
Cell Culture and Treatment
Isolated CD4+ T cells and Jurkat T cells (Clone E6-1; ATCC, Rockville, MD) were cultured in RPMI 1640 medium (Invitrogen, Carlsbad, CA) supplemented with 10% fetal bovine serum (FBS), 10 U/ml of penicillin, 10 μg/ml of streptomycin (Invitrogen) in a 37°C and 5%CO2 environment. Cells were resuspended at a concentration of 1 × 10⁶ cells/ml prior to treatment. Ethanol treatment was conducted for 24 hours, followed by stimulation with phytohemagglutinin (PHA) (5 μg/ml) or 1 μg/ml anti-CD3 and anti-CD28 antibodies.
Reagents and Antibodies
Cell culture reagents were obtained from Invitrogen. Ethyl alcohol, PHA, Hoechst 33258 dye, and 4-methylpyrazole (4-MP) were purchased from Sigma. Primary and secondary antibodies for Lck, ZAP70, LAT, and PLCγ1 and phospho-specific p-Lck, p-ZAP70, p-LAT and p-PLCγ1, as well as Alexa Fluor 555-conjugated secondary antibody, were purchased from Cell Signaling Technology Inc. (Beverly, MA). Anti-cholera toxin-B antibodies were purchased from Sigma. Anti-CD3 and anti-CD28 antibodies were obtained from BD Biosciences (San Jose, CA).
Immunoprecipitation
Cytosolic or total cellular extracts from 1 × 10⁷ cells per treatment were prepared as follows: cell pellets were washed with 1 volume of phosphate-buffered saline (PBS) followed by cell lysis in immunoprecipitation (IP) lysis buffer (25 mM Tris/HCl, pH 7.6, 150 mM NaCl, 5 mM EDTA, 1 mM Na2VO3, 50 mM glycerophosphate, 10 mM NaF, 1%Triton X-100, 0.5 mM phenylmethylsulfonylfluoride, and 1 μg/ml of leupeptin, pepstatin, and leucine thiol). The cell lysates (250 μg of protein per sample) were incubated with 2 to 4 μg of respective IP antibody and shaken overnight at 4°C. The next day, 20 μl of agarose protein A/G beads from Santa Cruz Biotechnology (Santa Cruz, CA) was added for 2 hours at 4°C. The immunoprecipitates were washed 4 times with IP lysis buffer and used for Western blot analysis.
Western Blot Analysis
The proteins were separated by electrophoresis on 12% SDS-polyacrylamide gel and transferred onto a nitrocellulose membrane. Nitrocellulose blots were blocked with 5% (w/v) nonfat dry milk constituted in 1× TBS-T (Tris buffered saline containing 10 mM Tris HCl, pH 8.0, 150 mM NaCl containing 0.1% Tween 20) for 1 hour at room temperature. Membranes were incubated at 4°C overnight with primary monoclonal antibody in 5% bovine serum albumin (BSA) in 1× TBS-T and incubated with the respective horseradish peroxidase-conjugated secondary antibodies (Transduction Lab, Lexington, KY) as directed by manufacturer. Immunoreactive bands were visualized using the enhanced chemiluminescence light (ECL) detection reagents (Amersham, Arlington Heights, IL). Data shown are representative of 2 or 3 separate experiments showing similar results.
Isolation of Lipid Rafts
Jurkat CD4+ T cells (4 × 10⁷ cells) were lysed in 0.8 ml of ice-cold MNE buffer (25 mM MES, pH 6.5, 150 mM NaCl, 2 mM EDTA) containing 1%Triton X-100, protease inhibitors (1 μg/ml of leupeptin, pepstatin, and leucine thiol), and 1 mM sodium orthovanadate. These cell lysates were brought to 2 ml using 80% sucrose solution and then overlaid with 2 ml of sucrose (30%) and 1 ml of sucrose (5%) in MNE buffer. Lysates were then centrifuged in a Beckman Optima Max ultracentrifuge using MLS 50 rotor (Beckman, Palo Alto, CA) at 268,000×g for 16 hours to separate the lipid raft from nonraft components. Fractions of 0.5 ml each were collected and analyzed by immunoblotting to identify the lipid raft components (low density and detergent resistant) and cytosolic components (high density and detergent soluble). Data shown is representative of 2 or 3 separate experiments showing similar results.
Electrophoretic Mobility Shift Assay
Double-stranded oligonucleotides containing the binding sites for NFAT (5′-ACG-CCC-AAA-GAG-GAA-AAT-TTG-TTT-CAT-ACA-3′; Alpha DNA, Montreal, QC, Canada) were used to perform the electrophoretic mobility shift assay (EMSA) by a method described elsewhere (Uriarte et al., 2005). Data shown are representative of 2 or 3 separate experiments showing similar results.
Cytokine Assay
The IL-2 enzyme-linked immunosorbent assay (ELISA) was performed on cell-free culture supernatants harvested after cell treatment as specified by the manufacturer (Biosource, Camarillo, CA).
RNA Isolation and Real-Time PCR Analysis
Real-time reverse transcriptase polymerase chain reaction (PCR) assays were used to assess IL-2 mRNA levels in CD4+ T lymphocytes. Total RNA was isolated from treated cells using TRIZOL (Invitrogen), and real-time PCR was performed as described elsewhere (Uriate et al. 2005). Specific primers were designed for human GAPDH and IL-2 using Primer3 software program, and synthesized from IDT (Integrated DNA Technologies, Coralville, IA) and sequences are as shown below:
hGAPDH-FP: 5′ TGGGCTACACTGAGCACCAG 3′
hGAPDH-RP: 5′ GGGTGTCGCTGTTGAAGTCA 3′
hIL-2-FP: 5′ GAATCCCAAACTCACCAGGA 3′
hIL-2-RP: 5′TTCAGATCCCTTTAGTTCCAGAA 3′
Confocal Microscopy
Treated cells were seeded on glass cover slips and fixed with ice-cold 4%paraformaldehyde in PBS for 20 minutes. After fixation, cells were incubated in 0.5% IGEPAL (Nonidet P-40; Sigma) for 5 minutes and then with blocking solution (3% in BSA in PBS) for 1 hour. Primary antibodies (p-PLCγ1, p-ZAP70, p-LAT, or p-Lck) were applied in blocking solution overnight at 4°C. Then, cells were incubated with Alexa Fluor 555-conjugated secondary antibody for 1 hour. After washing, cells were counterstained with Hoechst 33258 for nuclear staining and with FITC antibodies specific for cholera toxin-B subunit. After washing in PBS, cover slips were mounted in glycerol gelatin (Sigma) containing p-phenyldiamine glycerol. Cells were visualized with a Nikon D-Eclipse C1 confocal microscope using oil immersion 40× lenses (2× or 3× digital zoom), and digitized pictures were captured using EZ-C1 software (Nikon Instruments Inc., Melville, NY).
Statistical Analyses
All data are expressed as mean ± SD. Analysis of variance (ANOVA), Tukey, and the Student’s t-test were used. Differences were considered statistically significant at p < 0.05.
RESULTS
Ethanol Suppresses IL-2 Expression
The signaling events initiated at the TCR upon T-cell activation ultimately lead to IL-2 expression, which is critical for the proliferation and function of T cells. To investigate the mechanisms of alcohol-induced T-cell dysfunction, we examined the impact of the ethanol on IL-2 expression. We used Jurkat, a well-characterized human CD4+ T-lymphoma cell line, which has been extensively studied as an in vitro model for T-lymphocyte activation and function. For T-cell activation/stimulation, we used PHA, a lectin that is well known to mimic physiological stimulation of Jurkat T cells via TCR signaling. Jurkat cells were treated without or with ethanol (25 or 75 mM) for 24 hours, and stimulated with PHA for 4, 8, or 24 hours. IL-2 expression was analyzed by measuring IL-2 mRNA by quantitative real-time PCR and IL-2 protein by ELISA from cell-free culture supernatants (Fig. 1).
Fig. 1.
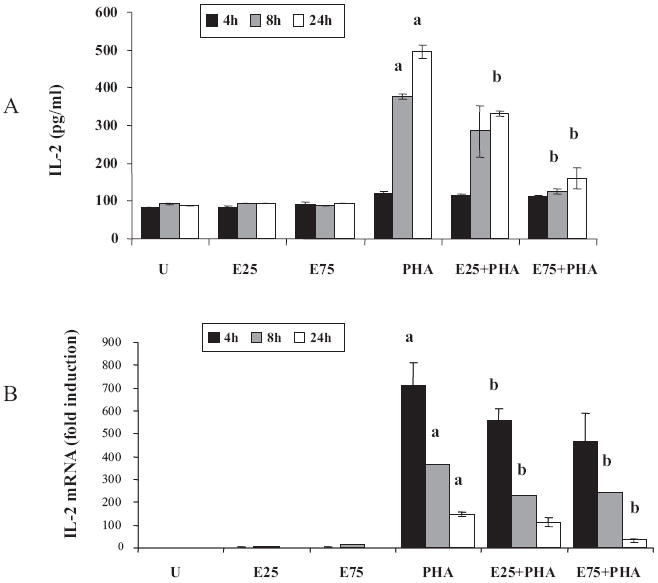
Ethanol suppresses interleukin-2 (IL-2) production in Jurkat cells. Jurkat cells were untreated (U), treated for 24 hours with 25 or 75 mM ethanol (E25 or E75) and stimulated with 5 μg/ml phytohemagglutinin (PHA) for 4 hours (black bars), 8 hours (gray bars), or 24 hours (white bars). (A) IL-2 levels were measured in cell-free supernatants using human IL-2 ELISA kit. Results are represented as mean ± SD from 3 separate experiments. Statistical analysis was performed by Student’s t-test. p-values: a = p < 0.01 when comparing to untreated, and b = p < 0.05 when comparing to PHA at the corresponding time point. (B) Total RNA was isolated and the steady-state IL-2 mRNA levels were quantified by real-time PCR. Data are expressed as fold induction over untreated. Results are represented as mean ± SD from 3 separate experiments. Statistical analysis was performed by Student’s t-test. p-values: a = p < 0.01 when comparing to untreated, and b = p < 0.01 when comparing to PHA at the corresponding time point.
Ethanol alone did not elicit appreciable changes in the levels of IL-2 protein or mRNA (Fig. 1A and 1B). As anticipated, PHA stimulation led to a large dose-dependent and time-dependent increase in IL-2 expression. In comparison with control cells, ethanol pretreatment significantly decreased PHA-stimulated IL-2 protein and mRNA in a dose-dependent manner, suggesting that ethanol inhibition was likely to be at the level of transcription of the IL-2 gene.
We also examined the inhibitory effects of ethanol on IL-2 expression in freshly isolated primary human CD4+ T lymphocytes using anti-CD3 and anti-CD28 antibodies for physiologic stimulation of the CD4+ T lymphocytes. CD4+ T lymphocytes were isolated from blood obtained from healthy donors and exposed to ethanol in vitro, followed by TCR-stimulation, and IL-2 protein and mRNA were quantified (Fig. 2). Although a substantial variability in the magnitude of response to ethanol and to anti-CD3/CD28 stimulation was observed in the different individuals, the overall results were similar in all individuals. The effect of anti-CD3/CD28 stimulation resulted in increased IL-2 production that was inhibited by ethanol preexposure (Fig. 2A). Additionally, ethanol significantly downregulated IL-2 mRNA in stimulated CD4+ T lymphocytes, again suggesting transcriptional inhibition of IL-2 (Fig. 2B). Thus, the inhibitory effects of ethanol on IL-2 expression seen in cultured cells (Jurkat) were also observed in freshly isolated primary human CD4+ T lymphocytes. Next, we attempted to identify the upstream signaling mechanisms that are affected by ethanol and that lead to down-regulation of IL-2 in CD4+ T lymphocytes.
Fig. 2.

Ethanol suppresses interleukin-2 (IL-2) expression in primary human CD4+ T lymphocytes. Freshly isolated primary human CD4+ T lymphocytes from 5 healthy donors were isolated and left untreated (U), stimulated for 24 hours with anti-CD3/CD28 antibodies (S), or treated for 24 hours with 25 mM ethanol followed by anti-CD3/CD28 stimulation (E+S). (A) IL-2 levels were measured in cell-free supernatants using human IL-2 ELISA kit. Results are represented as mean ± SD. Statistical analysis was performed by ANOVA and Tukey multiple comparison test. p-values: ***p < 0.01 compared to untreated and **p < 0.05 compared to stimulated. (B) Steady-state IL-2 mRNA levels were quantified from total RNA by real-time PCR. Data are expressed as fold induction over untreated. Results are represented as mean ± SD from 3 separate experiments. Statistical analysis was performed by ANOVA and Tukey multiple comparison test. p-values: ***p < 0.01 compared to untreated and **p < 0.01 compared to stimulated.
Ethanol Decreases T-Cell Stimulation-Induced NFAT Activation
It has been demonstrated that IL-2 expression is regulated by transcription factors such as NFAT, Oct1, and NFκB. A major consequence of T-cell stimulation is the activation of the critical transcription factor NFAT, which is essential for IL-2 expression in CD4+ T lymphocytes. The effect of ethanol on NFAT activation and DNA-binding activity was evaluated by EMSA using NFAT-specific oligonucleotide probes (Fig. 3). Nuclear extracts were obtained from T cells that were treated with ethanol (25 mM; 24 hours) and subsequently stimulated with anti-CD3/CD28 for 60 minutes; nuclear extracts from untreated (no ethanol) as well as unstimulated (no anti-CD3/CD28) cells served as controls. As expected, anti-CD3/CD28 stimulation led to a robust increase in the NFAT activation as indicated by increased DNA binding. In contrast, ethanol pretreatment greatly decreased the anti-CD3/CD28-inducible NFAT activation, almost to the level seen in untreated cells. Specificity of the EMSA assay was confirmed by competition with unlabeled NFAT probe. These findings demonstrate that the ethanol-mediated down-regulation of IL-2 expression occurs via reduced NFAT activation.
Fig. 3.

Ethanol inhibits stimulation-induced DNA-binding activity of the transcription factor NFAT. Jurkat cells were untreated (U), treated for 24 hours with 25 mM ethanol alone (E), stimulated with anti-CD3/CD28 antibodies alone for 60 minutes (S), or ethanol followed by anti-CD3/CD28 antibodies (E+S). Activation and DNA binding of NFAT (nuclear factor for activated T cell) was examined in nuclear extracts by electrophoretic mobility shift assay (EMSA). Specificity of binding was confirmed by competition (Comp) with unlabeled probe which eliminated binding.
Ethanol Inhibits Phosphorylation and Activation of PLCγ1, ZAP70, LAT, and Lck
To determine the upstream mechanism involved in the inhibition of IL-2 production by ethanol, we examined key early events in TCR stimulation of CD4+ T lymphocytes. Following TCR ligand binding, the activation of tyrosine kinases by phosphorylation is the critical initial step that links receptor binding to downstream intracellular signaling, which is essential for T-cell function. We examined the effects of ethanol on phosphorylation of the tyrosine kinases PLCγ1, ZAP70, LAT, and Lck upon TCR stimulation, without or with pre-exposure to ethanol in Jurkat T cells (Fig. 4A) and primary CD4+ T lymphocytes (Fig. 4B). Cells were untreated or exposed to 25 mM ethanol for 24 hours and subsequently stimulated with anti-CD3/CD28 (1 μg/ml) for varying time periods. Total cell lysates were analyzed by immunoblotting with the respective phosphotyrosine-specific and total antibodies. As reported in published literature, T-cell stimulation of Jurkat cells led to an early robust TRC-mediated phosphorylation of PLCγ1, ZAP70, LAT, and Lck with maximal phosphorylation occurring at 5 to 10 minutes in our system. Although ethanol by itself had no effect on the phosphorylation of any of the proteins in unstimulated cells, it significantly diminished anti-CD3/CD28-stimulated induction of phosphorylation of all 4 molecules. As a control, the samples were also analyzed for total protein levels, which were largely unchanged between treatments. We used a phospho-Src antibody to assess the activation of Lck, as a suitable phospho-Lck antibody was not available. A similar trend was seen with primary human T lymphocytes wherein ethanol significantly inhibited anti-CD3/CD28-induced phosphorylation of all 4 proteins at 24 hours, without noticeable changes in their total levels. These observations suggest that ethanol at physiologically relevant concentration (25 mM) can significantly decrease TCR-induced signal transduction by reducing the phosphorylation and activation of PLCγ1, ZAP70, LAT, and Lck.
Fig. 4.
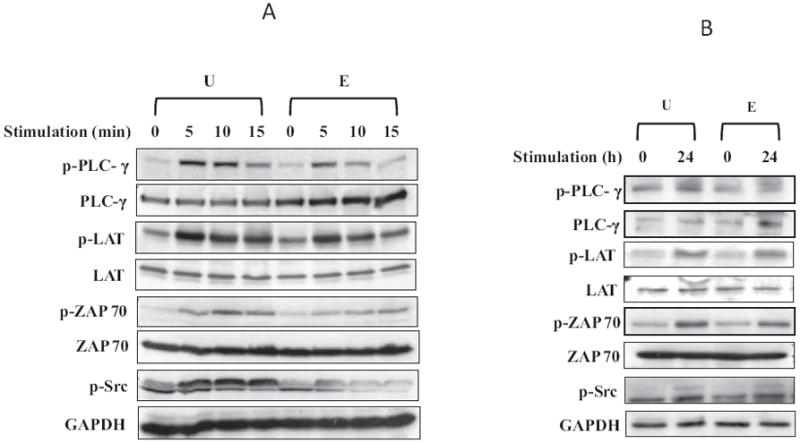
Ethanol inhibits phosphorylation of PLCγ1, ZAP70, LAT, and Lck. (A) Jurkat cells were untreated (U) or treated with 25 mM ethanol for 24 hours (E), and then stimulated with anti-CD3/CD28 antibodies (1 μg/ml) for 5, 10, or 15 minutes. (B) Freshly isolated primary human CD4+ T lymphocytes were untreated (U) or treated with 25 mM ethanol for 24 hours (E), and then stimulated with anti-CD3/CD28 antibodies (1 μg/ml) for 24 hours. Total cell extracts were resolved by SDS–PAGE and subjected to immunoblot analysis using total or phospho-specific antibodies as indicated.
Inhibition of Ethanol Metabolism Attenuates the Ethanol-Mediated Down-Regulation of TCR Signaling and IL-2 Expression
To investigate whether the metabolism of ethanol was a prerequisite for its inhibitory effects on IL-2 expression, we used 4-MP an alcohol dehydrogenase (ADH) inhibitor to block the metabolism of ethanol. The effects of MP and decreased ethanol metabolism on IL-2 gene expression were examined in PHA stimulated Jurkat cells with or without MP treatment (Fig. 5). Jurkat T cells were pretreated with MP (1 mM) for 1 hour, exposed to ethanol (25 mM) for 24 hours and subsequently stimulated with PHA (5 μg/ml). The effects of MP and decreased ethanol metabolism on TCR/lipid raft-mediated signaling were analyzed by examining Lck phosphorylation, NFAT activation, and IL-2 production (Fig. 5). To evaluate Lck activation, total lysates were prepared from cells stimulated for 5 minutes and Lck phosphorylation was examined by IP followed by immunoblotting. Treatment with MP prevented the inhibition of Lck phosphorylation caused by ethanol treatment (Fig. 5A). Consistent with its effect on Lck phosphorylation, MP was also observed to significantly attenuate the ethanol-mediated down-regulation of NFAT activation (Fig. 5B) as well as IL-2 expression (Fig. 5C). Our results clearly indicate that ethanol per se does not have any effect on TCR signal transduction; however, metabolites of ethanol and/or reactive oxidative species produced after metabolism of ethanol may be responsible for inhibition of lipid raft dependent TCR signal transduction, resulting in reduced NFAT activation and IL-2 production and consequent immune suppression.
Fig. 5.
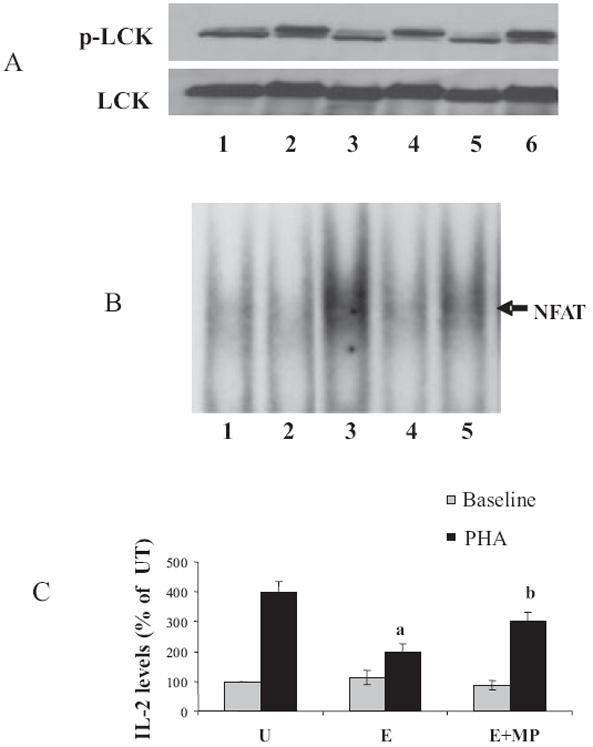
Inhibition of ethanol metabolism by 4-methylpyrazole (MP) attenuates ethanol-induced down-regulation of TCR signaling and interleukin-2 (IL-2) expression. (A) Jurkat cells were untreated (Lane 1), treated with 5 μg/ml phytohemagglutinin (PHA) alone for 5 minutes (Lane 2), or for 24 hours with 25 mM ethanol alone (Lane 3), or ethanol followed by PHA (Lane 4); some cells were subjected to a pretreatment with MP (1 mM) for 1 hour, followed by ethanol (Lane 5) or MP, ethanol and PHA (Lane 6). Total cell lysates from treated cells were immunoprecipitated with Lck antibodies and immunoblotted with specific p-Lck or Lck antibodies. (B) Jurkat cells were untreated (Lane 1), treated for 24 hours with 25 mM ethanol alone (Lane 2), 5 μg/ml PHA alone for 60 minutes (Lane 3), ethanol followed by PHA (Lane 4), or MP, followed by ethanol and then PHA (Lane 5). NFAT DNA-binding activity was examined by electrophoretic mobility shift assay in nuclear extracts. (C) IL-2 levels were assayed 24 hours poststimulation (PHA) using a human IL-2 ELISA kit in untreated (U), treated for 24 hours with 25 mM ethanol alone (E), and treated with 25 mM ethanol and 4-methylpyrazole (E + MP). Results are represented as mean ± SD from 3 separate experiments. Statistical analysis was performed by Student’s t-test. p-values: a = p < 0.01 when comparing to PHA and b = p < 0.01 when comparing to E+PHA.
Effect of Ethanol on the Proximal Lipid-Raft Associated TCR-Signaling Components
Ethanol Decreases TCR-Stimulated Colocalization of Lck and LAT with Lipid Rafts in Jurkat T Cells
TCR-mediated signaling leading to T-cell activation requires the clustering/aggregation of lipid rafts that allows the formation of the appropriate signaling assembly. The Src family kinase, Lck, resides in plasma membrane microdomains, and its activation and enrichment in the lipid rafts play a critical role in the downstream TCR signaling events. As the phospho-activation of several signaling proteins was significantly impaired by ethanol exposure, the raft localization/enrichment of raft-associated membrane proteins, Lck and LAT, was examined by lipid raft fractionation. Jurkat T cells were either left unstimulated or stimulated with PHA with or without prior exposure to 25 mM ethanol for 24 hours. Detergent resistant lipid raft and detergent soluble nonraft fractions were isolated, and the distribution of Lck and LAT was examined by immunoblotting (Fig. 6). In the absence of stimulation (U), the raft resident protein Lck was present in both raft fractions (#2 to #4) and nonraft fractions (#7 to #8). This Lck distribution was unaltered in the presence of ethanol alone (E). Upon stimulation with PHA, Lck was significantly enriched in the raft fractions and a decrease was seen in the nonraft fractions. Moreover, after stimulation, Lck appeared as a doublet, possibly corresponding to its inactive form and its phosphorylated active form. Ethanol treatment prior to PHA stimulation led to a significant reduction in the raft-associated Lck doublet (E + PHA).
Fig. 6.
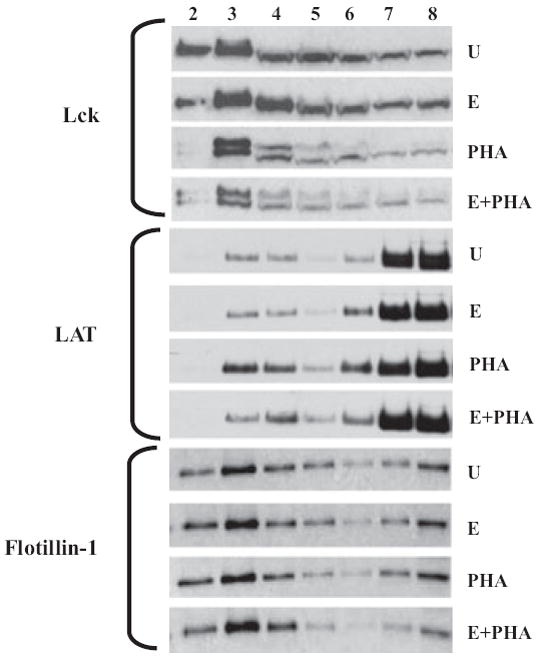
Ethanol decreases lipid raft colocalization of Lck and LAT in Jurkat cells. Jurkat cells were untreated (U), treated for 24 hours with 25 mM ethanol alone (E), 5 μg/ml phytohemagglutinin (PHA) alone for 5 minutes (PHA), or ethanol followed by PHA (E+PHA). Detergent-resistant lipid raft domains were isolated from Triton-X100 solubilized Jurkat cells using sucrose density gradient ultracentrifugation. Lipid raft colocalization of Lck and LAT, as well as raft-resident marker Flotillin, was analyzed by immunoblotting of raft (#2 to #4) and nonraft (#7 to #8) fractions using specific antibodies.
Interestingly, although LAT is thought to be constitutively associated with plasma membrane lipid rafts, it was mostly detectable in nonraft fractions with about 10% in the raft region. Ethanol exposure (without T-cell stimulation) did not cause changes in the cellular distribution of LAT. Similar to Lck, LAT was noticeably enriched in the lipid rafts upon PHA stimulation, and this increase in raft association of LAT was greatly inhibited by ethanol pretreatment. The cellular distribution of flotillin, a known constitutive marker of detergent resistant lipid rafts, was examined as a control. As expected, flotillin was found primarily in the low-density lipid raft fractions, although it was also detectable in nonraft fractions. Alcohol did not significantly change the association of flotillin with lipid rafts, demonstrating that the basic structure/assembly of lipid rafts is not altered by ethanol. Similarly, T-cell stimulation with PHA did not change the distribution of flotillin. These data suggest that ethanol does not change intrinsic lipid rafts structures but can influence the colocalization and raft recruitment of critical signaling proteins Lck and LAT.
Ethanol Inhibits Lipid Raft Colocalization of Lck, LAT, ZAP70, and PLCγ1 in Primary Human CD4+ T Lymphocytes
We used confocal microscopy as an independent method to verify our biochemical observations and examined the effect of ethanol on colocalization of key signaling proteins into lipid rafts in primary human cells. Freshly isolated human CD4+ T lymphocytes were stimulated with anti-CD3/CD28 antibodies for 10 minutes either without or with ethanol pretreatment (25 mM, 24 hours) and examined by fluorescence microscopy. We chose to focus on Lck, LAT, ZAP70, and PLCγ1, because they are all activated by phosphorylation upon TCR stimulation and are known to colocalize with plasma membrane lipid rafts. Lck and LAT are membrane-associated proteins, while ZAP70 and PLCγ1 are cytoplasmic and are transiently translocated to plasma membrane lipid rafts upon T-cell stimulation. The phosphorylated and activated forms of all 4 proteins were immunolocalized by staining with phospho-specific primary antibodies followed by fluorochrome-conjugated secondary antibodies for each protein (Fig. 7). To determine colocalization with lipid rafts, we used dual staining with an antibody specific for cholera toxin-B subunit that binds to GM1 (monosialotetrahexosylganglioside), a resident lipid raft marker protein. Cells were also counter stained with Hoechst 33258 for identification of cell nuclei.
Fig. 7.
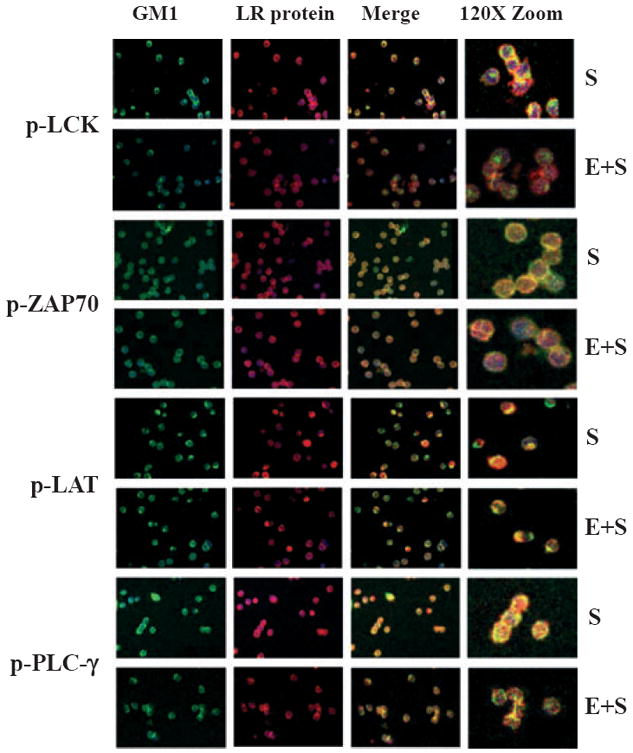
Ethanol decreases lipid raft (LR) colocalization of Lck, ZAP70, LAT, and PLCγ1 in primary human CD4+ T lymphocytes (confocal microscopy). Primary freshly isolated human CD4+ T lymphocytes were stimulated for 5 minutes with anti-CD3/CD28 antibodies (S), or treated for 24 hours with 25 mM ethanol followed by anti-CD3/CD28 stimulation (E+S). Cells were fixed, stained with specific primary antibodies (phospho-Lck, phospho-LAT, phospho-ZAP70, and phospho-PLCγ1) followed by Alexa555-tagged (RED) fluorescent secondary antibodies. The cells were counterstained with FITC (GREEN) cholera toxin subunit B antibodies and with Hoechst 33258 for nuclear identification, and examined by confocal microscopy. The color-merged images (Merge) demonstrate colocalization (increase in yellow color) of the signaling proteins with the lipid raft marker protein GM1. Some images have been magnified (Zoom) to better illustrate colocalization in the lipid rafts.
Prior to stimulation and regardless of ethanol, all 4 phospho-proteins were detectable at low levels, and pretreatment with ethanol did not result in noticeable changes in any proteins (Figure S1). Upon stimulation with anti-CD3/CD28, a bright staining pattern (red intensity) was observed in both the membrane-associated proteins Lck and LAT, and the cytosolic proteins ZAP70, and PLCγ1, suggesting increased activation by phosphorylation (Fig. 7). Moreover, phospho-Lck, phospho-ZAP70, and phospho-PLCγ1 appeared to translocate into discrete, annular, well-defined areas suggesting colocalization with aggregated plasma membrane lipid raft microdomains, although these annular ring structures were less evident with phospho-LAT. The color-merged images demonstrate colocalization (increase in yellow color) of the signaling proteins with the lipid raft marker protein GM1. Some images have been magnified (Zoom) to better illustrate colocalization in the lipid rafts.
With ethanol treatment, the inhibitory effects of ethanol were clearly evident in the merged images where diminished colocalization (intensity/extent of yellow color) of signaling proteins with lipid rafts was seen, particularly at the plasma membrane. These results confirm our biochemical data and clearly demonstrate that ethanol downregulates translocation of critical signaling proteins to membrane rafts in primary human CD4+ T cells. Thus, ethanol inhibits proximal lipid raft colocalization of key signaling components of the TCR-signaling pathway and causes down-regulation of TCR-dependent IL-2 production.
DISCUSSION
Alcohol abuse adversely affects the immune system and involves decrease of T-lymphocyte survival and function (Helm et al., 1996; Moarefi et al., 1997; Shellito and Olariu, 1998). However, the mechanisms underlying ethanol-mediated impairment of T-lymphocyte function have not been completely elucidated. In the present study, we show for the first time that ethanol exposure at physiologically relevant concentrations can alter lipid raft-dependent signaling and result in a loss of IL-2 production. These data provide initial mechanistic observations on the effects of ethanol on proximal T-cell lipid raft-associated signaling components as well as distal cellular signaling events that may be involved in the immunosuppressive effects of ethanol leading CD4+ T-cell dysfunction.
Although we used an established T-lymphocytic cell line, Jurkat, and its known stimulant PHA for certain aspects of the study, particularly where large cell numbers were required, we also confirmed our findings using freshly isolated human CD4+ T lymphocytes stimulated with anti-CD3 and anti-CD28 antibodies. We evaluated the influence of alcohol on both early and late events of T-cell activation which begin at the plasma membrane, by investigating colocalization of key proteins with lipid rafts, to the intracellular signaling cascade represented by activation of cytoplasmic components resulting in nuclear translocation of NFAT, to the final events of T-cell activation, ultimately leading to the IL-2 expression.
First, we established that ethanol decreased TCR-stimulation-dependent IL-2 production (at the level of mRNA and protein) in CD4+ T cells. This inhibition was the result of the upstream inhibition of the transcription factor NFAT, which is essential for IL-2 gene expression. These findings were confirmed in both Jurkat cells and in primary human CD4+ T lymphocytes from healthy donors. Next, we demonstrated that ethanol inhibited the phosphorylation and activation of critical signaling proteins, namely Lck, ZAP70, LAT, and PLCγ1. One of the initial membrane proximal events initiated by TCR-mediated signaling involves the phosphorylation and activation of Lck, which controls the recruitment of ZAP70 to the phosphorylated ITAMs of CD3 zeta chain leading to the enhancement of the kinase function of ZAP70 and activation of downstream signaling molecules such as LAT and PLCγ1 (Chan et al., 1995; Gong et al., 2001; Williams et al., 1999). Lck, ZAP70, and LAT phosphorylation was found to be substantially decreased in stimulated T cells pretreated with ethanol, implying that ethanol inhibits signaling is required for the formation of a functional immune synapse.
We also demonstrated that metabolism of ethanol is required for the ethanol-induced inhibition of NFAT activation and decreased IL-2 production, as inhibition of ethanol metabolism using 4-MP (a pharmacologic inhibitor of ADH) significantly prevented the inhibitory effects. Alcohol is metabolized to acetaldehyde primarily by the ADH enzymes, and to a much lesser extent by catalase and the microsomal ethanol-oxidizing system (Bullock, 1990). Although this has primarily been described in the liver, the same metabolic systems are operational in T lymphocytes (Chilin et al., 2005; Yan et al., 2011). Methylpyrazoles have been used extensively in numerous studies as potent and specific inhibitors of ADH. 4-MP is a much stronger and more specific inhibitor of ADH than pyrazole as it does not inhibit catalase. Recent studies show that 4-MP has some inhibitory activity on other enzymes, for example, fatty acyl coenzyme synthetase. However, this property does not alter the fact that it is a potent ADH inhibitor which blocks the metabolism of ethanol in our cells, and is not likely to impact our findings. Thus, inhibition of T-cell activation by ethanol involves intracellular signaling and cannot be ascribed merely to direct solvent-type interactions of ethanol in the cells. Studies are currently under way to examine the specific effects of each metabolite of alcohol such as acetaldehyde and downstream byproducts, including the lipid hydroperoxide, 4-hydroxynonenal.
Next, we explored the molecular basis of the ethanol-induced inhibition of IL-2 production and examined the cellular compartmentalization/lipid raft association of key proteins by separating detergent-resistant lipid rafts from the nonraft components using sucrose density gradients. We initially determined that ethanol by itself does not lead to significant alterations in the inherent plasma membrane lipid raft structures because no changes were seen in the migration pattern in sucrose density gradients of flotillin, a known lipid raft marker protein. On the other hand, ethanol significantly downregulates the level of Lck colocalized in the lipid rafts fractions. Also, upon stimulation, Lck appears as a doublet which may represent posttranslationally modified forms. One potential mechanism underlying this ethanol effect could be a decrease in S-acylation of Lck which is required for the correct targeting of Lck to the plasma membrane (Kabouridis et al., 1997); this is currently being investigated. Despite some debate in the literature about changes in Lck activity depending upon conformation (open or closed), association with lipid rafts, and posttranslational modifications (e.g., phosphorylation, S-acylation), it is evident that Lck localization in raft microdomains is essential for its function to couple TCR ligation to downstream signaling, as a mutant transmembrane form of Lck, which was excluded from rafts, was unable to phosphorylate the stimulated TCR (Kabouridis et al., 1997). Also, reduced TCR signaling was seen in T cells treated with 13-oxypalmitic acid, which preserves membrane-attachment of Lck but reduces its affinity for lipid rafts (Hawash et al., 2002). Hence, the inhibition in Lck raft localization because of ethanol is likely to greatly impact downstream TCR signaling.
Similar to its effects on Lck, ethanol significantly down-regulates lipid raft colocalization of LAT, a scaffold adapter protein around which a complex of downstream signaling cytoplasmic proteins get organized after TCR activation. Incorporation of LAT into lipid rafts determines its function in TCR signaling, as demonstrated by a study in which a mutant form of LAT wherein 2 membrane proximal cysteines were substituted failed to colocalize to lipid rafts and was unable to support downstream TCR-dependent signaling (Zhang et al., 1998b). Reduced lipid raft recruitment of Lck and LAT may be the primary mechanism by which ethanol inhibits distal signaling events, resulting in decreased NFAT activity and reduced IL-2 expression. Interestingly, although Lck and LAT are thought to be constitutively associated with plasma membrane lipid rafts, we find substantial amounts of both proteins detected in the nonraft fractions. Our findings are consistent with other reports that compared detergent-soluble and detergent-insoluble lysates from Jurkat T cells and found that only about 25 to 50% of total Lck copurifies with the raft fractions (Janes et al., 2000). Similar findings of ethanol causing alterations in membrane-associated lipid rafts events in other cell types have been reported. Other reports showed that alcohol altered TLR4 and CD14 association with lipid rafts and downregulated TLR4-induced cytokine production in monocytes, macrophages, and Chinese hamster ovary cells (Dai and Pruett, 2006; Dai et al., 2005; Dolganiuc et al., 2006; Szabo et al., 2007). Interestingly, another study found that ethanol exhibited hormesis and exerted opposite effects depending on the dose. At high concentrations of ethanol (100 mM) or in the presence of lipopolysaccharide, ethanol suppressed the Toll-like receptor 4 (TLR4) response, while low to moderate levels (10 to 50 mM) activated the TLR4 response and triggered the stimulation of the mitogen-activated protein kinases (MAPKs) and NFκB pathways, leading to the production of nitric oxide and inflammatory cytokines in murine macrophages (Fernandez-Lizarbe et al., 2008). Thus, the membrane/lipid rafts effects may be a common mechanism by which ethanol alters receptor-dependent signaling in a variety of cell types.
The study of lipid rafts has been fraught with problems because of the fact that lipid rafts are small, variable, transient, and highly dynamic structures that are difficult to visualize. For lipid raft isolation, we used purified detergent-resistant membranes (DRMs), which have been widely used to study TCR signaling in T cells, although there is some debate about how faithfully they represent lipid raft structures in live cells because of possible formation of nonphysiological DRM structures (Shaw, 2006). An alternate approach to study rafts has been to measure the proximity of raft components by the method of fluorescence energy transfer (FRET). However, this technique also has its limitations, one being that as only a small fraction of any raft component may be actually in rafts at a given time, the FRET signal of this fraction would be swamped by the FRET between randomly distributed molecules. Fluorescence microscopy has also been used extensively in the field, using fluorophores conjugated to raft or nonraft protein (e.g., cholera-toxin B-subunit, which binds to the raft constituent ganglioside GM1). We used confocal microscopy as an independent method to better visualize the effect of ethanol on lipid rafts and their colocalization with components of the TCR signaling machinery. T-cell stimulation with antigen-presenting cells is demonstrated to lead to the formation of a defined single-point TCR-immune synapse, also called “capping.” Because we used unbound CD3 and CD28 antibodies for T-cell stimulation in our study, we do not observe this “cap formation”; instead, we saw annular, ring-like aggregation of TCR-signaling proteins at the plasma membrane lipid rafts. Upon T-cell stimulation, we observed colocalization of activated/phosphorylated TCR-signaling proteins with the plasma membrane lipid raft marker GM1 using dual staining immuno-cytochemical fluorescence microscopy; this lipid raft colocalization was decreased by ethanol exposure. Thus, our confocal data corroborate the findings obtained by differential detergent solubilization and clearly demonstrate that ethanol decreases activation and lipid raft colocalization of key signaling proteins including phospho-Lck, phospho-LAT, phospho-ZAP70, and phospho-PLCγ1 in primary human CD4+ T lymphocytes.
Overall, our data strongly suggest that ethanol can impede activation of T cells through the inhibition of proximal lipid raft-associated TCR signaling events involving activation by phosphorylation and lipid raft-colocalization of Lck, ZAP70, LAT, and PLCγ1. Because T-cell proliferation, clonal expansion, and effector functions are all critically dependent on IL-2 expression, our observations have great relevance to alcohol abuse-associated immune dysfunction, especially in diseases such as HIV/AIDS and hepatitis C virus infection where alcohol abuse is a known comorbidity.
Supplementary Material
Acknowledgments
This work was supported by NIH grants RO1AA014371 and RO1AA018016 (SB); RO1AI048850 (JS); R37AA010762, RO1DK071765, RO1AA015970, PO1AA017103, RO1AA018016, RO1AA018869, RC2AA019385, P30AA019360 and VAMC (CM); and KO1ES017105 (SJ-B).
Footnotes
SUPPORTING INFORMATION Additional supporting information may be found in the online version of this article:
Figure S1. Ethanol alone does not alter localization of LCK, ZAP 70, LAT and PLCγ1 in primary human CD4+ T lymphocytes (confocal microscopy).
Please note: Wiley-Blackwell is not responsible for the content or functionality of any supporting information supplied by the authors. Any queries (other than missing material) should be directed to the corresponding author for the article.
References
- Adams HG, Jordan C. Infections in the alcoholic. Med Clin North Am. 1984;68:179–200. doi: 10.1016/s0025-7125(16)31249-4. [DOI] [PubMed] [Google Scholar]
- Bachmann MF, Oxenius A. Interleukin 2: from immunostimulation to immunoregulation and back again. EMBO Rep. 2007;8:1142–1148. doi: 10.1038/sj.embor.7401099. [DOI] [PMC free article] [PubMed] [Google Scholar]
- Bagasra O, Howeedy A, Dorio R, Kajdacsy-Balla A. Functional analysis of T-cell subsets in chronic experimental alcoholism. Immunology. 1987;61:63–69. [PMC free article] [PubMed] [Google Scholar]
- Bullock C. The biochemistry of alcohol metabolism—A brief review. Biochem Educ. 1990;18:62–66. [Google Scholar]
- Chadha KC, Stadler I, Albini B, Nakeeb SM, Thacore HR. Effect of alcohol on spleen cells and their functions in C57BL/6 mice. Alcohol. 1991;8:481–485. doi: 10.1016/s0741-8329(91)90187-2. [DOI] [PubMed] [Google Scholar]
- Chan AC, Dalton M, Johnson R, Kong GH, Wang T, Thoma R, Kurosaki T. Activation of ZAP-70 kinase activity by phosphorylation of tyrosine 493 is required for lymphocyte antigen receptor function. EMBO J. 1995;14:2499–2508. doi: 10.1002/j.1460-2075.1995.tb07247.x. [DOI] [PMC free article] [PubMed] [Google Scholar]
- Chan AC, Desai DM, Weiss A. The role of protein tyrosine kinases and protein tyrosine phosphatases in T cell antigen receptor signal transduction. Annu Rev Immunol. 1994;12:555–592. doi: 10.1146/annurev.iy.12.040194.003011. [DOI] [PubMed] [Google Scholar]
- Chan AC, Iwashima M, Turck CW, Weiss A. ZAP-70: a 70 kd protein-tyrosine kinase that associates with the TCR zeta chain. Cell. 1992;71:649–662. doi: 10.1016/0092-8674(92)90598-7. [DOI] [PubMed] [Google Scholar]
- Chilin A, Dodoni G, Frezza C, Guiotto A, Barbieri V, Di Lisa F, Canton M. 4-Hydroxymethyl-1,6,8-trimethylfuro[2,3-h]quinolin-2(1H)-one induces mitochondrial dysfunction and apoptosis upon its intracellular oxidation. J Med Chem. 2005;48:192–199. doi: 10.1021/jm0493919. [DOI] [PubMed] [Google Scholar]
- Chow CW, Rincon M, Davis RJ. Requirement for transcription factor NFAT in interleukin-2 expression. Mol Cell Biol. 1999;19:2300–2307. doi: 10.1128/mcb.19.3.2300. [DOI] [PMC free article] [PubMed] [Google Scholar]
- Dai Q, Pruett SB. Ethanol suppresses LPS-induced Toll-like receptor 4 clustering, reorganization of the actin cytoskeleton, and associated TNF-alpha production. Alcohol Clin Exp Res. 2006;30:1436–1444. doi: 10.1111/j.1530-0277.2006.00172.x. [DOI] [PubMed] [Google Scholar]
- Dai Q, Zhang J, Pruett SB. Ethanol alters cellular activation and CD14 partitioning in lipid rafts. Biochem Biophys Res Commun. 2005;332:37–42. doi: 10.1016/j.bbrc.2005.04.088. [DOI] [PubMed] [Google Scholar]
- Dolganiuc A, Bakis G, Kodys K, Mandrekar P, Szabo G. Acute ethanol treatment modulates Toll-like receptor-4 association with lipid rafts. Alcohol Clin Exp Res. 2006;30:76–85. doi: 10.1111/j.1530-0277.2006.00003.x. [DOI] [PubMed] [Google Scholar]
- Eckardt MJ, Harford TC, Kaelber CT, Parker ES, Rosenthal LS, Ryback RS, Salmoiraghi GC, Vanderveen E, Warren KR. Health hazards associated with alcohol consumption. JAMA. 1981;246:648–666. [PubMed] [Google Scholar]
- Fernandez-Lizarbe S, Pascual M, Gascon MS, Blanco A, Guerri C. Lipid rafts regulate ethanol-induced activation of TLR4 signaling in murine macrophages. Mol Immunol. 2008;45:2007–2016. doi: 10.1016/j.molimm.2007.10.025. [DOI] [PubMed] [Google Scholar]
- Finco TS, Kadlecek T, Zhang W, Samelson LE, Weiss A. LAT is required for TCR-mediated activation of PLCgamma 1 and the Ras pathway. Immunity. 1998;9:617–626. doi: 10.1016/s1074-7613(00)80659-7. [DOI] [PubMed] [Google Scholar]
- Glassman AB, Bennett CE, Randall CL. Effects of ethyl alcohol on human peripheral lymphocytes. Arch Pathol Lab Med. 1985;109:540–542. [PubMed] [Google Scholar]
- Gong Q, Jin X, Akk AM, Foger N, White M, Gong G, Bubeck Wardenburg J, Chan AC. Requirement for tyrosine residues 315 and 319 within zeta chain-associated protein 70 for T cell development. J Exp Med. 2001;194:507–518. doi: 10.1084/jem.194.4.507. [DOI] [PMC free article] [PubMed] [Google Scholar]
- Hawash IY, Hu XE, Adal A, Cassady JM, Geahlen RL, Harrison ML. The oxygen-substituted palmitic acid analogue, 13-oxypalmitic acid, inhibits Lck localization to lipid rafts and T cell signaling. Biochim Biophys Acta. 2002;1589:140–150. doi: 10.1016/s0167-4889(02)00165-9. [DOI] [PubMed] [Google Scholar]
- Helm RM, Wheeler G, Burks AW, Hakkak R, Badger TM. Flow cytometric analysis of lymphocytes from rats following chronic ethanol treatment. Alcohol. 1996;13:467–471. doi: 10.1016/0741-8329(96)00036-5. [DOI] [PubMed] [Google Scholar]
- Hunter T. Signaling—2000 and beyond. Cell. 2000;100:113–127. doi: 10.1016/s0092-8674(00)81688-8. [DOI] [PubMed] [Google Scholar]
- Janes PW, Ley SC, Magee AI. Aggregation of lipid rafts accompanies signaling via the T cell antigen receptor. J Cell Biol. 1999;147:447–461. doi: 10.1083/jcb.147.2.447. [DOI] [PMC free article] [PubMed] [Google Scholar]
- Janes PW, Ley SC, Magee AI, Kabouridis PS. The role of lipid rafts in T cell antigen receptor (TCR) signalling. Semin Immunol. 2000;12:23–34. doi: 10.1006/smim.2000.0204. [DOI] [PubMed] [Google Scholar]
- Jerrells TR, Smith W, Eckardt MJ. Murine model of ethanol-induced immunosuppression. Alcohol Clin Exp Res. 1990;14:546–550. doi: 10.1111/j.1530-0277.1990.tb01197.x. [DOI] [PubMed] [Google Scholar]
- Kabouridis PS, Magee AI, Ley SC. S-acylation of LCK protein tyrosine kinase is essential for its signalling function in T lymphocytes. EMBO J. 1997;16:4983–4998. doi: 10.1093/emboj/16.16.4983. [DOI] [PMC free article] [PubMed] [Google Scholar]
- Laso FJ, Iglesias-Osma C, Ciudad J, Lopez A, Pastor I, Orfao A. Chronic alcoholism is associated with an imbalanced production of Th-1/Th-2 cytokines by peripheral blood T cells. Alcohol Clin Exp Res. 1999;23:1306–1311. [PubMed] [Google Scholar]
- MacGregor RR. Alcohol and immune defense. JAMA. 1986;256:1474–1479. [PubMed] [Google Scholar]
- Malek TR. The biology of interleukin-2. Annu Rev Immunol. 2008;26:453–479. doi: 10.1146/annurev.immunol.26.021607.090357. [DOI] [PubMed] [Google Scholar]
- Moarefi I, LaFevre-Bernt M, Sicheri F, Huse M, Lee CH, Kuriyan J, Miller WT. Activation of the Src-family tyrosine kinase Hck by SH3 domain displacement. Nature. 1997;385:650–653. doi: 10.1038/385650a0. [DOI] [PubMed] [Google Scholar]
- Mutchnick MG, Lee HH. Imparied lymphocyte proliferative response to mitogen in alcoholic patients. Absence of a relation to liver disease activity. Alcohol Clin Exp Res. 1988;12:155–158. doi: 10.1111/j.1530-0277.1988.tb00151.x. [DOI] [PubMed] [Google Scholar]
- Peterson JD, Herzenberg LA, Vasquez K, Waltenbaugh C. Glutathione levels in antigen-presenting cells modulate Th1 versus Th2 response patterns. Proc Natl Acad Sci USA. 1998;95:3071–3076. doi: 10.1073/pnas.95.6.3071. [DOI] [PMC free article] [PubMed] [Google Scholar]
- Porter CM, Clipstone NA. Sustained NFAT signaling promotes a Th1-like pattern of gene expression in primary murine CD4+ T cells. J Immunol. 2002;168:4936–4945. doi: 10.4049/jimmunol.168.10.4936. [DOI] [PubMed] [Google Scholar]
- Reynolds PJ, Hurley TR, Sefton BM. Functional analysis of the SH2 and SH3 domains of the lck tyrosine protein kinase. Oncogene. 1992;7:1949–1955. [PubMed] [Google Scholar]
- Shaw AS. Lipid rafts: now you see them, now you don’t. Nat Immunol. 2006;7:1139–1142. doi: 10.1038/ni1405. [DOI] [PubMed] [Google Scholar]
- Shellito JE, Olariu R. Alcohol decreases T-lymphocyte migration into lung tissue in response to Pneumocystis carinii and depletes T-lymphocyte numbers in the spleens of mice. Alcohol Clin Exp Res. 1998;22:658–663. doi: 10.1111/j.1530-0277.1998.tb04308.x. [DOI] [PubMed] [Google Scholar]
- Sieg SF, Bazdar DA, Harding CV, Lederman MM. Differential expression of interleukin-2 and gamma interferon in human immunodeficiency virus disease. J Virol. 2001;75:9983–9985. doi: 10.1128/JVI.75.20.9983-9985.2001. [DOI] [PMC free article] [PubMed] [Google Scholar]
- Simons K, Toomre D. Lipid rafts and signal transduction. Nat Rev Mol Cell Biol. 2000;1:31–39. doi: 10.1038/35036052. [DOI] [PubMed] [Google Scholar]
- Spinozzi F, Agea E, Fiorucci G, Gerli R, Muscat C, Belia S, Bertotto A. Ethanol-induced CD3 and CD2 hyporesponsiveness of peripheral blood T lymphocytes. Immunopharmacol Immunotoxicol. 1992;14:939–953. doi: 10.3109/08923979209009243. [DOI] [PubMed] [Google Scholar]
- Spinozzi F, Bertotto A, Rondoni F, Gerli R, Scalise F, Grignani F. T-lymphocyte activation pathways in alcoholic liver disease. Immunology. 1991;73:140–146. [PMC free article] [PubMed] [Google Scholar]
- Szabo G, Dolganiuc A, Dai Q, Pruett SB. TLR4, ethanol, and lipid rafts: a new mechanism of ethanol action with implications for other receptor-mediated effects. J Immunol. 2007;178:1243–1249. doi: 10.4049/jimmunol.178.3.1243. [DOI] [PubMed] [Google Scholar]
- Szabo G, Mandrekar P. A recent perspective on alcohol, immunity, and host defense. Alcohol Clin Exp Res. 2009;33:220–232. doi: 10.1111/j.1530-0277.2008.00842.x. [DOI] [PMC free article] [PubMed] [Google Scholar]
- Uriarte SM, Joshi-Barve S, Song Z, Sahoo R, Gobejishvili L, Jala VR, Haribabu B, McClain C, Barve S. Akt inhibition upregulates FasL, downregulates c-FLIPs and induces caspase-8-dependent cell death in Jurkat T lymphocytes. Cell Death Differ. 2005;12:233–242. doi: 10.1038/sj.cdd.4401549. [DOI] [PubMed] [Google Scholar]
- Vicente-Gutierrez MM, Diez Ruiz A, Gil Extremera B, Bermudez Garcia JM, Gutierrez Gea F. Low serum levels of alpha-interferon, gamma-interferon, and interleukin-2 in alcoholic cirrhosis. Dig Dis Sci. 1991;36:1209–1212. doi: 10.1007/BF01307510. [DOI] [PubMed] [Google Scholar]
- Williams BL, Irvin BJ, Sutor SL, Chini CC, Yacyshyn E, Bubeck Wardenburg J, Dalton M, Chan AC, Abraham RT. Phosphorylation of Tyr319 in ZAP-70 is required for T-cell antigen receptor-dependent phospholipase C-gamma1 and Ras activation. EMBO J. 1999;18:1832–1844. doi: 10.1093/emboj/18.7.1832. [DOI] [PMC free article] [PubMed] [Google Scholar]
- Yan Y, Yang J, Mou Y, Wang L, Zhang H, Wu C. Possible metabolic pathways of ethanol responsible for oxidative DNA damage in human peripheral lymphocytes. Alcohol Clin Exp Res. 2011;35:1–9. doi: 10.1111/j.1530-0277.2010.01316.x. [DOI] [PubMed] [Google Scholar]
- Zhang W, Sloan-Lancaster J, Kitchen J, Trible RP, Samelson LE. LAT: the ZAP-70 tyrosine kinase substrate that links T cell receptor to cellular activation. Cell. 1998a;92:83–92. doi: 10.1016/s0092-8674(00)80901-0. [DOI] [PubMed] [Google Scholar]
- Zhang W, Trible RP, Samelson LE. LAT palmitoylation: its essential role in membrane microdomain targeting and tyrosine phosphorylation during T cell activation. Immunity. 1998b;9:239–246. doi: 10.1016/s1074-7613(00)80606-8. [DOI] [PubMed] [Google Scholar]
Associated Data
This section collects any data citations, data availability statements, or supplementary materials included in this article.