

Abstract
Germinal centre (GC) reactions are central features of T-cell-driven B-cell responses, and the site where antibody-producing cells and memory B cells are generated. Within GCs, a range of complex cellular and molecular events occur which are critical for the generation of high affinity antibodies. These processes require exquisite regulation not only to ensure the production of desired antibodies, but to minimize unwanted autoreactive or low affinity antibodies. To assess whether T regulatory (Treg) cells participate in the control of GC responses, immunized mice were treated with an anti-glucocorticoid-induced tumour necrosis factor receptor-related protein (GITR) monoclonal antibody (mAb) to disrupt Treg-cell activity. In anti-GITR-treated mice, the GC B-cell pool was significantly larger compared with control-treated animals, with switched GC B cells composing an abnormally high proportion of the response. Dysregulated GCs were also observed regardless of strain, T helper type 1 or 2 polarizing antigens, and were also seen after anti-CD25 mAb treatment. Within the spleens of immunized mice, CXCR5+ and CCR7− Treg cells were documented by flow cytometry and Foxp3+ cells were found within GCs using immunohistology. Final studies demonstrated administration of either anti-transforming growth factor-β or anti-interleukin-10 receptor blocking mAb to likewise result in dysregulated GCs, suggesting that generation of inducible Treg cells is important in controlling the GC response. Taken together, these findings indicate that Treg cells contribute to the overall size and quality of the humoral response by controlling homeostasis within GCs.
Keywords: B cells, germinal centre, regulatory T cells
Introduction
The central feature of primary T-cell-driven B-cell responses is the germinal centre (GC) reaction. The GCs are structures that form within the follicles of secondary lymphoid organs after challenge with T-cell-dependent antigens. They consist of several key cell types, including specialized CD4+ T follicular helper (Tfh) cells, antigen-selected B cells and follicular dendritic cells.1–4 Importantly, GCs generate high-affinity plasma cells and memory B cells, which produce antibodies crucial for clearing the offending antigen and protecting the host upon secondary exposure. The generation of plasma and memory B cells within GCs entails a range of complex cellular and molecular events including proliferation, apoptosis, isotype switching, somatic hypermutation and antigen-driven selection of high-affinity clones.1–4 Given the dynamic nature of GCs, and the need to carefully monitor the specificity of GC-derived B cells, it is clear that exquisite regulation is required.
Using experimental T-cell-dependent antigens, our laboratory previously demonstrated that the primary splenic GC reaction exhibits characteristics consistent with a high degree of regulation.1,5,6 The GC response to sheep red blood cells (SRBC) or 4-hydroxy-3-nitrophenylacetyl-keyhole limpet haemocyanin displayed clearly defined kinetics with induction, maintenance and dissociative phases, similar to earlier reports.7,8 Surprisingly, these studies also demonstrated splenic GC responses to be characterized by a steady ratio of IgM+ to IgM− switched B cells, with the former constituting at least half of the GC population.1,5,6 Hence, regardless of the phase of the response, and the presence of ongoing class switching and differentiation,9 a steady proportion of IgM+ to switched GC B cells was strictly enforced.
T-regulatory (Treg) cells play a central role not only in maintaining tolerance to self, but in regulating responses to exogenous antigens.10–13 This CD4+ T-cell sub-set is defined by intracellular expression of Foxp3, and consists of natural Treg cells, which develop in the thymus, and inducible Treg (iTreg) cells, which arise in the periphery from naive Foxp3− CD4+ T cells.10–15 Natural Treg cells play a central role in preventing self-reactivity, with the iTreg-cell population postulated to regulate immune reactions to novel antigens. Consistent with their key role in immune regulation, Treg cells have the ability to control or suppress a range of cell types and responses.10–13 In addition to multiple studies demonstrating suppression of effector T-cell-mediated activity, a growing body of literature has shown Treg cells to modulate B-cell responses as well.16–46 Using in vivo Treg-cell depletion or disruption protocols, numerous reports have revealed this sub-set to control levels of induced antibodies to experimental antigens,16–22 infectious agents23,24 and auto-antigens.17,25–29 In all of these studies, the loss of Treg-cell control led to increased antibody levels, especially switched isotypes.16–29 As opposed to compromising Treg-cell activity, a number of investigators used an adoptive transfer approach to enhance Treg-cell control in vivo.21,30–41 These experiments focused on control of allo-antibody21,30 or auto-antibody31–41 production and demonstrated that transfer of Treg cells depressed antibody levels as well as numbers of induced GC B cells and antibody-forming cells in recipient mice.21,30–41 In addition to in vivo studies, a number of investigators have examined the ability of purified Treg cells to suppress B-cell activity in vitro.32,40,42–46 These experiments showed that Treg cells blunt B-cell activation, expansion and antibody production in a contact-dependent manner.
Based on these findings, the current report examined the behaviour of GC B-cell responses after disruption of Treg-cell activity. In immunized mice treated with agonistic anti-glucocorticoid-induced tumour necrosis factor receptor-related protein (GITR) monoclonal antibody (mAb), homeostatic control of induced GC reactions was markedly altered. The total splenic GC B-cell population was significantly larger, with switched B cells representing a larger proportion of the GC response. The effect of anti-GITR mAb treatment on GC behaviour was strain independent, and held true whether mice were challenged with T helper type 1 (Th1) or Th2 polarizing antigens. Phenotypic examination of the splenic Treg-cell population after immunization revealed CXCR5+ and CCR7− sub-sets, and histological studies confirmed Treg-cell migration into GCs. Final experiments demonstrated that interfering with iTreg-cell generation through either transforming growth factor-β (TGF-β) or interleukin-10 receptor (IL-10R) blockade also resulted in abnormal GC reactions. Taken together, these results are the first to show that Treg cells aid in the control of humoral responses by limiting the size of GCs, and helping to maintain a normal proportion of switched B cells.
Materials and methods
Mice
Specific pathogen-free BALB/c and C57BL/6 (B6) mice were purchased from the National Cancer Institute (Fredrick, MD). B6.FoxP3-GFP mice47 were kindly provided by Dr Alexander Rudensky (Sloan Kettering Institute, New York, NY). All protocols using mice were approved by the Institutional Animal Care and Use Committee.
Preparation of antibodies for in vivo administration
Anti-GITR mAb was obtained from the DTA-1 hybridoma (kindly provided by Dr Shimon Sakaguchi, Kyoto University, Kyoto, Japan) and anti-IL-10Rα mAb was obtained from the 1B1.3a hybridoma. Antibodies were semi-purified from HB101 (Irvine Scientific, Santa Ana, CA) serum-free supernatants by 50% ammonium sulphate precipitation. The amount of IgG in each preparation was determined with a rat IgG-specific ELISA (Jackson Immunoresearch Laboratories, West Grove, PA). Anti-TGF-β mAb was derived from the 1D11 hybridoma and purified using Protein G–Sepharose (Pierce Biotechnology, Rockford, IL). Functional activity of the purified 1D11 mAb was confirmed in vitro by reversal of TGF-β-dependent inhibition of mink lung epithelial cell growth. Throughout all purification processes, care was taken to minimize contamination with endotoxin. Purified rat IgG (Innovative Research, Novi, MI) was used as control antibody when injecting with the anti-GITR and anti-IL-10Rα mAbs. Purified mouse IgG (Innovative Research) was used as control antibody when injecting with anti-TGF-β mAb. Endotoxin levels were tested in all antibody preparations (whether prepared or purchased) using the Limulus amoebocyte assay (Associates of Cape Cod, East Falmouth, MA), and were between 12·5 and 62·5 ng/ml.
Injection protocols
Anti-GITR (DTA-1) mAb or control rat IgG was injected intraperitoneally (i.p.) at a dose of 250 μg on days −2, +1 and +5. Also, 100 μg anti-TGF-β (1D11) mAb or control mouse IgG was injected i.p. every 2 days starting at day 0 and continued until the mice were killed. Either 1 mg anti-IL-10R (1B1.3a) mAb or control rat IgG was injected i.p. on day 0. Starting in the second week, 500 μg anti-IL-10R mAb or rat IgG was injected twice weekly and continued until killing. Mice in all groups were immunized with antigen on day 0.
Antigens
Sheep red blood cells were purchased from Colorado Serum Company, Denver, CO and 200 μl 10% volume/volume SRBC solution (equivalent to 1 × 10⁸ to 5 × 10⁸ SRBC) was injected i.p. Mouse-adapted influenza A virus (IAV; A/Puerto Rico/8/34 H1N1), prepared by Dr Kevin Legge, was injected i.p. at a dose of 3 × 10⁶ mean tissue culture infectious units in 100 μl PBS. R-Phycoerythrin (R-PE) was obtained from Chromaprobe (Maryland Heights, MO) and 100 μg R-PE was precipitated in alum and injected i.p.
Staining for flow cytometry
Spleens were minced, washed with balanced salt solution, and viable mononuclear cells were obtained using density centrifugation over Fico/Lite-LM (Atlanta Biologicals, Norcross, GA). Cells were resuspended in staining buffer (balanced salt solution, 5% bovine calf serum and 0·1% sodium azide). To stain for multi-parameter flow cytometric analysis, 1 × 10⁶ to 2 × 10⁶ cells were added to 10 μl rat serum (Pel Freez, Rogers AR) and 10 μg of 2.4G2 (anti-CD16/32) to minimize background staining mediated by Fc receptor binding. Rat anti-mouse mAbs used for staining were anti-IgM (b76), anti-B220 (6B2), anti-CD4 (GK1.5), anti-CD25 (7D4), anti-GITR (DTA-1), anti-CXCR5 (biotin conjugate; BD Pharmingen, San Diego, CA) and anti-CCR7 (PE-Cy7 conjugate; eBioscience, San Diego, CA). The FITC-conjugated and unconjugated peanut agglutinin (PNA), specific for terminal galactosyl (1,3) N-acetylgalactoseamine residues, was obtained from Vector Laboratories (Burlingame, CA), and R-PE-conjugated streptavidin was purchased from Southern Biotechnology Associates (Birmingham, AL). 2.4G2, b76, 6B2, GK1.5, 7D4 and DTA-1 mAbs were semi-purified from HB101 serum-free supernatants by 50% ammonium sulphate precipitation. The mAbs and PNA were conjugated to biotin (Sigma-Aldrich, St Louis, MO) or Cy5 (Amersham Pharmacia, Piscataway, NJ) using standard procedures. Purified rat IgG (Jackson Immunoresearch Laboratories) was similarly conjugated and used for isotype controls. The appropriate primary mAbs or PNA-FITC were added to cells and incubated for 20 min on ice. When using anti-CXCR5 and anti-CCR7 mAbs to stain T cells, the primary incubation was 30 min at 37°. Cells were washed twice in staining buffer, and secondary streptavidin reagent was added to detect biotinylated antibodies. Cells were again incubated on ice for 20 min, washed twice in staining buffer, and resuspended in fixative (1% formaldehyde in 1·25 × PBS). Flow cytometric analysis was performed on a FACSCanto II (Becton Dickinson, San Jose, CA). For most experiments, 1 × 10⁵ to 5 × 10⁵ cells were collected per sample. When testing for PE-binding GC B cells, 10 × 106 cells were stained to collect a minimum of 2 × 10⁶ to 3 × 10⁶ events. All data were analysed using FlowJo software (Tree Star, Ashland, OR).
Histology
Splenic fragments from SRBC-immunized mice were snap frozen in Optimal Cutting Temperature compound (Sakura Fintech, Torrance, CA) after a 20–30 min pre-soak in a 20% sucrose/PBS solution, and stored at −80°. Eight-micrometre sections were cut on a Leica CM1900 cryostat microtome (Leica, Wetzlar, Germany), air-dried for 1 hr, fixed in acetone at −20° for 10 min and stored at −80° until staining. Sections were rehydrated in 1 × PBS and stained in a multistep process. In the first staining protocol, slides were blocked with a Tris-buffered saline solution containing Tween-20 and 10% goat serum. The slides were then incubated with unconjugated anti-CD4 mAb (RM4-5; BioLegend, San Diego, CA), washed, incubated with Cy3-conjugated goat anti-rat IgG (Jackson Immunoresearch Laboratories) and washed again. The slides were then stained with FITC-conjugated PNA (Vector Laboratories) and washed once more. In the second protocol, slides were blocked with a Tris-buffered saline solution containing Tween-20, 10% rat serum and 10 μg/ml 2.4G2 mAb. Sections were then incubated with anti-IgD mAb (FITC conjugate; BioLegend) and either biotin-conjugated anti-Foxp3 (FJK-16s; eBioscience) or biotin-conjugated rat IgG2a isotype control (eBioscience) and washed. The slides were then stained with Cy5-conjugated streptavidin (Southern Biotechnology Associates) and washed once more. Slides were mounted in VectaShield (Vector Laboratories). Stained sections were visualized using a Nikon Eclipse E600 fluorescence microscope with a Spot RT Slider digital colour camera (Diagnostic Instruments Inc., Sterling Heights, MI) and processed using Adobe Photoshop software (Adobe Systems, San Jose, CA).
Statistics
Where indicated, unpaired Student's t-test with Welch correction was applied to determine statistical significance, using the GraphPad InStat software program (La Jolla, CA).
Results
Disruption of Treg-cell function leads to dysregulated SRBC-induced GC responses
The GC response is characterized by a number of highly regulated cellular and molecular processes. Previous work from our laboratory showed that the primary GC reaction in the spleen exhibited a clearly defined kinetics with induction, expansion, plateau and dissociation phases.1,5 In general, GC responses are detected in the spleen 4–6 days after immunization, peak at days 8–12 and progressively diminish over the ensuing 2 weeks.1,5,7,8 In addition, our studies demonstrated that splenic GCs display a steady ratio of IgM+ (non-switched) B cells to switched GC B cells throughout the entire GC reaction, with at least 50% of GC B cells expressing IgM at all time-points.1,5,6 These attributes underscore the regulated nature of GC responses.
A large number of previous studies reported that Treg cells play a key role in controlling T-cell-driven antibody responses to both self and exogenous antigens.16–46 As the GC reaction is central to T-cell-dependent humoral immunity, it stands to reason that Treg cells are involved in controlling GCs as well. To test this hypothesis, immunized mice were treated with an agonistic anti-GITR mAb to disrupt the suppressive activity of Treg cells.48–50 Splenic GCs persist for at least 4 weeks so the GC response was monitored at days 8, 12, 18 and 24 post-challenge. Preliminary experiments tested the effects of continuous anti-GITR mAb injections on the GC response. When injected twice weekly for up to 4 weeks, however, anti-GITR mAb administration resulted in a high death rate in immunized mice, preventing an appropriate kinetic analysis (data not shown). Similar to previous studies18,22,23,26 a three-injection protocol was therefore used whereby 250 μg of either anti-GITR mAb or control rat IgG (rIgG) was injected on days −2, +1 and +5. Mice were immunized with SRBC on day 0 and splenic GCs were analysed during the ensuing 4 weeks. Naive mice kept in specific pathogen free conditions do not have detectable GC B cells in their spleens, as previously described1,5 and shown in Fig. 1(a). Upon challenge with SRBC, a robust GC response is induced and easily detected as a B220+ PNAhi population (refs. 1,5 and Fig. 1a). Using a multi-colour approach, the IgM+ (non-switched) B cells and switched GC B cells can be further delineated (Fig. 1a). When comparing the GC response from immunized mice injected with anti-GITR mAb or rIgG, it is clear that Treg-cell disruption resulted in a higher frequency and total number of splenic B220+ PNAhi GC B cells at all time-points examined (Fig. 1b). As expected, the ratio of IgM+ to switched GC B cells remained steady over the course of the response in control rIgG-treated mice, even as the reaction waned (Fig. 1c). However, immunized mice treated with anti-GITR mAb exhibited a higher frequency and total number of IgM− switched GC B cells at day 8, an imbalance which increased over time (Fig. 1c). When comparing the distribution of IgG isotypes expressed on switched GC B cells in anti-GITR mAb and rIgG treated mice, a significant increase in the percentage of IgG1+ GC B cells was observed at day 8 in the Treg-cell-disrupted group (data not shown). At all other time-points, IgG isotype expression within the switched GC pool did not differ between the two groups. Taken together, disruption of Treg cells led not only to a larger GC response, but to an inability to control the proportion of IgM+ to switched GC B cells.
Figure 1.
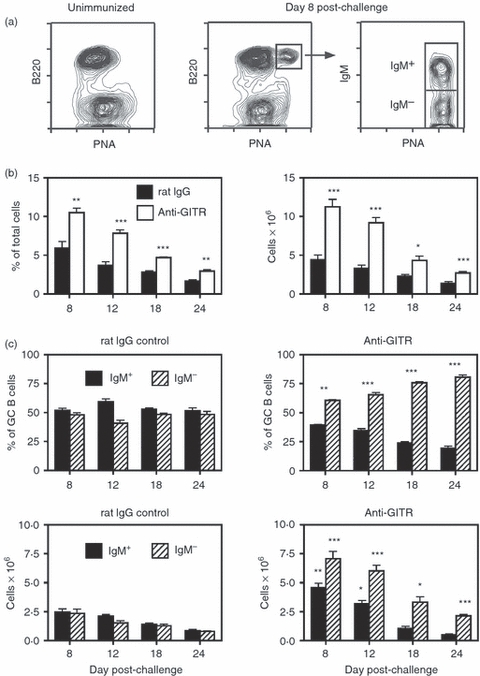
Disruption of regulatory T (Treg) cells leads to enhanced sheep red blood cell (SRBC)-induced germinal centre (GC) responses in BALB/c mice. Adult BALB/c mice were injected intraperitoneally (i.p.) with 250 μg of anti-glucocorticoid-induced tumour necrosis factor receptor-related protein (GITR) monoclonal antibody (mAb) or control rat IgG on days −2, +1 and +5. Mice were immunized on day 0 with SRBC, and spleens were harvested on days 8–24. (a) The left panel shows the absence of GC B cells [B220+ peanut agglutinin (PNA)hi] in unimmunized mice. The middle panel represents the splenic GC response in control rat IgG-treated mice 8 days post-challenge. The right panel illustrates IgM expression on the B220+ PNAhi GC population, with the IgM+ and IgM− sub-sets designated. (b) The left panel shows the percent of B220+ PNAhi GC B cells within the viable lymphocyte gated population, and the right panel represents the number of total recovered splenic GC B cells at each time-point. Closed bars = control rat IgG-treated mice. Open bars = anti-GITR mAb-treated mice. Statistical analyses were performed between rat IgG and anti-GITR groups at each time-point. (c) The two upper panels show the percentages of IgM+ (solid bars) and IgM− (hatched bars) B cells within the GC B-cell population. The two lower panels show the total number of IgM+ and IgM− GC B cells within the spleen. Left panels are from control rat IgG-treated mice and right panels are from anti-GITR mAb-treated mice. Statistical analyses were performed between IgM+ GC B cells from rat IgG and anti-GITR groups and IgM− GC B cells from rat IgG and anti-GITR groups at each time-point. Each bar represents average ± SD. There were six mice per group. *P < 0·04; **P < 0·005; ***P < 0·001.
Given the marked changes observed in splenic GC B cells after Treg-cell disruption, the non-GC (B220+ PNAlo/neg) B-cell population was also monitored. As shown in Supplementary material, Fig. S1(A), a significant difference in the total number of non-GC B cells was observed after anti-GITR mAb treatment only at day 12 post-challenge. To assess which non-GC B-cell sub-sets were affected at day 12, a detailed analysis of follicular, pre-marginal zone, marginal zone, transitional 1 (T1), T2 and B1 B cell percentages was performed (see Supplementary material, Fig. S1B,C). The proportion of follicular B cells, which compose > 85% of splenic B cells, was not significantly altered by Treg-cell disruption. However, minor, albeit significant, changes were observed in the percentage of pre-marginal zone, marginal zone, T2 and B1 B cells. Although the meaning of this observation is presently unclear, this finding suggests that Treg cells may also contribute to maintaining overall homeostasis of splenic B-cell populations.
In addition to disrupting Treg-cell activity with administration of anti-GITR mAb, a large number of studies have examined the role of Treg cells in immune responses using a depleting anti-CD25 mAb.51–55 High-dose anti-CD25 treatment deletes most but not all Treg cells, because a minority of Foxp3+ T cells in secondary lymphoid tissues are CD25.1–47,52 BALB/c mice were injected with 250 μg of either anti-CD25 mAb (PC61) or control rIgG on days −2, +1, +5 with injections continued twice weekly until the mice were killed. Mice were immunized with SRBC on day 0 and splenic GCs were examined on days 8–24. As opposed to continuous anti-GITR mAb treatment, extended anti-CD25 mAb treatment did not lead to mortality, probably because of the protective activity of residual CD25− Treg cells. Similar to mice treated with anti-GITR mAb, however, injection of anti-CD25 mAb resulted in a larger total GC response and a progressive imbalance of switched to IgM+ GC B cells (see Supplementary material, Fig. S2). Regardless of the means by which Treg-cell activity was inactivated, therefore, GC responses were markedly dysregulated.
Although both anti-GITR mAb and anti-CD25 mAb treatments are well accepted methods for inactivating Treg cells in vivo, it is possible that the mAbs may have direct effects on GC B cells. To rule out this possibility, GC B cells were tested at days 8, 12 and 18 post-immunization for expression of GITR and CD25. As shown in Supplementary material, Fig. S3, GC B cells were negative for these molecules at all time-points tested.
Treg-cell control of GC responses is strain independent
To ensure that Treg-cell control of GC responses was strain independent, C57BL/6 mice were similarly challenged with SRBC and treated with either anti-GITR mAb or control rIgG (Fig. 2). Even though control-treated C57BL/6 mice generated a smaller splenic GC reaction after SRBC immunization compared with BALB/c mice (Fig. 2a,b), the response was again characterized by a steady ratio of IgM+ to switched B cells at all time-points (Fig. 2c). Importantly, anti-GITR mAb administration resulted in a larger proportion and total number of GC B cells (Fig. 2b), especially at the early time-points, and a disproportionate percentage and number of switched GC B cells throughout the response (Fig. 2c). Similar to findings in BALB/c mice, there was also a significant increase in the percentage of IgG1+ GC B cells at day 8 in anti-GITR mAb compared with rIgG-treated mice (data not shown). The IgG isotype expression within the switched GC pool did not differ between the two groups at days 12–24.
Figure 2.
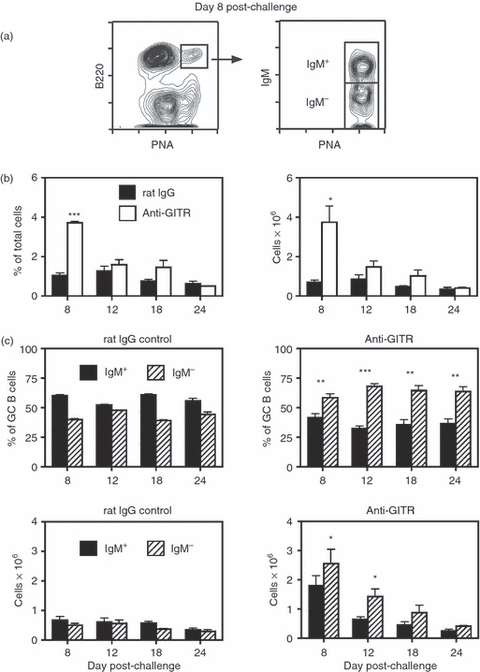
Disruption of regulatory T (Treg) cells leads to enhanced sheep red blood cell (SRBC)-induced germinal centre (GC) responses in C57BL/6 mice. Adult C57BL/6 mice were injected intraperitoneally (i.p.) with 250 μg anti-glucocorticoid-induced tumour necrosis factor receptor-related protein (GITR) monoclonal antibody (mAb) or control rat IgG on days −2, +1 and +5. Mice were immunized on day 0 with SRBC, and spleens were harvested on days 8–24. (a) The left panel shows the splenic GC response in control rat IgG-treated mice 8 days post-challenge. The right panel illustrates IgM expression on the B220+ peanut agglutinin (PNA)hi GC population, with the IgM+ and IgM− sub-sets designated. (b) The left panel shows the percentage of B220+ PNAhi GC B cells within the viable lymphocyte gated population, and the right panel represents the number of total recovered splenic GC B cells at each time-point. Closed bars = control rat IgG-treated mice. Open bars = anti-GITR mAb-treated mice. Statistical analyses were performed between rat IgG and anti-GITR groups at each time-point. (c) The two upper panels show the percentages of IgM+ (solid bars) and IgM− (hatched bars) B cells within the GC B-cell population. The two lower panels show the total number of IgM+ and IgM− GC B cells within the spleen. Left panels are from control rat IgG-treated mice and right panels are from anti-GITR mAb-treated mice. Statistical analyses were performed between IgM+ GC B cells from rat IgG and anti-GITR groups and IgM− GC B cells from rat IgG and anti-GITR groups at each time-point. Each bar represents average ± SD. There were three to seven mice per group. *P < 0·04; **P < 0·02; ***P < 0·005.
Treg cells control GC responses induced by both Th1 and Th2 antigens
In addition to demonstrating strain independence, experiments were performed to show that Treg-cell control of GC responses was also antigen independent. Figure 3 summarizes the effect of anti-GITR mAb treatment on splenic GC responses induced by i.p challenge of BALB/c mice with IAV. Whereas SRBC induce a Th2-biased response,5 IAV invokes a Th1-polarized reaction.56Figure 3(a) shows that mice immunized i.p. with IAV generate a robust splenic GC response which peaks at day 12 (Fig. 3b). Similar to Th2 antigens,5,6 the GC reaction induced by IAV was characterized by a steady ratio of IgM+ to switched GC B cells (Fig. 3c). Importantly, anti-GITR mAb administration resulted in a higher frequency and total number of splenic GC B cells at several time-points (Fig. 3b), and significantly increased the proportion of switched GC B cells throughout the entire reaction (Fig. 3c). As opposed to GCs induced with SRBC immunization, we observed no significant difference in the distribution of IgG isotypes within the switched GC B-cell pool at any time-points after IAV challenge (data not shown).
Figure 3.
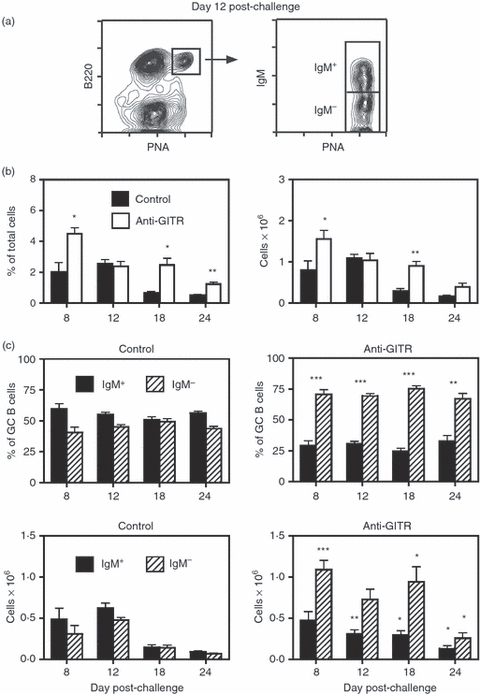
Disruption of regulatory T (Treg) cells leads to enhanced influenza-induced germinal centre (GC) responses in BALB/c mice. Adult BALB/c mice were injected intraperitoneally (i.p.) with 250 μg anti-glucocorticoid-induced tumour necrosis factor receptor-related protein (GITR) monoclonal antibody (mAb) on days −2, +1 and +5. Mice were immunized on day 0 with influenza A virus (IAV; PR8, H1N1), and spleens were harvested on days 8–24. Mice immunized with IAV in the absence of any injections served as controls. (a) The left panel shows the splenic GC response in control-treated mice 12 days post-challenge. The right panel illustrates IgM expression on the B220+ peanut agglutinin (PNA)hi GC population, with the IgM+ and IgM− sub-sets designated. (b) The left panel shows the percentage of B220+ PNAhi GC B cells within the viable lymphocyte gated population, and the right panel represents the number of total recovered splenic GC B cells at each time-point. Closed bars = control mice. Open bars = anti-GITR mAb-treated mice. Statistical analyses were performed between control and anti-GITR groups at each time-point. (c) The two upper panels show the percentages of IgM+ (solid bars) and IgM− (hatched bars) B cells within the GC B-cell population. The two lower panels show the total number of IgM+ and IgM− GC B cells within the spleen. Left panels are from control mice and right panels are from anti-GITR mAb-treated mice. Statistical analyses were performed between IgM+ GC B cells from control and anti-GITR groups and IgM− GC B cells from control and anti-GITR groups at each time point. Each bar represents average ± SD. There were between five and 10 mice per group. *P < 0·04; **P < 0·004; ***P < 0·001.
Disruption of Treg-cell function leads to dysregulated PE-specific GC responses
The results generated above demonstrated the role of Treg cells in controlling both the size of SRBC-induced and IAV-induced GC responses, and the ratio of IgM+ to switched B cells within the GC population. In these experiments, however, total splenic GC B cells were enumerated because the B220+ PNAhi B-cell population induced after SRBC or IAV injection was presumed to be specific for the challenge antigen. (Please note that specific pathogen-free mice do not exhibit splenic GCs in the absence of immunization, Fig. 1.) We therefore sought to confirm the role of Treg cells in governing GC reactions by tracking antigen-binding GC B cells, instead of the entire B220+ PNAhi splenic B-cell pool. To perform these studies, PE was used as the challenge antigen,57–59 and PE-binding GC B cells were analysed in anti-GITR mAb or control rIgG-treated mice. As shown in Fig. 4(a), i.p. immunization with PE precipitated in alum induced splenic B220+ PNAhi GC B cells, a sub-set of which retained the ability to bind native PE. In control animals, the PE-binding GC B-cell response peaked at day 12 (Fig. 4b) and like other normal splenic GC responses, displayed a relatively steady ratio of IgM+ to switched B cells (Fig. 4c). As expected, disruption of Treg cells with anti-GITR mAb administration resulted in an increased total PE-binding GC response, and a progressive increase in the proportion and total number of switched PE-binding GC B cells.
Figure 4.
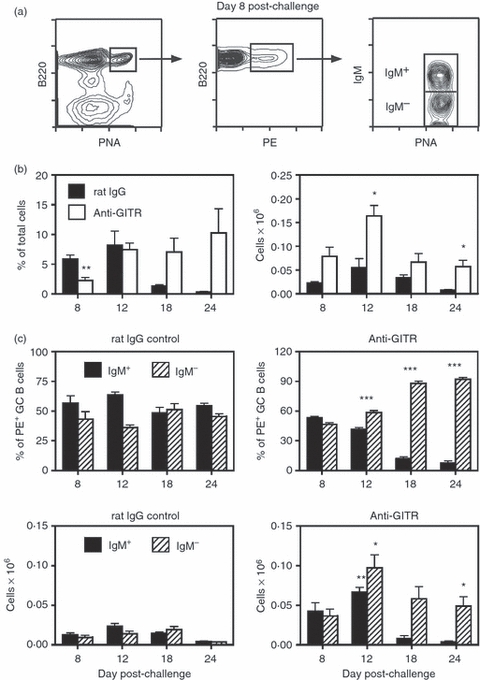
Disruption of regulatory T (Treg) cells leads to enhanced phycoerythrin (PE)-induced germinal centre (GC) responses in BALB/c mice. Adult BALB/c mice were injected intraperitoneally (i.p.) with 250 μg anti-glucocorticoid-induced tumour necrosis factor receptor-related protein (GITR) monoclonal antibody (mAb) or control rat IgG on days −2, +1 and +5. Mice were immunized on day 0 with phycoerythrin (PE) precipitated in alum, and spleens were harvested on days 8–24. Given the relatively low frequency of PE-binding GC B cells, at least 2–3 × 10⁶ events were collected per sample during flow cytometric analysis. (a) The left panel shows the splenic GC response in anti-GITR mAb-treated mice 8 days post-challenge. The middle panel illustrates the PE-binding B cells within the B220+ peanut agglutinin (PNA)hi GC population. The right panel shows the IgM+ and IgM− sub-sets within the PE-binding GC B cells. (b) The left panel shows the percent of PE-binding B220+ PNAhi GC B cells within the viable lymphocyte gated population, and the right panel represents the number of total recovered splenic PE-binding GC B cells at each time point. Closed bars = control rat IgG treated mice. Open bars = anti-GITR mAb treated mice. Statistical analyses were performed between rat IgG and anti-GITR groups at each time point. (c) The two upper panels show the percentages of IgM+ (solid bars) and IgM− (hatched bars) B cells within the PE-binding B220+ PNAhi GC B-cell population. The two lower panels show the total number of IgM+ and IgM− PE-binding GC B cells within the spleen. Left panels are from control rat IgG-treated mice and right panels are from anti-GITR mAb-treated mice. Statistical analyses were performed between IgM+ PE-binding GC B cells from rat IgG and anti-GITR groups and IgM− PE-binding GC B cells from rat IgG and anti-GITR groups at each time-point. Each bar represents average ± SD. There were four to 11 mice per group. *P < 0·02; **P < 0·002; ***P < 0·0001.
Treg cells influence GCs throughout the entire response
In Figs 1–4, splenic GC responses were dysregulated when anti-GITR mAb was given before and soon after immunization. To assess whether already established GCs can be altered by late-stage Treg-cell disruption, mice were challenged with SRBC at day 0 and treated with either anti-GITR mAb or control rIgG on days 8 and 12, or days 12 and 16 post-immunization. Splenic GCs from both groups were examined on days 18 and 24. The results demonstrated that the percentage and total number of GCs were still increased in anti-GITR mAb-treated mice (Fig. 5a). In addition, the percentage and total number of switched GC B cells were also enhanced after late stage Treg-cell disruption. These data indicate that Treg cells participate in the control of GCs throughout the entire response, and not just at the induction phase.
Figure 5.
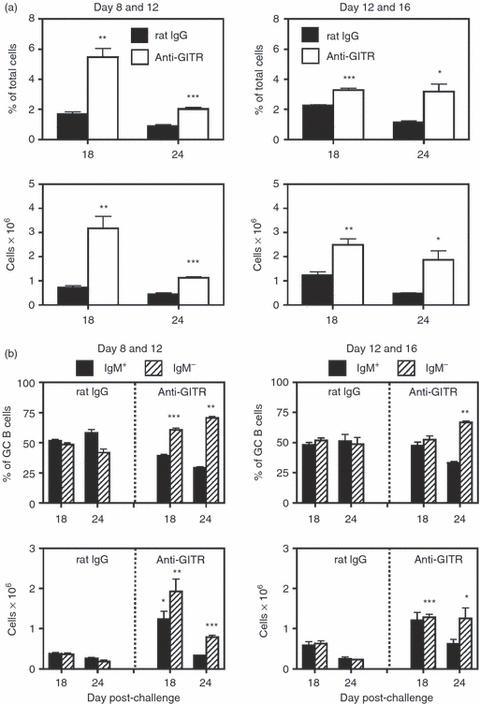
T regulatory (Treg) cells influence the germinal centre (GC) response at late time-points. BALB/c mice were immunized with sheep red blood cells (SRBC) on day 0, and injected intraperitoneally (i.p.) with 250 μg of anti-glucocorticoid-induced tumour necrosis factor receptor-related protein (GITR) monoclonal antibody (mAb) or control rat IgG at either days 8 and 12 or days 12 and 16 post-challenge, and spleens were harvested on days 18 and 24. (a) Left panels are from mice injected on days 8 and 12 with anti-GITR mAb or control rat IgG, and right panels are mice injected on days 12 and 16. Upper panels show the percentage of B220+ peanut agglutinin (PNA)hi GC B cells within the viable lymphocyte gated population, and the lower panels represent the number of total recovered splenic GC B cells at each time-point. Closed bars = control rat IgG-treated mice. Open bars = anti-GITR mAb-treated mice. Statistical analyses were performed between rat IgG and anti-GITR groups at each time point. (b) Left panels are from mice injected on days 8 and 12 with anti-GITR mAb or control rat IgG, and right panels are mice injected on days 12 and 16. The two upper panels show the percentages of IgM+ (solid bars) and IgM− (hatched bars) B cells within the GC B-cell population. The two lower panels show the total number of IgM+ and IgM− GC B cells within the spleen. Statistical analyses were performed between IgM+ GC B cells from rat IgG and anti-GITR groups and IgM− GC B cells from rat IgG and anti-GITR groups at each time point. Each bar represents average ± SD. There were three or four mice per group. *P < 0·04; **P < 0·02; ***P < 0·005.
Population dynamics and phenotype of splenic Treg cells during GC responses
Given the observation that Treg cells participate in the control of GC reactions, it was of interest to explore the frequency and phenotype of the splenic Treg-cell population after immunization with SRBC. To monitor Treg cells, Foxp3-GFP reporter mice were used.47 As shown in Fig. 6(a), CD4+ Foxp3+ T cells are readily detected in the spleens of these mice, allowing for enumeration and phenotypic characterization. Of interest, the proportion of Foxp3+ Treg cells within the splenic CD4+ compartment was unaltered throughout the GC response (Fig. 6b), although total cellularity of the spleen increased modestly at days 8 and 12 (data not shown). As iTreg cells are probably activated to control the humoral response to novel antigens, a range of surface markers were examined in an attempt to identify an activated iTreg-cell sub-set. When comparing naive with SRBC-challenged mice, no differences were found in the proportion of Treg cells expressing CD103, CD45RB, CD62L, CD178, GITR or PD-1 at any time-point (data not shown). Several reports have demonstrated the presence of Treg cells within the GCs of human and mouse secondary lymphoid tissue,44,45,60,61 indicating their ability to migrate into activated follicles.62 Accordingly, CXCR5 and CCR7 expression was examined on CD4+ Foxp3+ T cells from naive and immunized mice. As shown in Fig. 6(a), the splenic Treg-cell population consists of four sub-sets defined as CXCR5− CCR7+, CXCR5lo CCR7lo, CXCR5 CCR7− and CXCR5+ CCR7−. CXCR5− CCR7+ Treg cells would be expected to reside in T-cell zones with CXCR5lo CCR7lo Treg cells positioned at the borders of T-cell : B-cell areas. CXCR5− CCR7− Treg cells would probably be found in red pulp tissue. Importantly, CXCR5+ CCR7− Treg cells should have the ability to migrate into B-cell follicles with the potential to control B-cell activity locally. In naive mice (day 0), the CXCR5− CCR7+, CXCR5lo CCR7lo, CXCR5− CCR7− and CXCR5+ CCR7− sub-sets composed 29%, 14%, 30% and 27% of the Treg-cell compartment, respectively. It is of interest that all four sub-sets exist in unimmunized mice, suggesting that Treg cells patrol all areas of the spleen under steady-state conditions. The four Treg-cell sub-sets were similarly enumerated in SRBC-immunized mice at days 8, 12 and 18 post-challenge. Figure 6(c) shows no change in the frequency of CXCR5− CCR7+ and CXCR5+ CCR7− Treg cells during the course of the response, indicating no major shift of Treg cells from the T-cell zone into activated follicles. Percentages of CXCR5lo CCR7lo and CXCR5− CCR7− Treg cells were also unchanged (data not shown). Hence, although no differences were observed in the proportion of Treg-cell sub-sets defined by CXCR5 and CCR7 after immunization, the spleen clearly contains a population of CXCR5+ CCR7− Treg cells with the potential to migrate into activated follicles and GCs.
Figure 6.
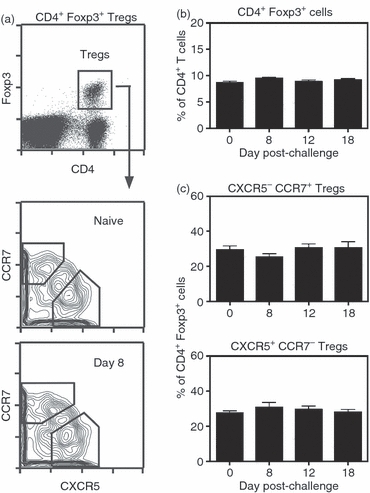
Chemokine receptor expression on splenic CD4+ Foxp3+ T cells. B6.FoxP3-GFP mice were immunized with sheep red blood cells (SRBC) on day 0 and spleens were harvested on days 8, 12 and 18. Cells were stained with anti-CD4, anti-CXCR5 and anti-CCR7 monoclonal antibodies (mAbs). (a) The upper panel shows the gated CD4+ GFP (Foxp3)+ regulatory T (Treg) cell sub-set. The lower panels show Treg-cell sub-sets defined by CXCR5 and CCR7 in naive (day 0) and day 8 challenged mice. The gated CXCR5− CCR7+ and CXCR5+ CCR7− sub-sets are indicated. (b) Percentage of CD4+ Foxp3+ cells within the splenic CD4+ T-cell compartment of either naive or immunized mice. (c) Percentage of CXCR5− CCR7+ and CXCR5+ CCR7− cells within the splenic CD4+ Foxp3+ Treg-cell population of naive and immunized mice. There were three to six mice per group.
Histological evaluation of Treg-cell location during GC responses
With a sub-set of splenic Treg cells displaying a CXCR5+ CCR7− phenotype, the possibility exists that iTreg cells are attracted to splenic GCs in the mouse, as shown by studies examining human and mouse tissue.44,45,60,61 Mice were therefore challenged with SRBC and spleens were harvested at day 8, the height of the response. Snap-frozen tissues were thin sectioned and stained, as shown in Fig. 7. In the upper panel, the section was stained with PNA and anti-CD4 mAb to highlight GCs (green) and T-cell zones (red). Serial sections were stained with anti-IgD mAb and anti-Foxp3 mAb (middle panel) to denote the follicular mantle (green) as well as individual Treg cells (blue), and with anti-IgD mAb and control rat IgG2a (lower panel) to control for background staining. As expected, a population of Foxp3+ staining cells was found to reside within the T-cell zone. Figure 7 further shows the presence of Foxp3+ cells (designated with arrows) within the GC (PNA+ IgD− area outlined in white). These observations are consistent with a sub-set of splenic CD4+ Foxp3+ cells exhibiting a CXCR5 CCR7− phenotype, and suggest the possibility that Treg cells may effect their suppressive activity directly within the GC.
Figure 7.
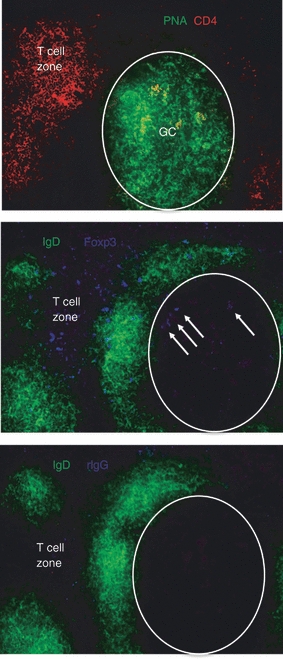
Foxp3+ cells are physically present within splenic germinal centres (GCs). Adult BALB/c mice were injected intraperitoneally (i.p.) with sheep red blood cells (SRBC) on day 0, and spleens were harvested on day 8. Splenic fragments were snap frozen, thin sectioned (8 μm) and serial sections were stained with anti-CD4 monoclonal antibody (mAb) and peanut agglutinin (PNA), or anti-IgD mAb and either anti-Foxp3 mAb or rat IgG2a isotype control. Sections were imaged using a Nikon Eclipse E600 fluorescence microscope equipped with a SPOT digital camera, and images were processed with Adobe Photoshop software. The upper panel shows CD4 (red/Cy3) and PNA (green/FITC) staining. The lower panels show IgD (green/FITC) and Foxp3 or isotype control (blue/Cy5) staining. The areas composing GCs are outlined in the lower panels. Foxp3+ cells within the GC are indicated by arrows in the middle panel. Magnification 100 ×. Images are representative of multiple fields from three mice. Please note that the Foxp3 and isotype control files were imaged identically with the SPOT digital camera, and were similarly colour enhanced identically in Photoshop.
Interfering with induction of iTreg cells leads to abnormal GC responses
The Treg-cell population induced to control responses to novel antigens is thought to arise from naive CD4+ Foxp3− T cells in the periphery. A number of key signals and cytokines have been shown to be essential for the generation of iTreg cells both in vitro and in vivo.14,15 Of the various signals, TGF-β has been repeatedly demonstrated to be critical for the induction and maintenance of Foxp3+ iTreg cells.63–65 In addition, a recent report suggested that IL-10 also has a central role in maintaining Foxp3 and the associated suppressive activity in Treg cells.66 Towards this end, a large number of studies have utilized anti-TGF-β67–72 or anti-IL-10R70–74 blocking mAbs over extended periods to impede the induction and activity of Treg cells in vivo. We therefore took a similar approach and examined the effect of anti-TGF-β mAb or anti-IL-10R mAb on SRBC-induced GC responses. In the first set of experiments, mice were injected i.p. with 100 μg anti-TGF-β (1D11) mAb or control mouse IgG every 2 days starting at day 0 and continued until the mice were killed. The SRBC were given i.p. on day 0. The results are shown in Fig. 8, and illustrate an excess in the percentage and total number of IgM− switched GC B cells (Fig. 8b). This imbalance was evident already at day 8 and became progressive as the response matured. Although control of the switched GC sub-set was impaired in anti-TGF-β-treated mice, the overall size of the B220+ PNAhi population was not significantly different from that in control-treated animals (Fig. 8a). This implies that thymically derived natural Treg cells may also play a role in controlling the overall size of the GC response, or upon systemic TGF-β neutralization, other factors or cytokines may partially compensate leading to nominal induction of iTreg cells.
Figure 8.
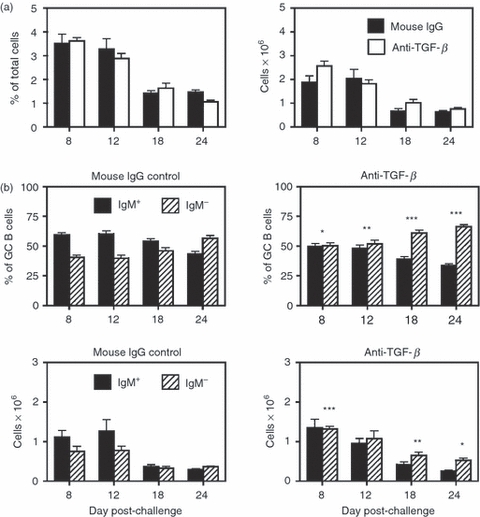
Neutralization of transforming growth factor-β (TGF-β) leads to enhanced sheep red blood cell (SRBC) -induced germinal centre (GC) responses. Adult BALB/c mice were injected intraperitoneally (i.p.) with 100 μg of anti-TGF-β (1D11) monoclonal antibody (mAb) or control mouse IgG every 2 days starting at day 0 and continued until the mice were killed. Mice were immunized on day 0 with SRBC, and spleens were harvested on days 8–24. (a) The left panel shows the percentage of B220+ peanut agglutinin (PNA)hi GC B cells within the viable lymphocyte gated population, and the right panel represents the number of total recovered splenic GC B cells at each time-point. Closed bars = control mouse IgG-treated mice. Open bars = anti-TGF-β mAb treated mice. Statistical analyses were performed between mouse IgG and anti-TGF-β groups at each time-point. (b) The two upper panels show the percentages of IgM+ (solid bars) and IgM− (hatched bars) B cells within the GC B-cell population. The two lower panels show the total number of IgM+ and IgM− GC B cells within the spleen. Left panels are from control mouse IgG-treated mice and right panels are from anti-TGF-β mAb-treated mice. Statistical analyses were performed between IgM+ GC B cells from mouse IgG and anti-TGF-β groups and IgM− GC B cells from mouse IgG and anti-TGF-β groups at each time-point. Each bar represents average ± SD. There were five or six mice per group. *P < 0·03; **P < 0·015; ***P < 0·01.
The potential role of IL-10 was also examined by repeated administration of a blocking anti-IL-10R mAb. Mice were injected i.p. on day 0 with 1 mg of anti-IL-10R (1B1.3a) mAb or control rat IgG. Starting in the second week, 500 μg of anti-IL-10R mAb or rat IgG was injected twice weekly and continued until the mice were killed. The SRBC were given i.p. on day 0. Similar to anti-TGF-β-treated mice, blockade of the IL-10R resulted in an inability to control the balance of IgM+ to switched GC B cells in the spleen. Although not evident at days 8 and 12, this imbalance became marked at days 18 and 24 and reflected a significant increase in both the frequency and total number of IgM− GC B cells (Fig. 9b). Examination of the frequency and number of total B220+ PNAhi B cells showed little difference between anti-IL-10R mAb and control-treated mice, except at day 24 (Fig. 9a). This is again similar to the result observed after TGF-β neutralization, and may likewise reflect the activity of natural Treg cells or the ability of other cytokines to partially compensate. Finally, to ensure that anti-IL-10R mAb treatment did not directly modulate responding B cells, the GC population was tested for expression of IL-10R. As shown in the Supplementary material, Fig. S3, no expression above background was detected.
Figure 9.
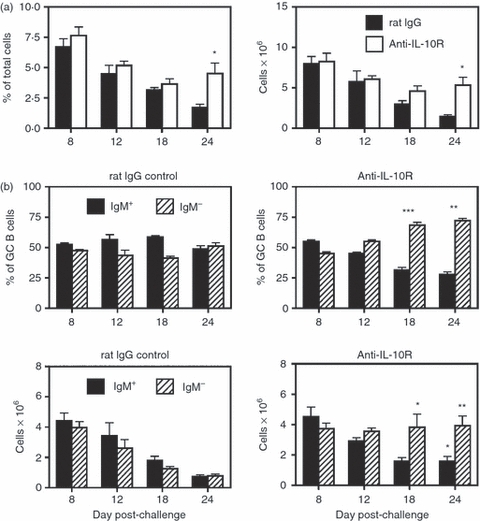
Blockade of interleukin-10 receptor (IL-10R) leads to enhanced sheep red blood cell (SRBC)-induced germinal centre (GC) responses. Adult BALB/c mice were injected intraperitoneally (i.p.) with 1 mg of anti-IL-10R (1B1.3a) mAb and control rat IgG on day 0, and twice weekly with 500 μg until the mice were killed, starting in the second week. Mice were immunized on day 0 with SRBC, and spleens were harvested on days 8–24. (a) The left panel shows the percentage of B220+ peanut agglutinin (PNA)hi GC B cells within the viable lymphocyte-gated population, and the right panel represents the number of total recovered splenic GC B cells at each time-point. Closed bars = control rat IgG-treated mice. Open bars = anti-IL-10R mAb-treated mice. Statistical analyses were performed between rat IgG and anti-IL-10R groups at each time-point. (b) The two upper panels show the percentages of IgM+ (solid bars) and IgM− (hatched bars) B cells within the GC B-cell population. The two lower panels show the total number of IgM+ and IgM− GC B cells within the spleen. Left panels are from control rat IgG-treated mice and right panels are from anti-IL-10R mAb-treated mice. Statistical analyses were performed between IgM+ GC B cells from rat IgG and anti-IL-10R groups and IgM− GC B cells from rat IgG and anti-IL-10R groups at each time-point. Each bar represents average ± SD. There were thre to six mice per group. *P < 0·05; **P < 0·03; ***P < 0·005.
Discussion
A large number of studies have documented the role of Treg cells in controlling antibody responses.16–46 Using either in vivo disruption (anti-GITR mAb) or depletion (anti-CD25 mAb) protocols, investigators have shown that loss of Treg-cell activity results in enhanced humoral responses to experimental antigens,16–22 pathogens23,24 and auto-antigens.17,25–29 In all of these reports, antibody levels directed against the specific antigen or infectious agent were significantly elevated, including IgG,16–27,29 IgA18,25 and even IgE.19,26 Additional studies examined whether adoptive transfer of polyclonal21,30–32,35,37–40 or TCR transgenic33,34,36,41 Treg cells could dampen antibody responses to defined allo-antigens or auto-antigens. In all cases, the transfer of Treg cells significantly lowered or even eliminated serum antibodies directed against these antigens. As GCs serve as the basis for T-cell-driven humoral responses, the current study examined the behaviour of primary splenic GC reactions induced to a number of antigens in mice treated with an anti-GITR mAb (Figs 1–4). After disruption of Treg-cell activity, total SRBC-induced GC B-cell numbers were increased at all time-points examined (days 8–24). A higher proportion of IgM− switched B cells within the GC compartment largely accounted for this increase. Whereas splenic GC responses normally displayed a steady ratio of IgM+ to switched B cells throughout the response,1,5,6 this balance was lost when Treg-cell control was compromised. These patterns were observed regardless of treatment protocol (anti-GITR mAb and anti-CD25 mAb), strain (BALB/c and C57BL/6) and antigen (SRBC, IAV and PE). Importantly, these findings provide a basis to explain the marked increase in serum antibodies, especially switched isotypes, upon in vivo Treg-cell disruption or depletion. These data are also consistent with reports showing the ability of adoptively transferred Treg cells to suppress in vivo B-cell responses,21,30–42 including GC reactions32,41 and the generation of antibody-forming cells.33,34,36
Although it is clear that Treg cells participate in the control of GC reactions, the target and site of Treg-cell action are currently unknown. Two likely targets are Tfh cells and GC B cells. The Tfh cells are critical in the induction and maintenance of GCs because they provide key co-stimulatory signals through inducible T-cell costimulator (ICOS) and CD154, as well as key cytokines, especially IL-21.75 In addition, it has been shown that the magnitude of the GC response is directly linked to the size of the induced Tfh-cell pool.76 While Treg-cell suppression of CD4+ T-cell activity is well established,11–13 few investigators have focused on whether Treg cells can specifically alter Tfh function. In a recent study by Erikson and co-workers, however, adoptive transfer of antigen-specific Treg cells was found to down-modulate the expression of ICOS on Tfh cells.41 In addition, Weiner and colleagues reported that induction of Treg cells in vivo compromised the ability of Tfh cells to produce optimal levels of IL-21.39 As ICOS expression77 and IL-21 production78–80 by Tfh cells are crucial for optimal B-cell differentiation and switching, influencing these molecules would serve as an effective means by which Treg cells could control the GC response. In preliminary experiments, we tested whether total numbers of splenic Tfh cells were altered by anti-GITR treatment in SRBC-immunized mice. However, when examining days 8 and 12 (the peak of splenic Tfh-cell induction after antigen challenge), no differences were observed (see Supplementary material, Fig. S4).
Germinal centre B cells are also a potential target because a number of studies have demonstrated that Treg cells directly suppress activated B cells in vitro.32,40,42–46 In these experiments, Treg–B-cell contact was required and in several reports, Treg cells effected suppression by killing B cells in either a Fas-dependent43 or granzyme B-dependent40,46 manner. Although Treg cells may indeed directly suppress GC B cells, it is uncertain whether they use a cytotoxic mechanism in vivo. Studies in our laboratory found that both Fas-mutated lpr mice and granzyme B-deficient mice generated normal GC responses after SRBC challenge (data not shown). When testing the capacity of Treg cells to suppress immunoglobulin production by activated B cells in vitro, Kim and co-workers demonstrated significant reduction of IgG and IgA secretion upon co-culture with increasing numbers of Treg cells.45 In examining the mechanism of suppression, these investigators found Treg cells to inhibit the expression of activation-induced cytidine deaminase in B cells, and as a consequence, class switch recombination. This finding suggests that Treg cells may have the ability to moderate class switch recombination in activated B cells, thereby controlling the proportion of switched B cells within GCs.
A second key question is the site where Treg-cell control is occurring. Early after challenge with T-cell-dependent antigens, T-cell activation takes place in the T-cell zone and T-cell–B-cell interactions occur at the borders of the B-cell and T-cell zones.1–4 These early events lead to activated Tfh cells and GC founder B cells, and to the initiation of GCs within days after immunization. As such, Treg cells could influence GC reactions during early activation events before GC formation, or within the GC itself. Using a Treg adaptive transfer protocol, Fields et al.34 demonstrated that suppression of antibody-forming cells required the presence of Treg cells early rather than later in the response, suggesting regulation during early activation events. Although in the current study, anti-GITR mAb administration was proximal to immunization in most experiments, delayed injection regimens (starting on day 8 or 12 post-challenge) were also tested (Fig. 5). Regardless of when anti-GITR mAb was given, disruption of GC responses was observed several days later, indicating that Treg cells were capable of controlling GC reactions long after early activation events had occurred. Given this result, and the demonstrated ability of Treg cells to suppress Tfh39,41 and activated B cells,32,40,42–46 it stands to reason that Treg cells may exert control directly within the GC. Towards this end, it was shown that a proportion of splenic Treg cells are CXCR5+ CCR7− (Fig. 6), thereby indicating their ability to migrate into B-cell follicles. This finding is consistent with previous reports in the mouse and human demonstrating CXCR5+ Treg cells.34,44 More important, immunohistological analysis of spleen sections showed Foxp3+ cells physically present within GCs induced by SRBC immunization (Fig. 7), consistent with previous reports.44,45,60,61 This observation strongly suggests that Treg cells may indeed exercise control within GCs, and may constitute a proportion of CD4+ T cells known to reside within the light zone.62
Inducible Treg cells are believed to be primarily responsible for controlling responses to novel antigens.14,15 This Treg-cell sub-set is derived from naive CD4+ T cells in the periphery, and has been shown to require TGF-β63–65 and IL-1066 for its induction and/or maintenance. In an attempt to determine whether iTreg cells were operative in controlling GC responses after SRBC challenge, mice were treated with either anti-TGF-β or anti-IL-10R blocking mAbs from time of immunization until death. The results demonstrated that treatment with either mAb resulted in dysregulation, with GCs exhibiting abnormally elevated numbers of switched GC B cells (Figs 8 and 9). These findings would appear to confirm iTreg cells as the effector sub-set governing GC reactions to exogenous antigens. It should be noted, however, that both TGF-β81 and IL-1082 have been implicated as Treg-derived effector molecules mediating suppression, in addition to their role in iTreg-cell induction and maintenance. As such, the possibility exists that these molecules are directly regulating cellular events within the GC as opposed to sustaining antigen-specific iTreg cells.
In summary, the current study extends our understanding of how Treg cells govern humoral immunity. Whereas previous work clearly showed that the Treg cells control levels of secreted antibodies16–29 and numbers of antibody-forming cells33,34,36 the findings herein are the first to detail the extent to which Treg cells can influence GCs over the course of the entire reaction. In addition to containing the overall size of the GC response, Treg cells appear to limit the pool of switched GC B cells and thereby maintain a steady ratio of IgM+ to IgM− GC cells. Although it is presently unclear as to why there is pressure to carefully regulate numbers of switched GC B cells, this process may be necessary to enforce selection away from self-reactivity and towards high-affinity antigen-specific clones within the GC.
Acknowledgments
This work is supported by grant NIH R01AA019438 to T.W.
Glossary
Abbreviations
- GC
germinal centre
- GITR
glucocorticoid-induced tumour necrosis factor receptor-related protein
- IAV
influenza A virus
- IL-10R
interleukin-10 receptor
- i.p.
intraperitoneal
- iTreg
inducible Treg
- mAb
monoclonal antibody
- PNA
peanut agglutinin
- rIgG
rat IgG
- R-PE
R-phycoerythrin
- SRBC
sheep red blood cell
- T1
transitional 1
- T2
transitional 2
- Tfh
T follicular helper
- TGF
transforming growth factor
- Th1
T helper type 1
- Treg
T regulatory cell
Disclosures
The authors declare having no financial or commercial conflicts of interest.
Supporting Information
Additional Supporting Information may be found in the online version of this article:
Figure S1. Effect of regulatory T (Treg) cell disruption on splenic non-germinal centre (GC) B cells.
Figure S2. Depletion of regulatory T (Treg) cells leads to abnormal sheep red blood cell (SRBC) -induced germinal centre responses in BALB/c mice.
Figure S3. Germinal centre (GC) B cells do not express glucocorticoid-induced tumour necrosis factor receptor-related protein (GITR), CD25 or interleukin-10 receptor (IL-10R).
Figure S4. Disruption of regulatory T (Treg) cells does not alter numbers of T follicular helper (Tfh) cells in the spleen at the peak of the response.
Please note: Wiley-Blackwell are not responsible for the content or functionality of any supporting materials supplied by the authors. Any queries (other than missing material) should be directed to the corresponding author for the article.
References
- 1.Wolniak KL, Shinall SM, Waldschmidt TJ. The germinal center response. Crit Rev Immunol. 2004;24:39–65. doi: 10.1615/critrevimmunol.v24.i1.20. [DOI] [PubMed] [Google Scholar]
- 2.Allen CD, Okada T, Cyster JG. Germinal-center organization and cellular dynamics. Immunity. 2007;27:190–202. doi: 10.1016/j.immuni.2007.07.009. [DOI] [PMC free article] [PubMed] [Google Scholar]
- 3.Klein U, Dalla-Favera R. Germinal centres: role in B-cell physiology and malignancy. Nat Rev Immunol. 2008;8:22–33. doi: 10.1038/nri2217. [DOI] [PubMed] [Google Scholar]
- 4.Goodnow CC, Vinuesa CG, Randall KL, Mackay F, Brink R. Control systems and decision making for antibody production. Nat Immunol. 2010;11:681–8. doi: 10.1038/ni.1900. [DOI] [PubMed] [Google Scholar]
- 5.Shinall SM, Gonzalez-Fernandez M, Noelle RJ, Waldschmidt TJ. Identification of murine germinal center B cell subsets defined by the expression of surface isotypes and differentiation antigens. J Immunol. 2000;164:5729–38. doi: 10.4049/jimmunol.164.11.5729. [DOI] [PubMed] [Google Scholar]
- 6.Wolniak KL, Noelle RJ, Waldschmidt TJ. Characterization of (4-hydroxy-3-nitrophenyl)acetyl (NP)-specific germinal center B cells and antigen-binding B220– cells after primary NP challenge in mice. J Immunol. 2006;177:2072–9. doi: 10.4049/jimmunol.177.4.2072. [DOI] [PubMed] [Google Scholar]
- 7.Kelsoe G. In situ studies of the germinal center reaction. Adv Immunol. 1995;60:267–88. doi: 10.1016/s0065-2776(08)60587-8. [DOI] [PubMed] [Google Scholar]
- 8.Kosco-Vilbois MH, Bonnefoy JY, Chvatchko Y. The physiology of murine germinal center reactions. Immunol Rev. 1997;156:127–36. doi: 10.1111/j.1600-065x.1997.tb00964.x. [DOI] [PubMed] [Google Scholar]
- 9.Crouch EE, Li Z, Takizawa M, et al. Regulation of AID expression in the immune response. J Exp Med. 2007;204:1145–56. doi: 10.1084/jem.20061952. [DOI] [PMC free article] [PubMed] [Google Scholar]
- 10.Shevach EM. From vanilla to 28 flavors: multiple varieties of T regulatory cells. Immunity. 2006;25:195–201. doi: 10.1016/j.immuni.2006.08.003. [DOI] [PubMed] [Google Scholar]
- 11.Tang Q, Bluestone JA. The Foxp3+ regulatory T cell: a jack of all trades, master of regulation. Nat Immunol. 2008;9:239–44. doi: 10.1038/ni1572. [DOI] [PMC free article] [PubMed] [Google Scholar]
- 12.Sakaguchi S, Yamaguchi T, Nomura T, Ono M. Regulatory T cells and immune tolerance. Cell. 2008;133:775–87. doi: 10.1016/j.cell.2008.05.009. [DOI] [PubMed] [Google Scholar]
- 13.Sojka DK, Huang YH, Fowell DJ. Mechanisms of regulatory T-cell suppression – a diverse arsenal for a moving target. Immunology. 2008;124:13–22. doi: 10.1111/j.1365-2567.2008.02813.x. [DOI] [PMC free article] [PubMed] [Google Scholar]
- 14.Horwitz DA, Zheng SG, Gray JD. Natural and TGF-beta-induced Foxp3+ CD4+ CD25+ regulatory T cells are not mirror images of each other. Trends Immunol. 2008;29:429–35. doi: 10.1016/j.it.2008.06.005. [DOI] [PubMed] [Google Scholar]
- 15.Curotto de Lafaille MA, Lafaille JJ. Natural and adaptive foxp3+ regulatory T cells: more of the same or a division of labor? Immunity. 2009;30:626–35. doi: 10.1016/j.immuni.2009.05.002. [DOI] [PubMed] [Google Scholar]
- 16.Mqadmi A, Zheng X, Yazdanbakhsh K. CD4+ CD25+ regulatory T cells control induction of autoimmune hemolytic anemia. Blood. 2005;105:3746–8. doi: 10.1182/blood-2004-12-4692. [DOI] [PMC free article] [PubMed] [Google Scholar]
- 17.Frey O, Petrow PK, Gajda M, et al. The role of regulatory T cells in antigen-induced arthritis: aggravation of arthritis after depletion and amelioration after transfer of CD4+ CD25+ T cells. Arthritis Res Ther. 2005;7:R291–301. doi: 10.1186/ar1484. [DOI] [PMC free article] [PubMed] [Google Scholar]
- 18.Kim WJ, Bae EM, Kang YJ, et al. Glucocorticoid-induced tumour necrosis factor receptor family related protein (GITR) mediates inflammatory activation of macrophages that can destabilize atherosclerotic plaques. Immunology. 2006;119:421–9. doi: 10.1111/j.1365-2567.2006.02453.x. [DOI] [PMC free article] [PubMed] [Google Scholar]
- 19.Eddahri F, Oldenhove G, Denanglaire S, Urbain J, Leo O, Andris F. CD4+ CD25+ regulatory T cells control the magnitude of T-dependent humoral immune responses to exogenous antigens. Eur J Immunol. 2006;36:855–63. doi: 10.1002/eji.200535500. [DOI] [PubMed] [Google Scholar]
- 20.Scumpia PO, Delano MJ, Kelly-Scumpia KM, et al. Treatment with GITR agonistic antibody corrects adaptive immune dysfunction in sepsis. Blood. 2007;110:3673–81. doi: 10.1182/blood-2007-04-087171. [DOI] [PMC free article] [PubMed] [Google Scholar]
- 21.Yu J, Heck S, Yazdanbakhsh K. Prevention of red cell alloimmunization by CD25 regulatory T cells in mouse models. Am J Hematol. 2007;82:691–6. doi: 10.1002/ajh.20959. [DOI] [PMC free article] [PubMed] [Google Scholar]
- 22.Ponte JF, Ponath P, Gulati R, et al. Enhancement of humoral and cellular immunity with an anti-glucocorticoid-induced tumour necrosis factor receptor monoclonal antibody. Immunology. 2010;130:231–42. doi: 10.1111/j.1365-2567.2009.03228.x. [DOI] [PMC free article] [PubMed] [Google Scholar]
- 23.Furze RC, Culley FJ, Selkirk ME. Differential roles of the co-stimulatory molecules GITR and CTLA-4 in the immune response to Trichinella spiralis. Microbes Infect. 2006;8:2803–10. doi: 10.1016/j.micinf.2006.08.013. [DOI] [PubMed] [Google Scholar]
- 24.Kaparakis M, Laurie KL, Wijburg O, Pedersen J, Pearse M, van Driel IR, Gleeson PA, Strugnell RA. CD4+ CD25+ regulatory T cells modulate the T-cell and antibody responses in helicobacter-infected BALB/c mice. Infect Immun. 2006;74:3519–29. doi: 10.1128/IAI.01314-05. [DOI] [PMC free article] [PubMed] [Google Scholar]
- 25.Morgan ME, Sutmuller RP, Witteveen HJ, et al. CD25+ cell depletion hastens the onset of severe disease in collagen-induced arthritis. Arthritis Rheum. 2003;48:1452–60. doi: 10.1002/art.11063. [DOI] [PubMed] [Google Scholar]
- 26.Patel M, Xu D, Kewin P, Choo-Kang B, McSharry C, Thomson NC, Liew FY. Glucocorticoid-induced TNFR family-related protein (GITR) activation exacerbates murine asthma and collagen-induced arthritis. Eur J Immunol. 2005;35:3581–90. doi: 10.1002/eji.200535421. [DOI] [PubMed] [Google Scholar]
- 27.Scabeni S, Lapilla M, Musio S, Gallo B, Ciusani E, Steinman L, Mantegazza R, Pedotti R. CD4+ CD25+ regulatory T cells specific for a thymus-expressed antigen prevent the development of anaphylaxis to self. J Immunol. 2008;180:4433–40. doi: 10.4049/jimmunol.180.7.4433. [DOI] [PubMed] [Google Scholar]
- 28.Ludwig-Portugall I, Hamilton-Williams EE, Gottschalk C, Kurts C. Cutting edge: CD25+ regulatory T cells prevent expansion and induce apoptosis of B cells specific for tissue autoantigens. J Immunol. 2008;181:4447–51. doi: 10.4049/jimmunol.181.7.4447. [DOI] [PubMed] [Google Scholar]
- 29.Ludwig-Portugall I, Hamilton-Williams EE, Gotot J, Kurts C. CD25+ T(reg) specifically suppress auto-Ab generation against pancreatic tissue autoantigens. Eur J Immunol. 2009;39:225–33. doi: 10.1002/eji.200838699. [DOI] [PubMed] [Google Scholar]
- 30.Callaghan CJ, Rouhani FJ, Negus MC, Curry AJ, Bolton EM, Bradley JA, Pettigrew GJ. Abrogation of antibody-mediated allograft rejection by regulatory CD4 T cells with indirect allospecificity. J Immunol. 2007;178:2221–8. doi: 10.4049/jimmunol.178.4.2221. [DOI] [PubMed] [Google Scholar]
- 31.Sakaguchi S, Sakaguchi N, Asano M, Itoh M, Toda M. Immunologic self-tolerance maintained by activated T cells expressing IL-2 receptor alpha-chains (CD25). Breakdown of a single mechanism of self-tolerance causes various autoimmune diseases. J Immunol. 1995;155:1151–64. [PubMed] [Google Scholar]
- 32.Bystry RS, Aluvihare V, Welch KA, Kallikourdis M, Betz AG. B cells and professional APCs recruit regulatory T cells via CCL4. Nat Immunol. 2001;2:1126–32. doi: 10.1038/ni735. [DOI] [PubMed] [Google Scholar]
- 33.Seo SJ, Fields ML, Buckler JL, et al. The impact of T helper and T regulatory cells on the regulation of anti-double-stranded DNA B cells. Immunity. 2002;16:535–46. doi: 10.1016/s1074-7613(02)00298-4. [DOI] [PubMed] [Google Scholar]
- 34.Fields ML, Hondowicz BD, Metzgar MH, Nish SA, Wharton GN, Picca CC, Caton AJ, Erikson J. CD4+ CD25+ regulatory T cells inhibit the maturation but not the initiation of an autoantibody response. J Immunol. 2005;175:4255–64. doi: 10.4049/jimmunol.175.7.4255. [DOI] [PubMed] [Google Scholar]
- 35.Ohata J, Miura T, Johnson TA, Hori S, Ziegler SF, Kohsaka H. Enhanced efficacy of regulatory T cell transfer against increasing resistance, by elevated Foxp3 expression induced in arthritic murine hosts. Arthritis Rheum. 2007;56:2947–56. doi: 10.1002/art.22846. [DOI] [PubMed] [Google Scholar]
- 36.Guay HM, Larkin J, III, Picca CC, Panarey L, Caton AJ. Spontaneous autoreactive memory B cell formation driven by a high frequency of autoreactive CD4+ T cells. J Immunol. 2007;178:4793–802. doi: 10.4049/jimmunol.178.8.4793. [DOI] [PubMed] [Google Scholar]
- 37.Aricha R, Feferman T, Fuchs S, Souroujon MC. Ex vivo generated regulatory T cells modulate experimental autoimmune myasthenia gravis. J Immunol. 2008;180:2132–9. doi: 10.4049/jimmunol.180.4.2132. [DOI] [PubMed] [Google Scholar]
- 38.Peng B, Ye P, Blazar BR, Freeman GJ, Rawlings DJ, Ochs HD, Miao CH. Transient blockade of the inducible costimulator pathway generates long-term tolerance to factor VIII after nonviral gene transfer into hemophilia A mice. Blood. 2008;112:1662–72. doi: 10.1182/blood-2008-01-128413. [DOI] [PMC free article] [PubMed] [Google Scholar]
- 39.Wu HY, Quintana FJ, Weiner HL. Nasal anti-CD3 antibody ameliorates lupus by inducing an IL-10-secreting CD4+ CD25– LAP+ regulatory T cell and is associated with down-regulation of IL-17+ CD4+ ICOS+ CXCR5+ follicular helper T cells. J Immunol. 2008;181:6038–50. doi: 10.4049/jimmunol.181.9.6038. [DOI] [PMC free article] [PubMed] [Google Scholar]
- 40.Iikuni N, Lourenco EV, Hahn BH, La Cava A. Cutting edge: regulatory T cells directly suppress B cells in systemic lupus erythematosus. J Immunol. 2009;183:1518–22. doi: 10.4049/jimmunol.0901163. [DOI] [PMC free article] [PubMed] [Google Scholar]
- 41.Hondowicz BD, Batheja AO, Metzgar MH, Caton AJ, Erikson J. ICOS expression by effector T cells influences the ability of regulatory T cells to inhibit anti-chromatin B cell responses in recipient mice. J Autoimmun. 2009;34:460–8. doi: 10.1016/j.jaut.2009.11.016. [DOI] [PMC free article] [PubMed] [Google Scholar]
- 42.Nakamura K, Kitani A, Strober W. Cell contact-dependent immunosuppression by CD4+ CD25+ regulatory T cells is mediated by cell surface-bound transforming growth factor beta. J Exp Med. 2001;194:629–44. doi: 10.1084/jem.194.5.629. [DOI] [PMC free article] [PubMed] [Google Scholar]
- 43.Janssens W, Carlier V, Wu B, VanderElst L, Jacquemin MG, Saint-Remy JM. CD4+ CD25+ T cells lyse antigen-presenting B cells by Fas–Fas ligand interaction in an epitope-specific manner. J Immunol. 2003;171:4604–12. doi: 10.4049/jimmunol.171.9.4604. [DOI] [PubMed] [Google Scholar]
- 44.Lim HW, Hillsamer P, Kim CH. Regulatory T cells can migrate to follicles upon T cell activation and suppress GC-Th cells and GC-Th cell-driven B cell responses. J Clin Invest. 2004;114:1640–9. doi: 10.1172/JCI22325. [DOI] [PMC free article] [PubMed] [Google Scholar]
- 45.Lim HW, Hillsamer P, Banham AH, Kim CH. Cutting edge: direct suppression of B cells by CD4+ CD25+ regulatory T cells. J Immunol. 2005;175:4180–3. doi: 10.4049/jimmunol.175.7.4180. [DOI] [PubMed] [Google Scholar]
- 46.Zhao DM, Thornton AM, DiPaolo RJ, Shevach EM. Activated CD4+ CD25+ T cells selectively kill B lymphocytes. Blood. 2006;107:3925–32. doi: 10.1182/blood-2005-11-4502. [DOI] [PMC free article] [PubMed] [Google Scholar]
- 47.Fontenot JD, Rasmussen JP, Williams LM, Dooley JL, Farr AG, Rudensky AY. Regulatory T cell lineage specification by the forkhead transcription factor foxp3. Immunity. 2005;22:329–41. doi: 10.1016/j.immuni.2005.01.016. [DOI] [PubMed] [Google Scholar]
- 48.Shimizu J, Yamazaki S, Takahashi T, Ishida Y, Sakaguchi S. Stimulation of CD25+ CD4+ regulatory T cells through GITR breaks immunological self-tolerance. Nat Immunol. 2002;3:135–42. doi: 10.1038/ni759. [DOI] [PubMed] [Google Scholar]
- 49.Stephens GL, McHugh RS, Whitters MJ, Young DA, Luxenberg D, Carreno BM, Collins M, Shevach EM. Engagement of glucocorticoid-induced TNFR family-related receptor on effector T cells by its ligand mediates resistance to suppression by CD4+ CD25+ T cells. J Immunol. 2004;173:5008–20. doi: 10.4049/jimmunol.173.8.5008. [DOI] [PubMed] [Google Scholar]
- 50.Shevach EM, Stephens GL. The GITR–GITRL interaction: co-stimulation or contrasuppression of regulatory activity? Nat Rev Immunol. 2006;6:613–8. doi: 10.1038/nri1867. [DOI] [PubMed] [Google Scholar]
- 51.Stephens LA, Gray D, Anderton SM. CD4+ CD25+ regulatory T cells limit the risk of autoimmune disease arising from T cell receptor crossreactivity. Proc Natl Acad Sci U S A. 2005;102:17418–23. doi: 10.1073/pnas.0507454102. [DOI] [PMC free article] [PubMed] [Google Scholar]
- 52.Sakaguchi S, Ono M, Setoguchi R, et al. Foxp3+ CD25+ CD4+ natural regulatory T cells in dominant self-tolerance and autoimmune disease. Immunol Rev. 2006;212:8–27. doi: 10.1111/j.0105-2896.2006.00427.x. [DOI] [PubMed] [Google Scholar]
- 53.Zou W. Regulatory T cells, tumour immunity and immunotherapy. Nat Rev Immunol. 2006;6:295–307. doi: 10.1038/nri1806. [DOI] [PubMed] [Google Scholar]
- 54.Zelenay S, Demengeot J. Comment on “Cutting edge: anti-CD25 monoclonal antibody injection results in the functional inactivation, not depletion, of CD4+ CD25+ T regulatory cells”. J Immunol. 2006;177:2036–7. doi: 10.4049/jimmunol.177.4.2036-a. author reply 2037–2038. [DOI] [PubMed] [Google Scholar]
- 55.Setiady YY, Coccia JA, Park PU. In vivo depletion of CD4+ FOXP3+ Treg cells by the PC61 anti-CD25 monoclonal antibody is mediated by FcgammaRIII+ phagocytes. Eur J Immunol. 2010;40:780–6. doi: 10.1002/eji.200939613. [DOI] [PubMed] [Google Scholar]
- 56.Swain SL, Agrewala JN, Brown DM, et al. CD4+ T-cell memory: generation and multi-faceted roles for CD4+ T cells in protective immunity to influenza. Immunol Rev. 2006;211:8–22. doi: 10.1111/j.0105-2896.2006.00388.x. [DOI] [PMC free article] [PubMed] [Google Scholar]
- 57.Hayakawa K, Ishii R, Yamasaki K, Kishimoto T, Hardy RR. Isolation of high-affinity memory B cells: phycoerythrin as a probe for antigen-binding cells. Proc Natl Acad Sci U S A. 1987;84:1379–83. doi: 10.1073/pnas.84.5.1379. [DOI] [PMC free article] [PubMed] [Google Scholar]
- 58.Verma S, Waldschmidt TJ. Characterization of splenic CD21hi T2 B cells. Immunol Res. 2007;39:240–8. doi: 10.1007/s12026-007-0072-5. [DOI] [PubMed] [Google Scholar]
- 59.Benson MJ, Elgueta R, Schpero W, Molloy M, Zhang W, Usherwood E, Noelle RJ. Distinction of the memory B cell response to cognate antigen versus bystander inflammatory signals. J Exp Med. 2009;206:2013–25. doi: 10.1084/jem.20090667. [DOI] [PMC free article] [PubMed] [Google Scholar]
- 60.Ito T, Hanabuchi S, Wang YH, et al. Two functional subsets of FOXP3+ regulatory T cells in human thymus and periphery. Immunity. 2008;28:870–80. doi: 10.1016/j.immuni.2008.03.018. [DOI] [PMC free article] [PubMed] [Google Scholar]
- 61.Jang E, Cho WS, Cho ML, Park HJ, Oh HJ, Kang SM, Paik DJ, Youn J. Foxp3+ regulatory T cells control humoral autoimmunity by suppressing the development of long-lived plasma cells. J Immunol. 2011;186:1546–53. doi: 10.4049/jimmunol.1002942. [DOI] [PubMed] [Google Scholar]
- 62.Fazilleau N, Mark L, McHeyzer-Williams LJ, McHeyzer-Williams MG. Follicular helper T cells: lineage and location. Immunity. 2009;30:324–35. doi: 10.1016/j.immuni.2009.03.003. [DOI] [PMC free article] [PubMed] [Google Scholar]
- 63.Shevach EM, Tran DQ, Davidson TS, Andersson J. The critical contribution of TGF-beta to the induction of Foxp3 expression and regulatory T cell function. Eur J Immunol. 2008;38:915–7. doi: 10.1002/eji.200738111. [DOI] [PMC free article] [PubMed] [Google Scholar]
- 64.Horwitz DA, Zheng SG, Wang J, Gray JD. Critical role of IL-2 and TGF-beta in generation, function and stabilization of Foxp3+ CD4+ Treg. Eur J Immunol. 2008;38:912–5. doi: 10.1002/eji.200738109. [DOI] [PubMed] [Google Scholar]
- 65.Chen W, Konkel JE. TGF-beta and ‘adaptive’ Foxp3+ regulatory T cells. J Mol Cell Biol. 2010;2:30–6. doi: 10.1093/jmcb/mjp004. [DOI] [PMC free article] [PubMed] [Google Scholar]
- 66.Murai M, Turovskaya O, Kim G, Madan R, Karp CL, Cheroutre H, Kronenberg M. Interleukin 10 acts on regulatory T cells to maintain expression of the transcription factor Foxp3 and suppressive function in mice with colitis. Nat Immunol. 2009;10:1178–84. doi: 10.1038/ni.1791. [DOI] [PMC free article] [PubMed] [Google Scholar]
- 67.Fahlen L, Read S, Gorelik L, Hurst SD, Coffman RL, Flavell RA, Powrie F. T cells that cannot respond to TGF-beta escape control by CD4+ CD25+ regulatory T cells. J Exp Med. 2005;201:737–46. doi: 10.1084/jem.20040685. [DOI] [PMC free article] [PubMed] [Google Scholar]
- 68.Liu VC, Wong LY, Jang T, et al. Tumor evasion of the immune system by converting CD4+ CD25– T cells into CD4+ CD25+ T regulatory cells: role of tumor-derived TGF-beta. J Immunol. 2007;178:2883–92. doi: 10.4049/jimmunol.178.5.2883. [DOI] [PubMed] [Google Scholar]
- 69.Takaku S, Terabe M, Ambrosino E, Peng J, Lonning S, McPherson JM, Berzofsky JA. Blockade of TGF-beta enhances tumor vaccine efficacy mediated by CD8+ T cells. Int J Cancer. 2010;126:1666–74. doi: 10.1002/ijc.24961. [DOI] [PMC free article] [PubMed] [Google Scholar]
- 70.Liu H, Hu B, Xu D, Liew FY. CD4 CD25+ regulatory T cells cure murine colitis: the role of IL-10, TGF-beta, and CTLA4. J Immunol. 2003;171:5012–7. doi: 10.4049/jimmunol.171.10.5012. [DOI] [PubMed] [Google Scholar]
- 71.Daley SR, Ma J, Adams E, Cobbold SP, Waldmann H. A key role for TGF-beta signaling to T cells in the long-term acceptance of allografts. J Immunol. 2007;179:3648–54. doi: 10.4049/jimmunol.179.6.3648. [DOI] [PubMed] [Google Scholar]
- 72.Herbert DR, Orekov T, Perkins C, Finkelman FD. IL-10 and TGF-beta redundantly protect against severe liver injury and mortality during acute schistosomiasis. J Immunol. 2008;181:7214–20. doi: 10.4049/jimmunol.181.10.7214. [DOI] [PMC free article] [PubMed] [Google Scholar]
- 73.Asseman C, Read S, Powrie F. Colitogenic Th1 cells are present in the antigen-experienced T cell pool in normal mice: control by CD4+ regulatory T cells and IL-10. J Immunol. 2003;171:971–8. doi: 10.4049/jimmunol.171.2.971. [DOI] [PubMed] [Google Scholar]
- 74.Uhlig HH, Coombes J, Mottet C, et al. Characterization of Foxp3+ CD4+ CD25+ and IL-10-secreting CD4+ CD25+ T cells during cure of colitis. J Immunol. 2006;177:5852–60. doi: 10.4049/jimmunol.177.9.5852. [DOI] [PMC free article] [PubMed] [Google Scholar]
- 75.King C, Tangye SG, Mackay CR. T follicular helper (TFH) cells in normal and dysregulated immune responses. Annu Rev Immunol. 2008;26:741–66. doi: 10.1146/annurev.immunol.26.021607.090344. [DOI] [PubMed] [Google Scholar]
- 76.Rolf J, Bell SE, Kovesdi D, et al. Phosphoinositide 3-kinase activity in T cells regulates the magnitude of the germinal center reaction. J Immunol. 2010;185:4042–52. doi: 10.4049/jimmunol.1001730. [DOI] [PubMed] [Google Scholar]
- 77.Simpson TR, Quezada SA, Allison JP. Regulation of CD4 T cell activation and effector function by inducible costimulator (ICOS) Curr Opin Immunol. 2010;22:326–32. doi: 10.1016/j.coi.2010.01.001. [DOI] [PubMed] [Google Scholar]
- 78.Zotos D, Coquet JM, Zhang Y, et al. IL-21 regulates germinal center B cell differentiation and proliferation through a B cell-intrinsic mechanism. J Exp Med. 2010;207:365–78. doi: 10.1084/jem.20091777. [DOI] [PMC free article] [PubMed] [Google Scholar]
- 79.Linterman MA, Beaton L, Yu D, et al. IL-21 acts directly on B cells to regulate Bcl-6 expression and germinal center responses. J Exp Med. 2010;207:353–63. doi: 10.1084/jem.20091738. [DOI] [PMC free article] [PubMed] [Google Scholar]
- 80.Bessa J, Kopf M, Bachmann MF. Cutting edge: IL-21 and TLR signaling regulate germinal center responses in a B cell-intrinsic manner. J Immunol. 2010;184:4615–9. doi: 10.4049/jimmunol.0903949. [DOI] [PubMed] [Google Scholar]
- 81.Li MO, Wan YY, Flavell RA. T cell-produced transforming growth factor-beta1 controls T cell tolerance and regulates Th1- and Th17-cell differentiation. Immunity. 2007;26:579–91. doi: 10.1016/j.immuni.2007.03.014. [DOI] [PubMed] [Google Scholar]
- 82.Rubtsov YP, Rasmussen JP, Chi EY, et al. Regulatory T cell-derived interleukin-10 limits inflammation at environmental interfaces. Immunity. 2008;28:546–58. doi: 10.1016/j.immuni.2008.02.017. [DOI] [PubMed] [Google Scholar]
Associated Data
This section collects any data citations, data availability statements, or supplementary materials included in this article.