

Abstract
Follicular dendritic cells (FDC) are an important subset of stromal cells within the germinal centres of lymphoid tissues. They are specialized to trap and retain antigen-containing immune complexes on their surfaces to promote B-cell maturation and immunoglobulin isotype class-switching. However, little is known of the cell types from which FDC originate. To address fundamental questions associated with the relationships between FDC and other cell populations, we took advantage of the growing body of publicly available data for transcriptome analysis. We obtained a large number of gene expression data files from a range of different primary mouse cells and cell lines and subjected these data to network-based cluster analysis using BiolayoutExpress3D. Genes with related function clustered together in distinct regions of the graph and enabled the identification of transcriptional networks that underpin the functional activity of distinct cell populations. Several gene clusters were identified that were selectively expressed by cells of mesenchymal lineage and contained classic mesenchymal cell markers and extracellular matrix genes including various collagens, Acta2, Bgn, Fbn1 and Twist1. Our analysis showed that FDC also express highly many of these mesenchyme-associated genes. Promoter analysis of the genes comprising the mesenchymal clusters identified several regulatory motifs that are binding sites for candidate transcription factors previously known to be candidate regulators of mesenchyme-specific genes. Together, these data suggest FDC are a specialized mesenchymal cell population within the germinal centres of lymphoid tissues.
Keywords: clustering; follicular dendritic cell; mesenchyme; meta-analysis, microarray; transcriptomics
Introduction
The highly organized microarchitecture of secondary lymphoid organs (SLO) enables antigen-presenting cells and rare antigen-specific lymphocytes to interact in the presence of antigen and mount an effective immune response. The SLO include spleen, lymph nodes and Peyer's patches as well as isolated lymphoid follicles in the intestine and share characteristic structural features that compartmentalize the areas containing T cells and B cells into distinct regions. The structure of SLO is maintained by constitutive interactions between haematopoietic and stromal cell constituents.1–3 The stromal cells of SLO comprise a heterogeneous grouping of non-migratory cells with diverse functions, which include the organization and compartmentalization of SLO, the formation of the extracellular matrix, the guidance and survival of immune cells, and the formation of conduits through which small lymph-borne antigens may be delivered to the lymph node parenchyma.1–4
At least seven stromal cell populations within SLO have been identified, including fibroblastic reticular cells,5 marginal reticular cells,6 red pulp fibroblasts,7 lymph node medullary fibroblasts,8 lymphatic endothelial cells,9 vascular endothelial cells10 and follicular dendritic cells (FDC).11 The FDC reside in the primary B-cell follicles and germinal centres of lymphoid tissues and are a distinct cell lineage from bone-marrow-derived classical dendritic cells,12 because they are non-phagocytic, and non-migratory stromal cells.13 Characteristically, FDC possess many slender and convoluted dendritic processes that extend over large distances to surround numerous neighbouring lymphocytes. As a consequence the FDC has a large surface area, which is used to efficiently trap and retain native antigen in the form of immune complexes, consisting of antigen–antibody and complement components. The longevity of FDC ensures that antigen is retained upon their surfaces for long periods.11,14 Antigens trapped on the surface of FDC are considered to promote immunoglobulin-isotype class switching, affinity maturation of naive IgM+ B cells and the maintenance of immunological memory.15–19 The FDC are also considered to play an important role in controlling the clearance of apoptotic B lymphocytes20 and the pathogenesis of prion diseases,21 infection with HIV,22 sarcomas,23 B-cell lymphomas24 and certain chronic inflammatory and autoimmune diseases.25
B cells provide important cytokine stimuli such as membrane lymphotoxin (LT) α1β2 and tumour necrosis factor-α, which maintain FDC in their differentiated state.26 Lymphocyte-derived LTα1β2 signals through the LTβ receptor (LTβR) expressed on FDC or their precursor cells.17 Constitutive LTα1β2-stimulation is required because FDC rapidly collapse when LTβR-signalling is inhibited.26 However, little is known of the precursor cell types from which FDC differentiate. Conflicting data suggest that FDC derive from mesenchymal,17,27 bone marrow28 or monocytic29 precursors or a fusion between cells of stromal and haematopoietic cell lineages.30
We have recently carried out gene expression cluster analysis on a diverse range of primary cells and cell lines31–33 using the novel network graph tool BiolayoutExpress3D.34,35 These meta-analyses show that certain clusters of genes that are correlated in their expression across these large data sets clearly associate with specific tissue or cell types (e.g. the haematopoietic and mesenchymal lineages) and with specific cellular functions/pathways (e.g. phagocytosis, inflammatory cytokine production, oxidative phosphorylation, cell cycle, extracellular matrix). This approach enables predictions to be made on gene function based on the company they keep, as well as on the functional status of different cell populations. In the current study we reasoned that if we examined a diverse set of microarray data from distinct mouse cell populations, we would be able to identify clusters of co-expressed genes that were shared by FDC and other cell lineages, and thereby gain insights into the ontogeny of this important subset of SLO stromal cells. We obtained a large number of gene expression data files representing distinct mouse cell types including FDC and subjected them to network-based cluster analysis. Our analysis of these data suggests that FDC are a unique population of mesenchymal cells within the B-cell follicles of SLO.
Materials and methods
Selection of gene expression data sets
The GEO database was searched for mouse mesenchymal cell and FDC expression data sets. Data sets were selected based on the following three criteria: (i) cell type studied, (ii) chip platform (Affymetrix mouse genome MOE430 2.0 expression arrays), and (iii) availability of raw data (.cel) files. In addition, a diverse range of cell and tissue populations (haematopoietic, myeloid, lymphoid etc.) was selected from a large publicly available gene expression data set performed on the same platform (GSE10246).36 Accordingly, a set of mouse gene expression data was collected comprising results from a total of 85 chips representing 44 different cell populations or treatments (Table 1). All raw data (.cel) files were downloaded and normalized using RMA (Affymetrix, Santa Clara, CA). Probe sets were then annotated using the latest libraries available from Affymetrix (http://www.affymetrix.com) and samples were arranged according to cell-type grouping to ease interpretation of these data (mesenchymal cells, bone marrow progenitors, myeloid cells, classical dendritic cells, lymphocytes, FDC).
Table 1.
Information on the cellular identities and sources of data sets analysed in this study (in order of presentation from left to right on the cluster profiles)
| Abbreviation | Cell line | Description | Chip IDs | References |
|---|---|---|---|---|
| OB 5 days | Osteoblast | Primary neonatal calvarial osteoblast 5 days after stimulation with glycerophosphate and ascorbate | GSM258741, GSM258742 | 36 |
| OB 14 days | Osteoblast | Osteoblast 14 days after stimulation | GSM258736, GSM258737 | 36 |
| OB 21 days | Osteoblast | Osteoblast 21 days after stimulation | GSM258739, GSM258740 | 36 |
| 10T1/2 | C3H 10T1/2 | Embryonic mesenchymal multipotent osteoblast progenitor | GSM258631, GSM258632 | 36 |
| MC3T3 | MC3T3 | Osteoblast precursor cell line established from newborn mouse calvaria | GSM492805, GSM492806 | 73 |
| Chondrocytes | Chondrocytes | Primary chondrocytes | GSM226740, GSM266741, GSM266742 | 74 |
| 3T3-L1 | 3T3-L1 | Embryonic fibroblasts – adipocyte-like | GSM258609, GSM258610 | 36 |
| NIH3T3 | NIH 3T3 | Embryonic fibroblasts | GSM258729, GSM258730 | 36 |
| C2C12 | C2C12 | Myoblast | GSM258629, GSM258630 | 36 |
| SVEC4-10 | SVEC4-10 | Endothelial cells | GSM234693 | 75 |
| MS-1 | MS-1 | Endothelial cells | GSM234692 | 75 |
| Lymphoid endothelial | Endothelial cells | Lymphatic endothelial cells | GSM143704 | 47 |
| Bruce4 | Bruce4 p13 | Embryonic stem cell | GSM258655, GSM258656 | 36 |
| V26 | V26 2 p16 | Embryonic stem cell | GSM258657, GSM258658 | 36 |
| MIMCD3 | mIMCD-3 | Renal inner medullary epithelial cell | GSM258723, GSM258724 | 36 |
| min6 | MIN-6 | Pancreatic beta cell, insulin-secreting | GSM258725, GSM258726 | 36 |
| neuro2a | neuro2A | Neuroblastoma | GSM258727, GSM258728 | 36 |
| Haematopoietic stem cells | Haematopoietic stem cells | Haematopoietic stem cells | GSM258769, GSM258770 | 36 |
| Mega erythroid precursors | Mega erythroid progenitor cells | Mega erythroid progenitor cells | GSM258719, GSM258720 | 36 |
| Myeloid progenitor cells | Common myeloid progenitor cells | Common myeloid progenitor cells | GSM258641, GSM258642 | 36 |
| Granulocyte monocyte precursors | Granulocyte/monocyte progenitor cells | Granulocyte/monocyte progenitor cells | GSM258665, GSM258666 | 36 |
| CD8a+ DC | Classical dendritic cells | CD8α+‘lymphoid’ classical dendritic cells | GSM258645, GSM258646 | 36 |
| CD8a− DC | Classical dendritic cells | CD8α−‘myeloid’ classical dendritic cells | GSM258647, GSM258648 | 36 |
| Plasmacytoid DC | Plasmacytoid dendritic cells | Plasmacytoid dendritic cells (B220+) | GSM258649, GSM258650 | 36 |
| BMM | Macrophage | Bone-marrow-derived macrophages – unstimulated | GSM258693, GSM258694 | 36 |
| BMM LPS 6 hr | Macrophage | Bone-marrow-derived macrophages – 6 hr after LPS stimulation | GSM258699, GSM258700 | 36 |
| Peritoneal macrophages | Peritoneal macrophages | Thioglycollate-elicited peritoneal macrophages – unstimulated | GSM258701, GSM258702 | 36 |
| PM thio 7 hr | Peritoneal macrophages | Thioglycollate-elicited peritoneal macrophages – 7 hr after lipopolysaccharide stimulation | GSM258705, GSM258706 | 36 |
| RAW-264 | RAW264/7 | Macrophage-like cell line | GSM258755, GSM258756 | 36 |
| Microglia | Microglia | Microglial cells | GSM258721, GSM258722 | 36 |
| Osteoclasts | Osteoclasts | Osteoclasts, CSF-1 and RANKL-treated bone marrow cultures | GSM258743, GSM258744 | 36 |
| Granulocytes | Granulocytes | Purified CD11b+, Gr-1+ peripheral granulocytes | GSM258667, GSM258668 | 36 |
| NK cells | NK cells | NK1.1-positive natural killer cells | GSM258731, GSM258732 | 36 |
| Mast cells | Mast cells | Culture-derived bone marrow mast cells (with interleukin-3) | GSM258711, GSM258712 | 36 |
| BAF3 | Ba/F3 | Interleukin-3-dependent pro-B-cell line | GSM258619, GSM258620 | 36 |
| Follicular B cells | Follicular B cells | Splenic follicular B cells | GSM258663, GSM258664 | 36 |
| Marginal zone B cells | Marginal zone B cells | Splenic marginal zone B cells | GSM258621, GSM258622 | 36 |
| CD4+ T cells | CD4+ T cells | CD4-positive T helper cells | GSM258773, GSM258774 | 36 |
| CD8+ T cells | CD8+ T cells | CD8-positive cytotoxic T cells | GSM258775, GSM258776 | 36 |
| Bone marrow | Bone marrow | Bone marrow | GSM258627, GSM258628 | 36 |
| Spleen | Spleen | Splenocytes | GSM258767, GSM258768 | 36 |
| Lymph nodes | Lymph nodes | Lymph node cells | GSM258691, GSM258692 | 36 |
| FDC | Follicular dendritic cells | In vitro cultivated follicular dendritic cells from antigen-primed draining lymph node | RMLNDC001001 | 53 |
| FL-Y | FL-Y cells | Lymphotoxin β receptor signalling-dependent follicular dendritic cell line | RMLNDC002001, RMLNDC003001 | 52,53 |
| FDC1 | Follicular dendritic cells | FDC-enriched and FDC-depleted mouse splenocytes | GSM38295, GSM38296, GSM38297, GSM38298, GSM38299, GSM38300, GSM38301, GSM38302, GSM38303, GSM38304, GSM38305, GSM38306, GSM38307, GSM38308 | 37 |
| FDC2 | HK-cells | Human FDC-like cell line derived from tonsil | n/a | n/a |
| FDC | Follicular dendritic cells | Lymph node FDC | GSM481971, GSM 481972, GSM481973 | 48 |
| TNP treated FDC | GSM481974, GSM481975 | |||
| Peyer's patch FDC | GSM481976, GSM481977, GSM481978 | |||
| Fresh lymph node FDC | GSM562383, GSM562384, GSM562385 | |||
| CFA-treated FDC | ||||
| CFA/PAM-treated FDC |
All samples were analysed on Affymetrix mouse genome MOE430 2.0 expression arrays unless indicated otherwise.
Performed on Affymetrix mouse genome U74v2 expression arrays.
Performed on Affymetrix human genome U133A 2.0 expression arrays. Authors' own data (S-OY and ASF).
CFA, complete Freund's adjuvant; PAM, Pam2CSK4, a synthetic diacylated lipopeptide.
In addition, we considered data sets from a published study of FDC-enriched and FDC-depleted mouse splenocytes performed on Affymetrix mouse genome U74v2 expression arrays (GEO DataSets accession number GSE2123),37 and data sets derived from the human FDC cell line,38 HK, performed on Affymetrix human genome U133A 2.0 expression arrays.
Network analysis
Normalized, non-log transformed gene expression data were imported into BioLayoutExpress3D, a tool specifically designed for the visualization of large network graphs.34,35 First, a sample-to-sample correlation matrix was calculated and a graph was plotted using all sample-to-sample relationships > 0·9. In this context, nodes represent individual data sets (cells) and the edges between them Pearson correlation coefficients above the selected threshold. Next, a pairwise transcript-to-transcript Pearson correlation matrix was calculated based on each transcript's profile across all samples. A Pearson correlation coefficient cut-off threshold of r=0·85 was selected and an undirected network graph of these data was generated. In this context nodes represent individual probe sets (genes/transcripts) and the edges between them Pearson correlation coefficients above the selected threshold. The resulting graph was large and highly structured. The network was then clustered into groups of genes sharing similar profiles using the built-in Markov Clustering (MCL) algorithm at an MCL inflation value (which controls the granularity of clustering)35 set to 2·2. The graph of these combined data sets was then explored extensively to understand the significance of the gene clusters and the functional relationships between the cell populations investigated.
Cluster annotation
Genes in the clusters of interest were assessed for recognized homologies, cellular location and function using publicly available web-based analysis tools and databases including: Ensembl (http://www.ensembl.org/index.html); GSEA MSigDB (http://www.broadinstitute.org/gsea/msigdb/index.jsp); GOstat (http://gostat.wehi.edu.au);39 UniProt (http://www.uniprot.org). GSEA and GOstat analysis generated multiple hits for most clusters and clusters were annotated if hits of high significance showed a common trend as to function. These analyses were supplemented by comparison of the clusters generated here with tissue-specific and cell-specific clusters derived from network-based analyses of an atlas of mouse tissues and purified mouse cell populations (http://www.BioGPS.gnf.org; data not shown), in addition to literature review.
Transcription factor binding site analysis
RefSeq IDs for each transcript on the Affymetrix MOE430_2 array that was present in the network (i.e. had at least one correlation with another transcript with Pearson r > 0·85) were obtained from the NetAffx database (https://www.affymetrix.com/analysis/netaffx/index.affx). To further improve the accuracy of transcriptional start site (TSS) identification, we used the FANTOM database of mouse Cap Analysis of Gene Expression (CAGE)-tags and expression (http://fantom.gsc.riken.jp/4/download/Tables/mouse/CAGE/promoters/tag_clusters/)40 to identify true TSS. By sequencing transcripts from the 5′ end and then mapping these sequences to the genome, CAGE provides state-of-the-art accuracy for the identification of TSS. The most abundantly transcribed CAGE-tag in the FANTOM 3 data set within 1000 bp upstream or downstream of the annotated RefSeq TSS was taken as the TSS for that gene. Where no CAGE-defined TSS could be found within this range, the annotated TSS from the RefSeq was used.
Promoter sequences 300 bp upstream and 100 bp downstream of the CAGE-defined TSS were extracted from the mouse genome sequence (version mm9). Transcription factor binding site motifs were identified using the JASPAR CORE 2008 motif set (http://jaspar.cgb.ki.se) and Clover (P<0·01, score threshold = 6) was used to detect over-represented motifs in promoters for each expression cluster compared with a ‘background set’ comprising the 2000-bp upstream sequence from all mouse genes.41
Immunohistochemistry
Mouse spleens were fixed in paraformaldehyde fixative and embedded in paraffin wax. Sections (thickness, 6 μm) were deparaffinized, and immunostained with the following antibodies: ACTA2 was detected using monoclonal antibody E184 (Novus Europe, Cambridge, UK); B cells were detected using monoclonal antibody B220 to detect CD45R (Caltag, Towcester, UK). Following the addition of primary antibody, species-specific secondary antibodies coupled to Alexa Fluor® 488 (green) and Alexa Fluor® 555 (red) dyes were used (Invitrogen, Paisley, UK). Sections were mounted in fluorescent mounting medium (DakoCytomation, Ely, UK) and examined using a Zeiss LSM5 confocal microscope (Zeiss, Welwyn Garden City, UK).
Results
FDC share mesenchyme-related global gene expression profiles
A large number of gene expression data files generated on a single microarray platform (Affymetrix MOE430-2; Table 1) were collected representing 44 different primary mouse cells and cell lines. To examine the relationships between samples a Pearson correlation matrix was calculated based on the global similarities between these normalized data. The matrix was then imported into BiolayoutExpress3D34,35 and a graph was created of the sample-to-sample correlations using relationships r>0·9 to define edges (Fig. 1). This analysis showed that the different populations of lymphoid, myeloid and mesenchymal cells clustered together and occupied specific regions of the graph. For example, the mononuclear phagocytes (macrophages, microglia and osteoclasts) were all located within a distinct region of the graph (cluster 3). Similarly, all the cells of mesenchymal origin also clustered together in a separate region of the graph (cluster 1). Located within this cluster were the three FDC-derived data sets (in vitro cultivated FDC from mouse lymph nodes and FL-Y cells) indicating that FDC posses a global gene expression profile most similar to mesenchymal cells.
Figure 1.

Clustering of samples based on their global gene expression profile. A Pearson correlation matrix was prepared by comparing data derived from all 85 samples used in this study performed on the Affymetrix mouse genome MOE430 2.0 expression array. A graph was constructed using sample-to-sample relationships greater than r=0·9. Nodes represent samples (individual chips) and edges are coloured according to the strength of the correlation (red, r=1·0; blue, r=0·9). The graph was then clustered using a Markov clustering (MCL) inflation value of 2·2 and each cluster of samples assigned a different colour. Full descriptions of the sources of each data set are given in Table 1.
Clustering of co-expressed genes in distinct cell lineages
Next, a full probe set-to-probe set Pearson correlation matrix was calculated whereby the similarity in the expression profile of each transcript (probe set) represented on the array was compared across each of the 85 samples. The network graph contained 19 043 nodes representing individual transcripts connected by 508 681 edges indicating Pearson correlation values above the selected threshold of r=0·85. After clustering, 453 clusters of more than five nodes were obtained and their contents are provided in the Supplementary material, Table S1. To enable others to explore this graph in greater detail these data will be made available as a network graph on the macrophages.com website (http://www.macrophages.com/) that is maintained by The Roslin Institute.
The network graph's topology is complex and is derived from cliques of genes which are co-expressed (Fig. 2). This analysis clearly shows that clusters containing genes with related expression patterns were localized within similar neighbourhoods within the graph. For example, clusters 24, 25 and 93 contain genes that are highly expressed in mesenchymal cells. They are found close to each other in the network layout, adjacent to other mesenchymal cell-type specific clusters (Fig. 2). Other clusters, such as those for haematopoietic cell lineages, are geographically distant from the mesenchymal clusters, but close to each other.
Figure 2.

Network analysis of mouse cell and tissue transcriptomics data. Right panel: main component of the network graph derived from 85 samples of mouse cell and tissue populations run on Affymetrix MOE430_2 arrays. Nodes represent transcripts (probe sets) and the edges represent correlations between individual expression profiles above r=0·85. The colour of the nodes represents the cluster to which they have been assigned. The red oval highlights the area of the graph occupied by the main mesenchymal related expression clusters. Left panel: enlargement of the mesenchyme-related gene expression clusters isolated from the main graph (red highlighted area on main network graph). Annotations show cluster number (C_XXX) and cluster description.
Comparison of gene expression signatures between distinct cell populations
The average expression profile of the genes in a selection of example clusters derived from the network graph is shown in Fig. 3 and those of the largest 50 clusters is shown in the Supplementary material, Fig. S1. The expression profile of these clusters helps to provide an indication of the biology they encode. A number of clusters contained genes that were expressed across all samples. These predominantly contained genes involved in housekeeping functions and reflected the metabolic and mitotic activity of the cells expressing them. For example, several clusters were enriched with genes involved with cell division (cluster 8, 62, 103 and 109) and RNA/protein processing (cluster 15, 27, 41, 85, 102, 105 and 114) (Fig. 3a, clusters 15 and 41). Cluster 58 comprised exclusively the probes for the Affymetrix hybridization controls.
Figure 3.

The average expression profiles of the genes in selected clusters over the 85 samples. The x-axis shows samples, grouped according to cell type: 1, mesenchyme-lineage cells, endothelial cells, embryonic stem cells, neurosecretory cells; 2, bone marrow progenitor cells; 3, splenic classical dendritic cells (DC) and plasmacytoid DC; 4, phagocytes (bone marrow-derived, peritoneal, RAW-264 cells, osteoclasts, microglia); 5, granulocytes, natural killer (NK) cells and mast cells; 6, B and T lymphocytes; 7, tissues (bone marrow, spleen and lymph nodes); 8, follicular dendritic cells (FDC). The y-axis shows average expression for the cluster (intensity). (a) Expression profiles of main ‘housekeeping’ clusters: cluster 15, grey; cluster 41, brown. (b) Profiles of clusters derived from mast cells (brown, cluster 3), B cells (pink, cluster 10), T cells (light brown, cluster 14) and NK cells (blue, cluster 23). (c) Profile of phagocyte-related gene clusters: cluster 49, turquoise; cluster 66, orange. (d) Profile of haematopoietic cell-related gene clusters: cluster 54, dark green; cluster 55, light green. (e) Profile of main mesenchyme-specific gene clusters: cluster 24, dark green; cluster 25, pink; cluster 92, blue; cluster 93, light green.
A remarkable number of cell-specific gene clusters were also identified (Table 2 and see Supplementary material, Table S1). For example, cluster 3 is enriched in genes related to the function of mast cells including Kit, Lif, Mcpt6 and P2rx7. Cluster 10 contain genes known to be involved in B-cell signalling and antigen presentation and includes Blr1, C2ta, Cd19, Cd22, Cd37, Cd74, Cd79a, Cd79b, Lta, Ltb, and several genes encoding the MHC class II complex and immunoglobulin production. Cluster 14 contains T-cell-specific genes including Cd3e, Cd3g, Cd28, Cd24, Tcra, Tcrb-j and Zap70 and the recently reported T-cell-lineage-dependent transcription factor Bcl11b (Bcl11b).42–44 Cluster 23 is enriched with natural killer cell-specific genes including Gzma, Klra3, Klra5, Klra7 and Prf-1 (Fig. 3b, clusters 3, 10, 14 and 23). A number of phagocyte-related clusters were also identified which contain typical phagocyte-related genes including Atp1a3, Atp6v0d2, Ctsb, Fcgr1, Fcgr3, Lgmn and Lip1 (clusters 28, 32, 49 and 66, Fig. 3c).
Table 2.
Annotation of cell-type specific co-expressed gene clusters
| Cluster ID number | Cluster profile description | Putative cluster function or cell lineage | Number transcripts | Number annotated genes | Known markers present in cluster | Significantly over-represented GO terms | Over-represented transcription factor binding sites1 |
|---|---|---|---|---|---|---|---|
| 3 | High in mast cells | Mast cell-related | 310 | 182 | Ccr1l1, Cd55, Cd200r3, Cd200r4, Cma1, Cpa3, Csf2rb2, Fcer1a, Gata2, Hrh4, Il4ra, Kit, Lif, Mcpt6, Mcpt-ps1, P2rx7, Pgr, Ptger3, Runx1 | Klf4, SPI1, SPIB, id1, Pax4, ELF5, ETS1, Myf, Eip74EF, Dof, GABPA, Broad-complex_3, TBP, SQUA, NFYA, ELK1, NFIL3,FOXD1, ABI4 | |
| 5 | High in bone marrow > mega erythroid precursors/granulocytes | Bone marrow progenitor related/granulocyte-related | 2231 | 126 | Ank1, Ccr3, Chi3l3, Cpox, Ear1, Ela2, Epb4.1, Epb4.2, Epb4.9, Epor, Epx, Eraf, Fech, Hba-a1, Hba-b1, Kel, Nfe2, Ngp, Rhag, Rhd, Urod, Uros, Xkh | GO:0030097, GO:0006783, GO:0005506 | iD1, SPI1, Broad-complex_4, Broad-complex_3, ETS1, ELF5, Eip74EF, NHLH1, En1, NFYA, TBP, MEF2A, PEND, usp, Cebpa, ELK1, AGL3 |
| 6 | High in osteoblasts | Extracellular matrix | 220 | 138 | Ceecam1, Cilp, Col3a1, Col8a1, Col14a1, Ecm2, Eln, Fap, Fmod, Fndc1, Kera, Matn2, Matn4, Meox2, Mmp23, Spock3, Vcam1 | GO:0005578 | Klf4, MNB1A, PBF, id1, Dof3, MZF1_5-13, RUSH1-alfa, Gfi, Pax5, TFAP2A, TBP, IRF2, MEF2A, AGL3 |
| 10 | High in mature B cells > DC | B-cell activation/antigen presentation | 176 | 101 | Blr1, C2ta, Cd19, Cd22, Cd74, Cd79a, Cd79b, Fcer2a, H2-Oa, H2-Ob, Igh-1a, Lta, Ltb | GO:0042113, GO:0002504 | Eip74EF, SPIB, SPI1, Myf, IRF1, ETS1, STAT1, REL, RELA, TFAP2A, Dl_2, GABPA, Lhx3, NF-kappaB, ELK1, Mafb, MEF2A, Sox17, bZIP911, AGL3 |
| 14 | High in T cells > NK cells/DC | T-cell activation | 114 | 47 | Bcl11b, Cd3e, Cd3g, Cd28, Cd247, Itk, Lime1, Tcra, Tcrb-j, Tcrb-V13, Zap70 | GO:0042101, GO:0004872 | RREB1, Dof2, SPIB, SPI1, MNB1A, ETS1, ELF5, Staf, REL, Eip74EF, NHLH1, NF-kappaB, RELA, NFKB1 |
| 17 | High in endothelial cells | Endothelium-related | 91 | 62 | Esam1, Nos3, Pecam1, Sele, Selp | GO:0001525, GO:0007165, GO:0007154 | SPI1, ELF5, SPIB, Eip74EF, ETS1 |
| 18 | High in chondrocytes | Extracellular matrix | 86 | 53 | Agc1, Bmp5, Cart1, Chad, Col9a1, Col9a2, Col9a3, Fgfr3, Hapln1, Krt14, Loxl4, Matn1, Matn3, Omd | GO:0005578, GO:0044421, GO:0005615 | Myf, Dof2, PBF, MNB1A, TBP, AGL3, Evi1 |
| 23 | High in NK cells | NK-cell-related | 79 | 54 | Ctsw, Fasl, Gzma, Klra3, Klra5, Klra7, Klra12, Klra18, 20, Klra22, Notch2, Prf1 | Pax4, id1, MZF1_5-13, Broad-complex_1, SPIB, ELF5, ETS1, Eip74EF, RUNX1 | |
| 24 | High in mesenchymal cells/FDC | Mesenchyme-related | 75 | 46 | Acta2, Bgn, Col1a1, Col1a2, Col3a1, Col6a1, Col6a2, Fbn1, Il6st, Lox, Mmp2, Pcolce, Prrx1, Sgce, Twist1 | GO:0044420, GO:0005578, GO:0005581 | Klf4, hb, id1, HNF1A, MZF1_1-4, Broad-complex_4, SQUA, MNB1A, Dof2, PBF, SPI1, TBP, Staf, Dof3, FOXL1, Broad-complex_3, Cebpa, HMG-1, STAT1, Broad-complex_2, REL, AGL3, Athb-1, En1, MEF2A, SRY, RELA, Gfi, Agamous, dl_1, PEND, Sox5, ARR10, Nkx2-5, ABI4, HLF, SOX9, E2F1 |
| 25 | High in mesenchymal cells/FDC | Mesenchyme-related | 63 | 44 | Col5a2, Col12a1, Cthrc1, Edg2, Fzd1, Gpc6, Mgp, | GO:0005578, GO:0044421, GO:0005783 | NFYA, TEAD1, MYB.ph3, ABI4 |
| 28 | High in peritoneal macrophages > BMM/RAW264/microglia/osteoclasts | Phagocyte-related | 58 | 33 | Atg4c, Atp1a3, Atp6v0d2, Cdkn1c. Clec7a, Ctsb, Ctsl, Daglb, Edem2, Galc, Gpr175, Hipk2, Lgals3, Lhfpl2, Mamdc2, Matk, Naglu, Plekhm2, Rgl1, S100a1, Samd8,Snx27, Soat1, Spsb4, Tnfsf12, Tor2a, Tpcn2 | Pax4, Dof2, MNB1A, Staf, PBF, En1, ELK1, ovo, NFYA, RUNX1, MYB.ph3 | |
| 30 | High in myoblasts | Muscle-related | 56 | 38 | Chrna1, Des, Eno3, Kcnf1, Murc, Musk, Myf5, Myod1, | GO:0007517 | Myf, TBP, NHLH1, MEF2A, FOXL1, NFYA, AGL3, ABI4, GATA3 |
| 49 | High in macrophages/RAW264/microglia/osteoclasts | Phagocyte-related | 30 | 17 | Atp6v0c, Atp6v1a, Atp6v1b2, Atp6v1c1, Cln8, Ctsb, Gpnmb, Gusb, Htr2b, Lgmn, Tbc1d22a, Trem2 | GO:0015986 | No motifs identified |
Clusters generated from the cell-lineage expression data using BioLayoutExpress3D (see Supplementary material, Table S1; r=0·85, MLC = 2·2) were individually curated and annotated based upon examination of the average expression profile, GO terms and biological knowledge. Genes were chosen to represent known lineage or functional markers within each cluster. Statistically over-represented transcription factor binding sites within each cluster.
BMM, bone-marrow-derived macrophages; DC, classical dendritic cells; FDC, follicular dendritic cells; GO, gene ontology; NK, natural killer.
Over-represented transcription factors presented in order of over-representation.
FDC do not co-express haematopoietic cell-specific gene signatures
Our main aim was to use a clustering approach to compare the gene expression signatures of FDC with those of mesenchymal and haematopoietic cell lineages to gain insights into the ontogeny of this important subset of SLO stromal cells. A number of clusters were identified in which genes were co-expressed at high levels by bone marrow progenitor cells (for example: clusters 5, 21, 33, 54, 55 and 63) (Fig. 3d, clusters 54 and 55). Although genes in some of these clusters were also co-expressed at high levels by classical dendritic cells, granulocytes, natural kiler cells and lymphocytes, none were co-expressed by FDC supporting the idea of their non-haematopoietic origin.
Expression of mesenchyme-specific gene signatures by FDC
A number of mesenchyme-specific gene expression cluster profiles were identified (Fig. 3e, Tables 2 and S1) which occupied a specific niche in the network graph (Fig. 2) indicating that they contained genes with similar transcriptional features. Several of these clusters consisted of genes expressed at high levels by all cells of mesenchymal origin (clusters 24, 25, 92, 93 and 112). Cluster 24 for example contained many classical mesenchyme-related genes including Acta2, Bgn, Fbn1, Il6st, Lox, Mmp2, Pcolce, Prrx1, Sgce, Twist1 and various collagens. Across this large data set it was noticeable that the FDC consistently replicated the expression patterns of cells of mesenchymal origin and co-expressed the general mesenchyme gene clusters at high levels (Fig. 3e, clusters 24, 25, 92 and 93). Data from this analysis therefore suggest that FDC share a common gene expression profile with mesenchymal cells.
A number of clusters were expressed at high levels by specific mesenchymal cell lineages (Tables 2 and S1). For example, cluster 6 was specifically expressed at high levels by differentiating calvarial osteoblasts and contained Cilp, Ecm2, Eln, Kera, Matn2, Matn4, Meox2, Mmp2 and Vcam1. Cluster 18 was expressed by chondrocytes and osteoblasts and was enriched in extracellular matrix and typical osteoblast-specific genes including Agc1, Bmp5, Cart1, Chad, Krt14, Loxl4 and Omd. Cluster 30 was expressed by myoblasts and contained many muscle-related genes including Chrna1, Kcnf1, Murc, Musk, Myf5 and Myod1. Each of these clusters was generally specific to an individual mesenchymal cell lineage and not expressed by FDC. However, cluster 31 was expressed at high levels by in vitro cultivated FDC from mouse lymph nodes. In addition to a number of cytokines/chemokines and extracellular matrix components, this cluster contained several antioxidant and apoptosis regulator genes including Adc, Bcl2l15 (Gm566), Bdkrb2, Becn1, Gbp1, Mdm4, Stc1 and Vegfa. The expression of these genes by FDC may aid their longevity and ensure antigen is retained upon their surfaces for extended periods to maintain long-term immune memory.11,14
Figure 4 shows a selection of expression profiles across this large data set for genes widely used as markers for specific cell types. For example, Cd3e is expressed at high levels by T cells, Cd19 is restricted to B cells, and Prf1 is expressed by natural killer cells and CD8+ T cells (Fig. 4a). When compared across this large data set it is evident that the classical mesenchyme-related genes Acta2, Bgn, Fbn1 and Twist1 are highly expressed by all cells of mesenchyme lineages including FDC (Fig. 4b). Furthermore, immunohistochemical analysis of mouse spleens confirmed the expression of ACTA2 in association with FDC within the B-cell follicles (Fig. 4c). High levels of ACTA2 expression were also observed upon endothelial cells within the central arteriole.
Figure 4.
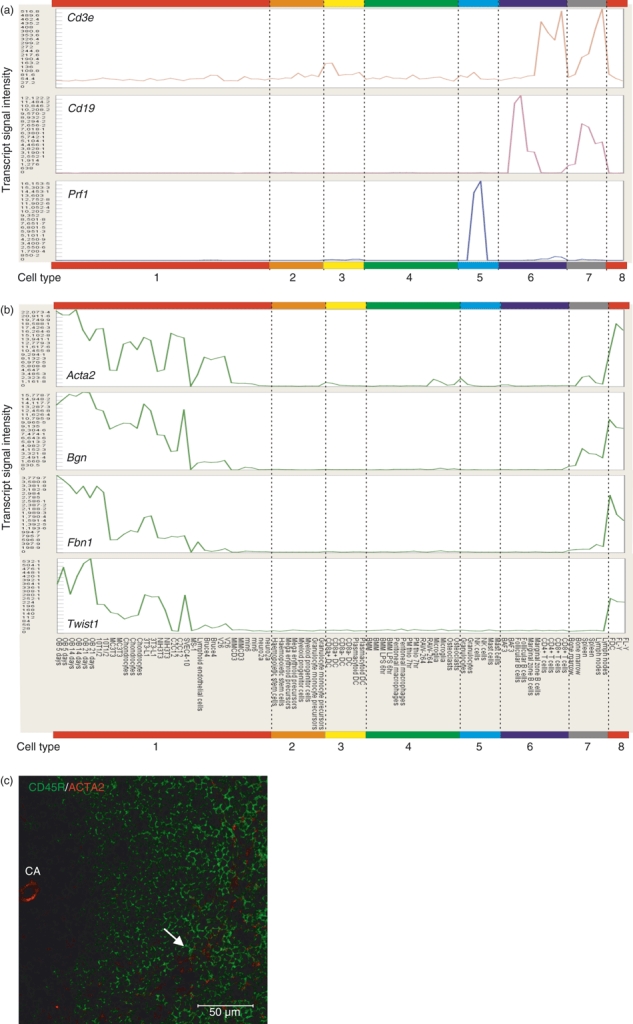
Mean gene expression profiles of selected marker genes over the 85 mouse cell samples. Samples are grouped according to cell type: 1, mesenchyme-lineage cells, embryonic stem cells, neurones; 2, bone marrow progenitor cells; 3, splenic classical dendritic cells (DC) and plasmacytoid DC; 4, phagocytes (bone marrow-derived, peritoneal, RAW-264 cells, osteoclasts, microglia); 5, granulocytes, natural killer (NK) cells and mast cells; 6, B and T lymphocytes; 7, tissues (bone marrow, spleen and lymph nodes); 8, follicular dendritic cells (FDC). (a) Cd3e (C_014), Cd19 (C_010), Prf1 (C_023). (b) Acta2, Bgn, Fbn1, Twist1 (all C_024). (c) Immunohistochemical analysis of mouse spleens shows ACTA2 expression (red) in association with FDC (arrowhead) in the B-cell follicles (CD45R, green). High levels of ACTA2 expression were also observed upon endothelial cells within the central arteriole (CA). Scale bar, 50 μm.
Comparison of gene expression signatures between distinct endothelial cell samples
Included in these data were three independent endothelial cell samples: SVEC4-10 cells (transiently simian virus 40-infected lymph node stromal cells);45 MS-1 cells (derived from pancreatic islets)46 and primary dermal lymphatic endothelial cells47 (Table 1). However, the expression profiles of these endothelial cell populations were not uniform. Two clusters were specifically co-expressed by both MS-1 cells and primary dermal lymphatic endothelial cells (clusters 16 and 17). Cluster 17, for example, contained typical endothelial cell-specific genes such as Esam1, Nos3, Pecam1, Sele and Selep. None of these gene expression clusters were shared by SVEC4-10 cells, which had a distinct gene expression profile (cluster 44) implying that they lack many characteristics of primary endothelial cells (Fig. 5).
Figure 5.

Comparison of Esam1, Nos3 and Sele transcript expression levels by primary mouse lymphoid endothelial cells and the SVEC4-10 and MS-1 mouse endothelial cell lines.
Expression of mesenchyme-specific cluster genes by FDC in other data sets
The analysis described above did not include all publicly available gene expression data for mouse FDC, because individual studies were performed on different expression array platforms. To determine whether FDC from other mouse SLO robustly expressed high levels of mesenchyme-related genes we examined a published study of gene expression by FDC enriched from mouse spleens performed on Affymetrix mouse genome U74v2 expression arrays.37 Expression data for the top 5% of transcripts expressed by FDC-enriched splenocytes, when compared with FDC-depleted splenocytes, were identified and compared with those genes within the mesenchyme-specific clusters identified above (clusters 24, 25, 92, 93 and 112). Results were available for 97 of the 114 annotated mesenchyme-specific genes. Our analysis showed that 55% of these genes including Acta2, Bgn, Fbn1, Il6st, Prrx1, Twist1 and various collagens were among the top 5% of those expressed by splenic FDC (see Supplementary material, Table S2). In contrast, none of these mesenchyme-specific genes were among the top 5% expressed by FDC-depleted splenocytes when compared with FDC-enriched splenocytes (see Supplementary material, Table S3). These data from mouse splenic FDC support our conclusion that FDC are a distinct population of mesenchyme-derived cells.
Expression of mesenchyme-specific gene signatures by human FDC
To determine whether FDC derived from human tonsils also expressed high levels of mesenchyme-related genes we examined gene expression data from the human FDC-like cell line,38 HK, performed on Affymetrix human genome U133A 2.0 expression arrays. Expression data for the top 5% of transcripts were identified and compared with those genes within the mesenchyme-specific clusters identified above (clusters 24, 25, 92, 93 and 112). Results for 91 orthologues of the 114 murine annotated mesenchyme-specific genes were available. Our analysis showed that 47% of these genes were among the top 5% of genes expressed by human FDC (see Supplementary material, Table S4). Together, these data demonstrate that both human and mouse FDC express high levels of classic mesenchymal and extracellular matrix-related genes.
Identification of multiple cell gene expression profiles within the same sample
During the preparation of this manuscript an additional study was published48 that described gene expression data derived from mouse Peyer's patch and peripheral lymph node FDC performed on the Affymetrix mouse genome MOE430 2.0 expression array as used in our cluster analysis. Eleven gene expression data sets were selected representing peripheral lymph node FDC, Peyer's patch FDC and FDC from the lymph nodes of immunized mice (Table 1). These data sets were added to our collection, the 98 gene expression data sets were re-normalized and the cluster analysis was repeated as described above (r=0·85; MCL 2·2). When we analysed the top 5% of transcripts expressed in these additional data sets many FDC-associated genes were represented including C1qa, Cd44, Clu, Cxcl1, Cxcl13, Fcgr2b, Fcgr3, Gpm6b, Icam1, Mfge8, Mmp2, Prnp, Serpina1a1, Tgfbi and Vcam1.2,3,37,49 However, additional analyses showed that the gene expression profiles of the FDC-derived data sets from the study by Suzuki et al.48 (termed Suzuki FDC herein after) were quite distinct. In contrast to data from our analysis of FDC from a variety of mouse and human sources, the Suzuki FDC data sets expressed very low levels of mesenchyme- and extracellular matrix-related transcripts and did not express high levels of mesenchyme-related gene expression clusters (see Supplementary material, Table S5). Furthermore, among the top 5% of transcripts within the Suzuki FDC data sets were many classical macrophage-specific genes including Cd68, Cd86, Cd274, Csf1r, Emr1, Igav, Itgax, Mpeg, Msr1 and constituents of the proton pump (see Supplementary material, Table S6). This analysis shows that although the Suzuki FDC samples contain many FDC-specific transcripts, these samples also clearly contain a predominant phagocyte-related gene expression signature. Our analysis of gene expression data from a range of mouse and human FDC (as described above) did not reveal significant expression of phagocyte-related transcripts. This suggests that the Suzuki FDC samples most likely also contain tingible body macrophages, which are specifically located in the B-cell follicles within which the FDC reside. Tingible body macrophages are recognized by the Mfge8-specific antibody (monoclonal antibody FDC-M1), which was used to enrich the FDC from lymph nodes and Peyer's patches.20,48,50
Transcription factor and promoter analysis
The clusters identified here represent transcriptional networks of co-expressed genes and one might expect them to share transcription factor-responsive elements in their promoters. We therefore carried out a transcription factor binding site analysis using the tool Clover41 as described previously31 to detect significantly over-represented motifs in the promoter region of genes identified by transcripts in each cluster. Of the 11 512 probes within the top 121 clusters described, 9752 had RefSeq transcript IDs in the netaffx database, and 8250 RefSeq transcript IDs had an annotated TSS. In all, 211 genes had no CAGE-defined TSS within a 1000-bp range of the annotated TSS. In these instances the RefSeq TSS was used. For those genes with a CAGE-defined TSS, the median shift from the annotated TSS was 0 bp (interquartile range: −35 to +39 bp; range −996 to +999 bp).
Clover (P-value threshold = 0·01, raw score threshold = 6) identified significant enrichment for binding sites for 136 of the 138 transcription factors in the JASPAR CORE database. The Clover score estimates the degree of over-representation of a given sequence by estimating the thermodynamic binding energy of a transcription factor to the promoter sequences of genes in a given cluster, and comparing this with the binding energy of the transcription factor to a control sequence (in this case, the 2000 bp upstream of all mouse promoters).51Table 2 and Supplementary material, Table S1 list the transcription factors that had the highest positive correlations with expression pattern of each cluster. Results are presented in order of Clover score, with the highest score (i.e. most thermodynamically stable pairing) first. The lists of over-represented transcription factor binding sites support the view that each cluster is distinct and derived from an underlying transcriptional programme. Our previous promoter analysis identified several candidate transcriptional regulators that correlated with expression of Fbn1 and other mesenchyme-related cluster genes.33 In the current study, five of these transcription factors (KLF4, Broadcomplex 4, Agamous, TEAD1 and E2F1) were likewise correlated with the mesenchyme/FDC-specific cluster genes.
Discussion
As a result of the practical problems encountered when attempting to isolate highly purified FDC populations from mouse SLO, it has been difficult to study with confidence the origin, phenotype and function of this important cell subset. The issues associated with the failure to enrich FDC to significant homogeneity are numerous and include: contamination with other cell types such as B cells with which they form tight groupings; contamination with macrophages which can co-express Mfge8, a typical marker used to identify FDC;20,50 low yield because FDC represent < 1% of the cells within mouse SLO; fastidious in vitro cultivation conditions because they require constant LTβR-stimulation to maintain them in their differentiated state.26 In the current study we analysed expression data from FL-Y cells, an LTβR-signalling-dependent FDC cell line established from mouse lymph nodes52 and an FDC cell line from human tonsil38 as well as data from in vitro cultivated FDC enriched from mouse lymph nodes,53 FDC-enriched mouse splenocytes37 and FDC-enriched from mouse Peyer's patches and peripheral lymph nodes.48 These data were then compared with a collection of gene expression data from a diverse range of mouse cell lineages. The use of such a large data set enabled gene expression signatures that distinguished different haematopoietic and mesenchymal cell lineages to be readily discriminated and compared. In addition, we were able to identify over-represented transcription factor motifs specific to the clusters, which provides a mechanism through which co-expression is regulated.
Our analysis showed that FDC co-expressed high levels of mesenchyme-related gene clusters, suggesting that FDC are a specialized mesenchymal cell population within the germinal centres of SLO. Predictably, the mesenchyme-specific clusters were enriched in genes encoding components of the extracellular matrix, including various collagens, Bgn, Fbn1, Gpc6, Lox, Mmp2, Pcolce and Postn. The expression of these components by FDC illustrates the crucial role these cells play in the maintenance of the microarchitecture within B-cell follicles and high titre immunoglobulin responses.54 Stromal cell-derived biglycan (Bgn gene) may have multiple roles in the extracellular matrix surrounding FDC networks. Biglycan has been shown to enhance the clustering of B cells and stimulate their proliferation55 implying a similar role on the surface of FDC within germinal centres. The FDC are considered an important source of C1q within the germinal centre.49 A role for biglycan as a down-regulator of the pro-inflammatory effects mediated through C1q has been proposed.56 Extracellular matrix-associated biglycan is linked with sequestration of cytokines such as transforming growth factor-β, thereby inactivating and controlling local concentrations of this anti-inflammatory cytokine.57,58 The modulation of fibrillin-1 (Fbn1 gene) expression by biglycan has also been proposed as a mechanism through which transforming growth factor-β activity in the extracellular matrix may be regulated.59 Interleukin-6 is considered to play an important role in germinal centre development and the maintenance of high titre immunoglobulin responses.60,61Il6st (encoding the Il6 signal transducer, CD130) was a member of mesenchyme-related cluster 24, which was highly expressed in FDC. The mesenchyme-specific clusters were also enriched in numerous genes involved in the synthesis, formation and deposition of collagen fibres. The expression of these genes by FDC would help to maintain the structure of the B-cell follicle during the different stages of the germinal centre reaction, facilitate the guidance of lymphocytes within it and assist in the formation of conduits through which small lymph-borne antigens and chemokines may drain through the stroma to B-cell follicles.3,62,63
Chronic inflammation often leads to the formation of organized ectopic tertiary lymphoid tissues in target tissues.64 These tertiary lymphoid structures typically comprise germinal centres with networks of FDC, T-cell areas and high endothelial venules.25,65 Several key events promote the formation of tertiary lymphoid tissues including: chronic inflammation; LT-expression; homeostatic chemokine expression by stromal cells (e.g. CXCL13, CCL19 and CCL21); and development of high endothelial venules. In mice, transgenic over-expression of CXCL13 in the pancreas is sufficient to induce tertiary lymphoid tissue formation.66 The expression of CXCL13 is considered to induce the migration of LT-expressing lymphocytes into the chronically inflamed tissue.25 Data in the current study clearly show that FDC share a common mesenchymal-specific gene expression profile. Hence, the ability of FDC networks to arise spontaneously in a range of chronically inflamed non-lymphoid tissue environments implies that tissue-resident mesenchymal cells such as fibroblasts may be triggered to differentiate into FDC upon appropriate stimulation (for example, via LTβR and homeostatic chemokine stimulation).
Across this data set several clusters were identified that clearly defined the individual mesenchymal lineages (chondrocytes, cluster 18; endothelial cells, cluster 17; myoblasts, cluster 30 etc.). Likewise, cluster 31 was co-expressed at high levels by FDC. The characteristic longevity of FDC ensures that antigen is retained upon their surfaces for long periods to promote immunoglobulin-isotype class switching, affinity maturation and the maintenance of immunological memory.15–19 The co-expression of a number of antioxidant and apoptosis regulator genes within this cluster may act to aid the longevity of FDC to ensure antigen is retained upon their surfaces for extended periods. No other FDC-specific gene expression clusters were identified raising the suggestion that FDC in SLO differentiate from mesenchymal fibroblastic reticular cells.
Among the genes most highly expressed by FDC in this analysis was Acta2, which encodes alpha-smooth muscle actin (Fig. 4b). Expression of Acta2 is considered a characteristic feature of myofibroblasts.67,68 These mesenchyme-derived reparative connective tissue cells contribute to the reconstruction of injured tissue by secreting new extracellular matrix and by exerting high contractile force.67–69 The expression of high levels of Acta2 by FDC has led to the suggestion that these cells are a specialized form of myofibroblasts.70 However, across this large data set it was evident that Acta2 expression was coordinated with the genes in the mesenchyme-specific cluster 24 and expressed at high levels by all cells of mesenchyme lineage. This indicates that Acta2 is a general mesenchyme lineage marker that does not provide insight into the type of mesenchymal cells represented by FDC.
Although complement receptors 2 and 1 (CD21/35) encoded by the Cr2 gene are expressed at high levels by FDC and mature B cells in vivo,71 the probe set for this gene (1425289_a_at) was present in the B-cell-related Cluster 38. Analysis of the expression levels of the Cr2 probe set showed that it was highly expressed by B cells, but it was absent/barely detectable in FDC RNA. This was true for all the FDC data sets analysed in this study (both in vivo isolated FDC and FDC cell lines). The reasons for this discrepancy are uncertain. In the mouse, B cells and FDC produce the CR1 and CR2 proteins through alternative splicing of the Cr2 gene.72 This may suggest that FDC express an alternatively spliced variant of the Cr2 gene to that expressed in mature B cells, which is not recognized by the Cr2-specific probe set. Alternatively, FDC require constitutive LTβR-mediated stimulation from surrounding lymphocytes to maintain their maturation status.26 In the absence of this stimulation FDC rapidly de-differentiate. It is therefore plausible that because of an absence of LTβR stimulation during their enrichment from lymphoid tissues, FDC begin to de-differentiate and lose expression of Cr2.
Our clustering analysis showed the Suzuki FDC (isolated from mouse Peyer's patches and peripheral lymph nodes)48 had different expression profiles from the other lymph node FDC, FL-Y cell line, enriched splenic FDC and HK cell data. They had low levels of mesenchyme markers and high expression of classical macrophage markers indicating a predominant phagocyte expression signature,31 most likely from the inclusion of tingible body macrophages in the cell preparations. The mixed population of cell types in these preparations revealed by our clustering analysis suggests that some of the responses seen may be the result of the macrophage component rather than the FDC.48
This study shows that the large resource of publicly available gene expression data can be used to make informed comparisons on the relationships and characteristics of distinct cell lineages. Our clustering analyses clearly show that FDC co-express common mesenchymal gene expression signatures, implying that FDC differentiate from mesenchymal precursor cells in SLO. Further analysis of these clusters of co-expressed genes will aid the identification of novel mesenchymal and FDC lineage and differentiation markers, and regulators of cell function during normal or pathogenic conditions.
Acknowledgments
We thank Masaki Hikida (Kyoto University, Japan) and Prof. Yong-Sung Choi (Ochsner Clinic Foundation, New Orleans) for helpful discussions and for providing access to raw data files. This research was supported by Biotechnology and Biological Sciences Research Council (BBSRC) Institute Strategic Grant funding, a BBSRC Japan Partnering Award (NAM), a Wellcome Trust Clinical Fellowship (JKB) and National Institutes of Health grant P01CA92625 (ASF).
Glossary
Abbreviations
- CAGE
capped analysis of gene expression
- FDC
follicular dendritic cell
- LT
lymphotoxin
- LTβR
lymphotoxin β receptor
- MCL
Markov clustering
- SLO
secondary lymphoid organ
- TSS
transcriptional start site
Disclosures
The authors declare no competing interests.
Supporting Information
Additional Supporting Information may be found in the online version of this article:
Figure S1. Cellular expression profiles of the top 50 coexpressed gene clusters (Pearson r = 0·85, MCL = 2·2).
Table S1. Cluster functional enrichment analysis at Pearson r = 0·85, MCL 2·2.
Table S2. Mesenchyme-specific cluster genes in the top 5% co-expressed by enriched splenic follicular dendritic cells (FDC) versus FDC-depleted splenocytes in the study described by Huber et al.37
Table S3. Mesenchyme-specific cluster genes in the top 5% co-expressed by follicular dendritic cells (FDC) - depleted splenocytes versus FDC-enriched splenocytes in the study described by Huber et al.37
Table S4. Mesenchyme-specific cluster genes in the top 5% co-expressed by human follicular dendritic cells (HK cells).
Table S5. Limited co-expression of mesenchyme-specific cluster genes in follicular dendritic cell data sets described by Suzuki et al.48
Table S6. Identification of phagocyte/macrophage-related transcripts in follicular dendritic cell data sets described by Suzuki et al.48
Please note: Wiley-Blackwell are not responsible for the content or functionality of any supporting materials supplied by the authors. Any queries (other than missing material) should be directed to the corresponding author for the article.
References
- 1.Mebius RE, Kraal G. Structure and function of the spleen. Nat Rev Immunol. 2005;5:606–16. doi: 10.1038/nri1669. [DOI] [PubMed] [Google Scholar]
- 2.Buettner M, Pabst R, Bode U. Stromal cell heterogeneity in lymphoid organs. Trends Immunol. 2009;31:80–6. doi: 10.1016/j.it.2009.11.003. [DOI] [PubMed] [Google Scholar]
- 3.Mueller SN, Germain RN. Stromal cell contributions to the homeostasis and functionality of the immune system. Nat Rev Immunol. 2009;9:618–29. doi: 10.1038/nri2588. [DOI] [PMC free article] [PubMed] [Google Scholar]
- 4.Roozendaal R, Mebius RE, Kraal G. The conduit system of the lymph node. Int Immunol. 2008;20:1482–7. doi: 10.1093/intimm/dxn110. [DOI] [PubMed] [Google Scholar]
- 5.Van Vliet E, Melis M, Foidart JM, Van Ewijk W. Reticular fibroblasts in peripheral lymphoid organs identified by a monoclonal antibody. J Histochem Cytochem. 1986;34:883–90. doi: 10.1177/34.7.3519751. [DOI] [PubMed] [Google Scholar]
- 6.Balogh P, Horvath G, Szakal AK. Immunoarchitecture of distinct reticular fibroblastic domains in the white pulp of mouse spleen. J Histochem Cytochem. 2004;52:1287–98. doi: 10.1177/002215540405201005. [DOI] [PubMed] [Google Scholar]
- 7.van den Berg TK, van der Ende M, Dopp EA, Kraal G, Dijkstra CD. Localization of beta 1 integrins and their extracellular ligands in human lymphoid tissues. Am J Pathol. 1993;143:1098–110. [PMC free article] [PubMed] [Google Scholar]
- 8.Katakai T, Hara T, Sugai M, Gonda H, Shimizu A. Lymph node fibroblastic reticular cells construct the stromal reticulum via contact with lymphocytes. J Exp Med. 2004;200:783–95. doi: 10.1084/jem.20040254. [DOI] [PMC free article] [PubMed] [Google Scholar]
- 9.Ma B, Jablonska J, Lindenmaier W, Dittmar KE. Immunohistochemical study of the reticular and vascular network of mouse lymph node using vibratome sections. Acta Histochem. 2007;109:15–28. doi: 10.1016/j.acthis.2006.11.002. [DOI] [PubMed] [Google Scholar]
- 10.von Andrian UH, Mempel TR. Homing and cellular traffic in lymph nodes. Nat Rev Immunol. 2003;3:867–78. doi: 10.1038/nri1222. [DOI] [PubMed] [Google Scholar]
- 11.Mandel TE, Phipps RP, Abbot A, Tew JG. The follicular dendritic cell: long term antigen retention during immunity. Immunol Rev. 1980;53:29–59. doi: 10.1111/j.1600-065x.1980.tb01039.x. [DOI] [PubMed] [Google Scholar]
- 12.Shortman K, Liu Y-J. Mouse and human dendritic cell subtypes. Nat Rev Immunol. 2002;2:151–61. doi: 10.1038/nri746. [DOI] [PubMed] [Google Scholar]
- 13.Imazeki N, Senoo A, Fuse Y. Is the follicular dendritic cell a primarily stationary cell? Immunology. 1992;76:508–10. [PMC free article] [PubMed] [Google Scholar]
- 14.Suzuki K, Grigorova I, Phan TG, Kelly LM, Cyster JG. Visualizing B cell capture of cognate antigen from follicular dendritic cells. J Exp Med. 2009;206:1485–93. doi: 10.1084/jem.20090209. [DOI] [PMC free article] [PubMed] [Google Scholar]
- 15.Fu Y-X, Molina H, Matsumoto M, Huang G, Min J, Chaplin DD. Lymphotoxin-α (LTα) supports development of splenic follicular structure that is required for IgG response. J Exp Med. 1997;185:2111–20. doi: 10.1084/jem.185.12.2111. [DOI] [PMC free article] [PubMed] [Google Scholar]
- 16.Fu Y-X, Huang G, Wang Y, Chaplin DD. B lymphocytes induce the formation of follicular dendritic cell clusters in a lymphotoxin α-dependent fashion. J Exp Med. 1998;187:1009–18. doi: 10.1084/jem.187.7.1009. [DOI] [PMC free article] [PubMed] [Google Scholar]
- 17.Endres R, Alimzhanov MB, Plitz T, Futterer A, Kosco-Vilbois MH, Nedospasov SA, Rajewsky K, Pfeffer K. Mature follicular dendritic cell networks depend on expression of lymphotoxin β receptor by radioresistant stromal cells and of lymphotoxin β and tumour necrosis factor by B cells. J Exp Med. 1999;189:159–68. doi: 10.1084/jem.189.1.159. [DOI] [PMC free article] [PubMed] [Google Scholar]
- 18.Fu Y-X, Huang G, Wang Y, Chaplin DD. Lymphotoxin-α-dependent spleen microenvironment supports the generation of memory B cells and is required for their subsequent antigen-induced activation. J Immunol. 2000;164:2508–14. doi: 10.4049/jimmunol.164.5.2508. [DOI] [PubMed] [Google Scholar]
- 19.Aydar Y, Sukumar A, Szakal AK, Tew JG. The influence of immune complex-bearing follicular dendritic cells on the IgM response, Ig class switching, and production of high affinity IgG. J Immunol. 2005;174:5358–66. doi: 10.4049/jimmunol.174.9.5358. [DOI] [PubMed] [Google Scholar]
- 20.Kranich J, Krautler NJ, Heinen E, et al. Follicular dendritic cells control engulfment of apoptotic bodies by secreting Mfge8. J Exp Med. 2008;205:1293–302. doi: 10.1084/jem.20071019. [DOI] [PMC free article] [PubMed] [Google Scholar]
- 21.Mabbott NA, MacPherson GG. Prions and their lethal journey to the brain. Nat Rev Microbiol. 2006;4:201–11. doi: 10.1038/nrmicro1346. [DOI] [PubMed] [Google Scholar]
- 22.Burton GF, Brandon FK, Estes JD, Thacker TC, Gartner S. Follicular dendritic cell contributions to HIV pathogenesis. Semin Immunol. 2002;14:275–84. doi: 10.1016/s1044-5323(02)00060-x. [DOI] [PubMed] [Google Scholar]
- 23.Vermi W, Lonardi S, Bosisio D, et al. Identification of CXCL13 as a new marker for follicular dendritic cell sarcoma. J Pathol. 2008;216:356–64. doi: 10.1002/path.2420. [DOI] [PubMed] [Google Scholar]
- 24.Yoon S-O, Zhang X, Freedman AS, Zahrieh D, Lossos IS, Li L, Choi YS. Down-regulation of CD9 expression and its correlation to tumour progression in B lymphomas. Am J Pathol. 2010;177:377–86. doi: 10.2353/ajpath.2010.100048. [DOI] [PMC free article] [PubMed] [Google Scholar]
- 25.Gommerman JL, Browning JL. Lymphotoxin/LIGHT, lymphoid microenvironments and autoimmune disease. Nat Rev Immunol. 2003;3:642–54. doi: 10.1038/nri1151. [DOI] [PubMed] [Google Scholar]
- 26.Mackay F, Browning JL. Turning off follicular dendritic cells. Nature. 1998;395:26–7. doi: 10.1038/25630. [DOI] [PubMed] [Google Scholar]
- 27.Humphrey JH, Grennan D, Sundaram V. The origin and function of follicular dendritic cells in the mouse and the mechanism of trapping of immune complexes on them. Eur J Immunol. 1984;14:859–64. doi: 10.1002/eji.1830140916. [DOI] [PubMed] [Google Scholar]
- 28.Kapasi ZF, Qin D, Kerr WG, Kosco-Vilbois MH, Schultz LD, Tew JG, Szakal AK. Follicular dendritic cell (FDC) precursors in primary lymphoid tissues. J Immunol. 1998;160:1078–84. [PubMed] [Google Scholar]
- 29.Heinemann DEH, Peters JH. Follicular dendritic cell-like cells derived from human monocytes. BMC Immunol. 2005;6:23. doi: 10.1186/1471-2172-6-23. [DOI] [PMC free article] [PubMed] [Google Scholar]
- 30.Murakami T, Chen X, Hase K, Sakamoto A, Nishigaki C, Ohno H. Splenic CD19−CD35+B220+ cells function as an inducer of the follicular dendritic cell-network formation. Blood. 2007;110:1215–24. doi: 10.1182/blood-2007-01-068387. [DOI] [PMC free article] [PubMed] [Google Scholar]
- 31.Hume DA, Summers KM, Raza S, Baillie JK, Freeman TC. Functional clustering and lineage markers: insights into cellular differentiation and gene function from large-scale microarray studies of purified primary cell populations. Genomics. 2010;95:328–38. doi: 10.1016/j.ygeno.2010.03.002. [DOI] [PubMed] [Google Scholar]
- 32.Mabbott NA, Baillie JC, Hume DA, Freeman TC. Meta-analysis of co-expressed gene signatures in mouse leukocyte populations. Immunobiology. 2010;215:724–36. doi: 10.1016/j.imbio.2010.05.012. [DOI] [PubMed] [Google Scholar]
- 33.Summers KM, Raza S, van Nimwegen E, Freeman TC, Hume DA. Coexpression of FBN1 with mesenchyme-specific genes in mouse cell lines: implications for the phenotypic variability in Marfan syndrome. Eur J Hum Genet. 2010;18:1209–15. doi: 10.1038/ejhg.2010.91. [DOI] [PMC free article] [PubMed] [Google Scholar]
- 34.Freeman TC, Goldovsky L, Brosch M, et al. Construction, visualisation, and clustering of transcriptional networks from microarray expression data. PLoS Comput Biol. 2007;3:2032–42. doi: 10.1371/journal.pcbi.0030206. [DOI] [PMC free article] [PubMed] [Google Scholar]
- 35.Theocharidis A, van Dongen S, Enright AJ, Freeman TC. Network visualisation and analysis of gene expression data using Biolayout Express3D. Nat Protoc. 2009;4:1535–50. doi: 10.1038/nprot.2009.177. [DOI] [PubMed] [Google Scholar]
- 36.Lattin JE, Schroder K, Su AI, et al. Expression analysis of G protein-coupled receptors in mouse macrophages. Immunome Res. 2008;5:5. doi: 10.1186/1745-7580-4-5. [DOI] [PMC free article] [PubMed] [Google Scholar]
- 37.Huber C, Thielen C, Seeger H, et al. Lymphotoxin-β receptor-dependent genes in lymph node and follicular dendritic cell transcriptomes. J Immunol. 2005;174:5526–36. doi: 10.4049/jimmunol.174.9.5526. [DOI] [PubMed] [Google Scholar]
- 38.Kim H-S, Zhang X, Klyushnenkova E, Choi YS. Stimulation of germinal center B lymphocyte proliferation by an FDC-like cell line, HK. J Immunol. 1995;155:1101–9. [PubMed] [Google Scholar]
- 39.Beissbarth T, Speed TP. GOstat: find statistically overrepresented Gene Ontologies within a group of genesq. Bioinformatics. 2004;20:1464–5. doi: 10.1093/bioinformatics/bth088. [DOI] [PubMed] [Google Scholar]
- 40.Fantom C. The transcriptional landscape of the mammalian genome. Science. 2005;309:1559–63. doi: 10.1126/science.1112014. [DOI] [PubMed] [Google Scholar]
- 41.Frith MC, Fu Y, Yu L, Chen JF, Hansen U, Weng Z. Detection of functional DNA motifs via statistical over-representation. Nucleic Acids Res. 2004;32:1372–81. doi: 10.1093/nar/gkh299. [DOI] [PMC free article] [PubMed] [Google Scholar]
- 42.Li P, Burke S, Wang X, et al. Reprogramming of T cells to natural killer-like cells upon Bcl11b deletion. Science. 2010;329:85–9. doi: 10.1126/science.1188063. [DOI] [PMC free article] [PubMed] [Google Scholar]
- 43.Li L, Leid M, Rothenberg EV. An early T cell lineage commitment checkpoint dependent on the transcription factor Bcl11b. Science. 2010;329:89–93. doi: 10.1126/science.1188989. [DOI] [PMC free article] [PubMed] [Google Scholar]
- 44.Ikawa T, Hirose S, Masuda K, et al. An essential developmental checkpoint for production of the T cell lineage. Science. 2010;329:93–6. doi: 10.1126/science.1188995. [DOI] [PubMed] [Google Scholar]
- 45.O'Connell KA, Edidin M. A mouse lymphoid endothelial cell line immortalized by simian virus 40 binds lymphocytes and retains functional characteristics of normal endothelial cells. J Immunol. 1990;144:521–5. [PubMed] [Google Scholar]
- 46.Arbiser JL, Moses MA, Fernandez CA, et al. Oncogenic H-ras stimulates tumour angoigenesis by two distinct pathways. Proc Natl Acad Sci USA. 1997;94:861–6. doi: 10.1073/pnas.94.3.861. [DOI] [PMC free article] [PubMed] [Google Scholar]
- 47.Johnson LA, Clasper S, Holt AP, Lalor PF, Baban D, Jackson DG. An inflammation-induced mechanism for leukocyte transmigration across lymphatic vessel endothelium. J Exp Med. 2006;203:2763–77. doi: 10.1084/jem.20051759. [DOI] [PMC free article] [PubMed] [Google Scholar]
- 48.Suzuki K, Maruya M, Kawamoto H, Sitnik K, Kitamura H, Agace WW, Fagarasan S. The sensing of environmental stimuli by follicular dendritic cells promotes immunoglobulin A generation in the gut. Immunity. 2010;33:71–83. doi: 10.1016/j.immuni.2010.07.003. [DOI] [PubMed] [Google Scholar]
- 49.Schwaeble W, Schäfer MK-H, Petry F, Fink T, Knebel D, Weihe E, Loos M. Follicular dendritic cells, interdigitating cells, and cells of the monocyte-macrophage lineage are the C1q-producing sources in the spleen. J Immunol. 1995;155:4971–8. [PubMed] [Google Scholar]
- 50.Hanamaya R, Tanaka M, Miyasaka K, Aozasa K, Koike M, Uchiyama Y, Nagata S. Autoimmune disease and impaired uptake of apoptotic cells in MFG-E8-deficient mice. Science. 2004;304:1147–50. doi: 10.1126/science.1094359. [DOI] [PubMed] [Google Scholar]
- 51.Frith MC, Li MC, Weng Z. Cluster-binding: finding dense clusters of motifs in DNA sequences. Nucleic Acids Res. 2003;31:3666–8. doi: 10.1093/nar/gkg540. [DOI] [PMC free article] [PubMed] [Google Scholar]
- 52.Nishikawa Y, Hikida M, Magari M, Kanayama N, Mori M, Kitamura H, Kurosaki T, Ohmori H. Establishment of lymphotoxin β receptor signaling-dependent cell lines with follicular dendritic cell phenotypes from mouse lymph nodes. J Immunol. 2006;177:5204–14. doi: 10.4049/jimmunol.177.8.5204. [DOI] [PubMed] [Google Scholar]
- 53.Hijikata A, Kitamura H, Kimura Y, et al. Construction of an open-access database that integrates cross-reference information from the transcriptome and proteome of immune cells. Bioinformatics. 2007;23:2934–41. doi: 10.1093/bioinformatics/btm430. [DOI] [PubMed] [Google Scholar]
- 54.Ansel KM, Ngo VN, Hyman PL, et al. A chemokine-driven feedback loop organizes lymphoid follicles. Nature. 2000;406:309–14. doi: 10.1038/35018581. [DOI] [PubMed] [Google Scholar]
- 55.Oritani K, Kincade PW. Identification of stromal cell products that interact with pre-B cells. J Cell Biol. 1996;134:771–82. doi: 10.1083/jcb.134.3.771. [DOI] [PMC free article] [PubMed] [Google Scholar]
- 56.Groeneveld TW, Oroszlan M, Owens RT, et al. Interactions of the extracellular matrix proteogylcans decorin and biglycan with C1q and collectins. J Immunol. 2005;175:4715–23. doi: 10.4049/jimmunol.175.7.4715. [DOI] [PubMed] [Google Scholar]
- 57.Merline R, Schaefer RM, Schaefer L. The matricellular functions of small leucine-rich proteoglycans. J Cell Commun Signal. 2009;3:323–35. doi: 10.1007/s12079-009-0066-2. [DOI] [PMC free article] [PubMed] [Google Scholar]
- 58.Sorokin L. The impact of the extracellular matrix on inflammation. Nat Rev Immunol. 2010;10:712–23. doi: 10.1038/nri2852. [DOI] [PubMed] [Google Scholar]
- 59.Schaefer L, Mihalik D, Babelova A, et al. Regulation of fibrillin-1 by biglycan and decorin is important for tissue preservation in the kidney during pressure-induced injury. Am J Pathol. 2004;165:383–96. doi: 10.1016/S0002-9440(10)63305-6. [DOI] [PMC free article] [PubMed] [Google Scholar]
- 60.Kopf M, Herren S, Wiles MV, Pepys MB, Kosco-Vilbois MH. Interleukin 6 influences germinal center development and antibody production via a contribution of C3 complement component. J Exp Med. 1998;188:1895–906. doi: 10.1084/jem.188.10.1895. [DOI] [PMC free article] [PubMed] [Google Scholar]
- 61.Wu Y, El Sikh MEM, El Sayed RM, Best AM, Szakal AK, Tew JG. IL-6 produced by immune complex-activated follicular dendritic cells promotes germinal center reactions, IgG responses and somatic hypermutation. Int Immunol. 2009;21:745–56. doi: 10.1093/intimm/dxp041. [DOI] [PMC free article] [PubMed] [Google Scholar]
- 62.Bajénoff M, Germain RN. B cell follicle development remodels the conduit system and allows soluble antigen delivery to follicular dendritic cells. Blood. 2009;114:4989–97. doi: 10.1182/blood-2009-06-229567. [DOI] [PMC free article] [PubMed] [Google Scholar]
- 63.Roozendaal R, Mempel TR, Pitcher LA, González SF, Verschoor A, Mebius RE, Von Andrian UH, Carroll MC. Conduits mediate transport of low-molecular-weight antigen to lymph node follicles. Immunity. 2009;30:264–76. doi: 10.1016/j.immuni.2008.12.014. [DOI] [PMC free article] [PubMed] [Google Scholar]
- 64.Drayton DL, Liao S, Mounzer RH, Ruddle NH. Lymphoid organ development: from ontogeny to neogenesis. Nat Immunol. 2006;7:344–52. doi: 10.1038/ni1330. [DOI] [PubMed] [Google Scholar]
- 65.Sims GP, Shiono H, Willcox N, Stott DI. Somatic mutation and selection of B-cells in thymic germinal centres with specificity for acetylcholine receptor (AChR) in myasthenia gravis. J Immunol. 2001;167:1935–44. doi: 10.4049/jimmunol.167.4.1935. [DOI] [PubMed] [Google Scholar]
- 66.Luther SA, Lopez T, Bai W, Hanahan D, Cyster JG. BLC expression in pancreatic islets causes B cell recruitment and lymphotoxin-dependent lymphoid neogenesis. Immunity. 2000;12:471–81. doi: 10.1016/s1074-7613(00)80199-5. [DOI] [PubMed] [Google Scholar]
- 67.Hinz B, Phan SH, Thannickal VJ, Galli A, Bochaton-Piallat M-L, Gabbiani G. The myofibroblast: one function, multiple origins. Am J Pathol. 2007;170:1807–16. doi: 10.2353/ajpath.2007.070112. [DOI] [PMC free article] [PubMed] [Google Scholar]
- 68.Phan SH. Biology of fibroblasts and myofibroblasts. Proc Am Thorac Soc. 2008;5:334–7. doi: 10.1513/pats.200708-146DR. [DOI] [PMC free article] [PubMed] [Google Scholar]
- 69.Popova AP, Bozyk PD, Goldsmith AM, Linn MJ, Lei J, Bentley JK, Hershenson MB. Autocrine production of TGF-b1 promotes myofibroblastic differentiation of neonatal lung mesenchymal stem cells. Am J Physiol Lung Cell Mol Physiol. 2010;298:L735–43. doi: 10.1152/ajplung.00347.2009. [DOI] [PMC free article] [PubMed] [Google Scholar]
- 70.Muñoz-Fernández R, Blanco FJ, Frecha C, Martín F, Kimatrai M, Abadía-Molina AC, Gracía-Pacheco JM, Olivares EG. Follicular dendritic cells are related to bone marrow stromal cell progenitors and to myofibroblasts. J Immunol. 2006;177:280–9. doi: 10.4049/jimmunol.177.1.280. [DOI] [PubMed] [Google Scholar]
- 71.Victoratos P, Lagnel J, Tzima S, Alimzhanov MB, Rajewsky K, Pasparakis M, Kollias G. FDC-specific functions of p55TNFR and IKK2 in the development of FDC networks and of antibody responses. Immunity. 2006;24:65–77. doi: 10.1016/j.immuni.2005.11.013. [DOI] [PubMed] [Google Scholar]
- 72.Jacobson AC, Weis JH. Comparative functional evolution of human and mouse CR1 and CR2. J Immunol. 2008;181:2953–9. doi: 10.4049/jimmunol.181.5.2953. [DOI] [PMC free article] [PubMed] [Google Scholar]
- 73.Zetterblad J, Qian H, Zandi S, et al. Genomics based analysis of interactions between developing B-lymphocytes and stromal cells reveal complex interactions and two-way communication. BMC Genomics. 2010;11:108. doi: 10.1186/1471-2164-11-108. [DOI] [PMC free article] [PubMed] [Google Scholar]
- 74.Fukada T, Civic N, Furuichi T, et al. The zinc transporter SLC39A13/ZIP13 is required for connective tissue development; its involvement in BMP/TGF-beta signaling pathways. PLoS ONE. 2008;3:e3642. doi: 10.1371/journal.pone.0003642. [DOI] [PMC free article] [PubMed] [Google Scholar]
- 75.Ledgerwood LG, Lal G, Zhang N, et al. The sphingosine 1-phosphate receptor 1 causes tissue retention by inhibiting the entry of peripheral tissue T lymphocytes into afferent lymphatics. Nat Immunol. 2008;9:42–53. doi: 10.1038/ni1534. [DOI] [PubMed] [Google Scholar]
Associated Data
This section collects any data citations, data availability statements, or supplementary materials included in this article.