

Abstract
Imaging is an important approach to diagnosis, monitoring and predicting outcomes for patients with Autosomal Dominant polycystic Kidney Disease (ADPKD). This paper reviews three common clinical imaging techniques, ultrasonography, computed tomography (CT), magnetic resonance imaging (MRI) and their role in management of ADPKD. Ultrasonographic criteria for diagnosis in children and adults are reviewed. Total kidney volume (TKV), as measured by MRI, is suggested as important potential marker to determine disease progression and overall prognosis. Renal blood flow (RBF) and a novel approach to interpreting non-cystic renal parenchymal by CT images are other innovative imaging approaches described.
Keywords: polycystic kidney disease, image, potential marker
Introduction
Autosomal dominant polycystic kidney disease (ADPKD) is the most common inherited renal disorder occurring in 1:400–1:1,000 live births. ADPKD is a heterogenetic disorder, caused by mutations in at least two known genes, PKD1 and PKD2, and is characterized by gradual renal cyst development and expansion ultimately resulting in massive kidney enlargement and end stage renal disease (ESRD). ADPKD is a systemic disorder with cysts occurring in the liver, and less frequently in the pancreas, spleen, thyroid and the subarachnoid space. Other extra-renal manifestations in ADPKD include the development of intracranial aneurysms, diverticular disease and inguinal hernias 1.
ADPKD is relatively oligosymptomatic during the first three decades of life and renal insufficiency usually does not develop until the 4th decade. However, significant disease progression due to renal cyst formation and expansion occurs during this time. Although cystic development and expansion occur, the majority of patients with ADPKD maintain normal kidney function during cyst elargment. Once serum creatinine concentration has risen above the normal range, extensive irreversible replacement of renal parenchyma due to cysts and pericystic fibrosis has occurred. Importantly, utilizing accurate and reliable imaging techniques that monitor cyst growth is critical to predict the outcome of and associated complications of ADPKD. Therefore, renal imaging is important not only from a diagnostic standpoint, but also with regard to monitoring disease progression in ADPKD. We will now review the recommended diagnostic radiologic approaches as well as standardized and innovative imaging modalities used for monitoring disease progression and severity in ADPKD.
Imaging to Obtain a Diagnosis of ADPKD
Mutations on at least two genes are responsible for ADPKD. In 85% of individuals, mutations in the PKD1 gene on chromosome 16 (16p13.3-p13.1) are causative; most of the rest are caused by mutations in the PKD2 gene on chromosome 4 (4q21-q23)2. The mutations in PKD1 or PKD2 set into motion a complex array of molecular processes due to abnormal polycystin 1–2 complex function that ultimately lead to the aberrant proliferation of tubular epithelia cells, the expansion of the tubular lumen and the formation of peri-tubular cysts3. Although the clinical presentations of PKD1 and PKD2 patients are similar, PKD1 mutations cause more renal cysts and earlier-onset of hypertension, renal failure and death than PKD2 mutations 3, 4. Therefore diagnostic criteria utilizing radiological imaging differ for individuals who carry PKD1 vs. PKD2 mutations.
Although genetic testing can be performed in ADPKD, renal imaging remains the preferred method of diagnosis. The accuracy of sequence analysis of both PKD1 and PKD2 genes approaches 88% in specialized centers 5, 6, which provide a significantly lower detection rate than ultrasonographic imaging. Importantly, in those individuals who are less than 15 years of age, the relative accuracy of genetic testing vs. ultrasonographic imaging is similar for screening PKD1 individuals and better in PKD2 individuals 7. Therefore, if imaging studies are negative in at risk (either parent has known ADPKD) individuals in this age group further genetic testing could be considered to confirm a diagnosis.
The presence of multiple renal cysts is required for a diagnosis of ADPKD. The number of cysts required for a diagnosis is age-based and increases in an age dependent manner given that simple acquired renal cysts occur with increasing frequency with age in the general population4. Ultrasonography, computed tomography (CT) and magnetic resonance imaging (MRI) are all used to detect renal cysts; CT and MRI demonstrate greater resolution and increased sensitivity for detecting renal cysts less than one centimeter in diameter. However, due primarily to cost, level of radiation and contrast exposure, ultrasound is the initial imaging modality of choice for diagnosing ADPKD in the majority of patients. Disease penetrance of ADPKD is high and ultrasound provides an overall sensitivity and specificity of 99% and 95% by age 30 for PKD1 individuals 1, 4, 5. Given that patients with PKD2 mutations usually associate with less severe disease, they tend to be under-diagnosed when utilizing Ravine’s criteria6. Recently Pei and co-workers modified ultrasound criteria for a diagnosis of ADPKD, which unify the criteria for PKD1 and PKD2 mutations and effectively reduces false negative rates for diagnosis6. Currently criteria require the presence of three or more renal cysts, either unilateral or bilateral, for establishing the diagnosis for at risk individuals 15 to 39 years; four (two or more cysts in each kidney) for individuals 40 to 59 years; and eight (four or more cysts in each) for individuals who are 60 years or older6. Conversely, fewer than two renal cysts in at-risk individuals 40 years or older is sufficient to exclude ADPKD6. In addition, the presence of liver cysts, which are present in over 85% of ADPKD patients by the age of 30, can provide diagnostic confirmation, particularly in those without a positive family history of ADPKD 7. (Table 1) (Figure 1)
Table 1.
| Pedatric study | age range | subtype | False Negative (%) | False Positive (%) | sensitivity (%) | specificity (%) |
|---|---|---|---|---|---|---|
| (Gabow et al., 1997 8) | 3 months–5yr | PKD1 | 38 | 11 | 62 | 89 |
| 5yr–10yr | PKD1 | 19 | 0 | 82 | 100 | |
| 10yr–15yr | PKD1 | 23 | 0 | 86 | 100 | |
| 15yr–17.5yr | PKD1 | 22 | 0 | 67 | 100 | |
| All children | PKD1 | 25 | 2 | 77 | 98 |
| Age range | subtype | Criteria | Sensitivity (%) | NPV (%) | PPV (%) | |
|---|---|---|---|---|---|---|
| Adult ultrasound disgnostic criteria (Ravie et al., 1994 4) | 15–29 | PKD1 | ≥1 cyst | 96.2 | 100 | 96.6 |
| ≥2 cysts | 96.2 | 100 | 96.6 | |||
| ≥ 2 cyst in one kidney, ≥ 1 cyst in the other | 88.5 | 100 | 90.5 | |||
| ≥ 2, bilateral | 84.6 | 100 | 87.7 | |||
| ≥4 bilateral | 80.8 | 100 | 85.1 | |||
| 30–59 | PKD1 | ≥1 cyst | 100 | 97.7-45.5 | 100 | |
| ≥2 cysts | 100 | 99.2-61.2 | 100 | |||
| ≥ 2 cyst in one kidney, ≥ 1 cyst in the other | 100 | 99.2-85.2 | 100 | |||
| ≥ 2, bilateral | 100 | 100-90.7 | 100 | |||
| ≥ 4 bilateral | 100 | 100-96.9 | 89.9–100 | |||
| Adult unified criteria for both PDK1&2 (Pei et al., 2008 6) | 15–29 | PKD1 | ≥1 cyst | 99.1 | 99.1 | 97.5 |
| PKD2 | 79.1 | 83.5 | 95.6 | |||
| PKD1 | ≥ 2 cysts | 98.1 | 98.3 | 98.7 | ||
| PKD2 | 71.9 | 79.7 | 100 | |||
| PKD1 | ≥ 3 cysts | 94.3 | 94.8 | 100 | ||
| PKD2 | 69.5 | 78.0 | 100 | |||
| 30–59 | PKD1 | ≥ 2 cysts in each kidney | 93.3-92.6 | 95.4–97.5 | 100 | |
| PKD2 | 75.8–88.8 | 81.6–92.3 | 100 | |||
| PKD1 | ≥1 cyst | 100 | 100 | 94.8-84.5 | ||
| PKD2 | 96.7–100 | 96.8–100 | 93.5-92.3 | |||
| PKD1 | ≥ 2 cysts | 98.2–100 | 98.7–100 | 98.2-95.5 | ||
| PKD2 | 94.9–100 | 95.4–100 | 97.7-97.2 | |||
| PKD1 | ≥ 3 cysts | 96.6–100 | 97.6–100 | 95.7–100 | ||
| PKD2 | 94.9–95.6 | 95.4–96.8 | 97–100 |
Ravine Critera (1994)4 and unified Criteria (2008)6 were presented in boldface. For patients age 60+, both Revine and unified critera stated 4 cysts in each kidney is required for diagnosis. Unified criteria also stated <2 cysts in individuals aged 40+ is sufficient to excluded the diagnosis of ADPKD.
Figure 1.
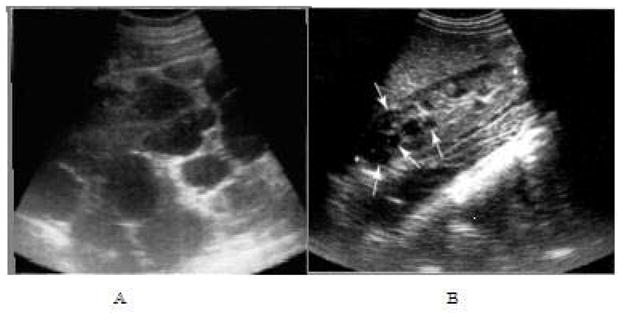
Ultrasound images of ADPKD. Longitudinal view of right mid-kidney of an advanced case (A), with the poles extending well beyond the image. Innumerable cysts of varying size and shape are present with very little intervening parenchyma. Longitudinal images of right kidney of a child with early, mild changes (B). Several small cysts are present (arrows) and there is a reduction in sinus fat due to expansion of the cortex.
Ultrasound screening for a diagnosis of ADPKD in 106 PKD1 children diagnosed by gene linkage analysis demonstrated a 25% false positive screening rate and a 38% false negative rate in those less than 5 years of age8. Whether other imaging modalities can provide a more accurate detection rate in this age group remains to be determined. Both CT and MRI methods have greater sensitivity compared to ultrasonography for detecting cysts less than one centimeter in diameter and most likely will have enhanced diagnostic capabilities in this age group7, 9. However, if MRI or CT imaging is to be used to establish diagnostic criteria for ADPKD, separate and new criteria would be required9. T2-weighted MRI is specially suited for producing high resolution images of fluid filled renal cysts and is not associated with radiation exposure that accompanies CT examinations. In addition, simple and complex cysts (Figure 2) can be easily differentiated on T1-weighted and T2-weighted MRI images without gadolinium exposure1.
Figure 2.
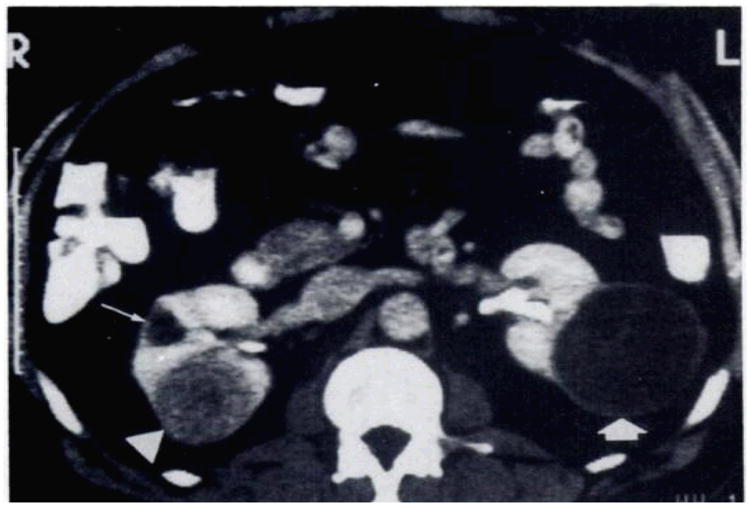
Kidney with simple and complex cyst. Contrast material-enhanced-CT scan shows a poorly enhancing solid leison (arrowhead) on the posterior aspect of the right kidney and a small simple cyst (long arrow) anteriorly. The large cystic mass (thick arrow) on the posterolateral surface of the left kidney has a thick wall and numberous septa and is therefore considered indeterminate. Fluid in the cystic compartment of the lesion remained at water density.34
Imaging to assess disease severity and progression in ADPKD
Although ultrasound is currently the imaging modality of choice for a diagnosis of ADPKD, its utilization for assessing disease progression is limited. Ultrasonography is highly operator-dependent and produces images that are less sensitive and reproducible than CT or MRI. In addition, ultrasound cannot reliably detect small but significant changes in kidney size or small cysts that are less than one centimeter in diameter. Ultrasound based measurements of kidney volume are calculated by utilizing parameters based on a modified ellipsoid formula. Formulas currently tested and published utilizing this approach include the following:
| 10,11 |
| 12 |
Problems related to the use of the ellipsoid formula include inter-operator variability when determining the maximal anterior-posterior diameter, the variability induced by patient respiration, and the lack of uniform cyst expansion throughout the kidney in ADPKD making the ellipsoid a less than perfect estimation of size. The contributions of these variables typically result in an overall underestimation of kidney volume. Importantly, if one applies the same ellipsoid formula utilizing MRI images to estimate kidney volume in ADPKD, a similar underestimation of kidney volumes occurs in comparison to volume measurements utilizing stereological methodology or voxel counting10. These findings suggest that the ellipsoid formula itself contributes significantly to the inaccuracy of the ultrasound method in estimating kidney volume in ADPKD10.
Kidney volume estimates using ellipsoid-based ultrasonographic methods vs. MRI using stereological methods in healthy volunteers demonstrated a 25% underestimation of total kidney volume10. Correlations of ultrasound and MRI estimates of kidney volume in ADPKD patients with relatively intact renal function are highly significant (r= 0.89)13. However, reproducibility or the coefficient of variation differs greatly with 21%–35% for ultrasound vs. 2.1–2.5% for MRI. Kidney length was the most reproducible measurement using ultrasound13.
The earliest determinations of kidney volume in patients with ADPKD have been performed by CT14. In this method, kidney volume was measured by an integral method, completed by measuring the surface area of contiguous 13 mm CT slices followed by a summation volume estimate. Significant increases in kidney volume were found in ADPKD patients compared to unaffected controls regardless of renal function14 with more reproducible measurements of kidney volume obtained by CT vs. ultrasound15. CT imaging has similar accuracy and reliability coefficients to MRI and can be acquired relatively faster than MRI. CT is also better than ultrasound when evaluating complicated renal cysts and nephrolithiasis. However, disadvantages of CT include ionizing radiation and exposure and the use of nephrotoxic contrast agents. Given these limitations CT has had a limited role in diagnostic or longitudinal imaging in ADPKD1.
The Consortium of Radiologic Imaging Studies of PKD (CRISP) is a prospective, longitudinal study of kidney and cyst volume progression in patients with ADPKD using high-resolution magnetic resonance imaging (MRI) 16. Qualified patients who had GFR ≥ 70 ml/min/1.73m2 underwent standardized annual MRI kidney imaging, iothalamate clearance and comprehensive clinical evaluations. Total kidney volumes were measured from T1-weighted images and region-growing thresholds were used from T2-weighted images to determine cyst volume16. During the initial protocol development for image acquisition to determine kidney volume, ex-vivo phantoms for small and large kidneys were developed using materials that are close to the density of renal parenchyma and cyst fluid were created. These phantoms were then used to determine repeat scanning variability, inter and intra observer variability with regard to calculation of total kidney volume. Finally the phantoms and four individuals were tested on a repeat basis in MR scanners from different manufacturers. Importantly the error of measurement and coefficients of variation were extremely low in these studies indicating that MR could accurately and reliably measure total kidney volume in cystic kidneys.
Measuring cyst volume is more difficult compared to total kidney volume1. Due to the irregular shape and enormous number of cysts, only CT/MRI methods using the integral or voxel counting method can accurately measure cyst volume. Reliability coefficients for MR renal and cyst volume measurements were 99.9% and 89.2%, respectively16. New techniques in the future may allow measuring cyst volume or observing intact renal parenchyma on an easy setting.
Because renal cysts form in utero and grow throughout life, kidney enlargement is suggested as a potential bio- or surrogate marker for disease progression and overall prognosis. Although ultrasonography is important for screening and diagnosing ADPKD, the variability of its measurement makes it a less preferred method to monitor disease progression1. However, monitoring disease progression longitudinally in ADPKD using ultrasonound longitudinally has been successful in large numbers of adults and children with ADPKD followed over a long period of time. In these studies, children were followed over a period of eight years and unilateral involvement was initially reported in 17% 17 with a curvilinear growth of kidney size fund in affected children18. The plotted exponential curves demonstrated that kidney volumes increased faster in affected children than in age matched unaffected children; and that disease progression tended to accelerate over time. For affected children with disease diagnosed in the first year of life or in utero, and hypertensive children, kidneys grew significantly faster than other affected children. Gender had no obvious affect on kidney growth in ADPKD children. In this and another study of adult PKD patients 12, it was noted that kidney volume of affected children (growth rate=~10.3% per year)17 was faster than adults (growth rate=8.2% per year)12. Although these investigations were based on ultrasound images, the relative large population (pediatric study n=182, adults study n=229) and long interval between each measurements diminished major potential errors and allowed for insight from these studies.
CT has also been an effective tool to follow disease progression and change in kidney volume. Two early studies that employed serial CT demonstrated that kidney growth rate is highly variable (4.0% to 9.4% per year) 12, 17 with a positive correlation between faster growth and the decline of eGFR15, 19. In addition, interventional trials have utilized CT and kidney volume estimates reliably to determine the efficacy of octreotide20.
The findings of CRISP reported that total kidney volume was modestly and inversely correlated with GFR21. Total kidney volume increased at a rate of 5.3% and total cyst volume by 12.0% per year. Cystic expansion occurred at a consistent rate within individuals with a high level of inter-individual variability. PKD1 patients demonstrated significantly larger kidney volumes, but with a similar rate of kidney growth between PKD1 and PKD2 (PKD1 5.68%/yr; PKD2 4.82%/yr)21. More cysts were detected in age matched PKD1 kidneys vs. PKD2 kidneys accounting for the differences seen in total kidney volume and patient outcomes.(Figure 3) The overall prevalence of hepatic cysts was 83% (85% female and 79% males) which directly correlated to renal and kidney volume22. Hepatic cysts increased in size and frequency with age, for instance, over 94% of patients 35 years and older demonstrating involvement. Importantly, hepatic cyst volume was significantly greater in women vs. men (Figure 4).
Figure 3. Coronal T2-weighted, single-shot fast spin echo magnetic.
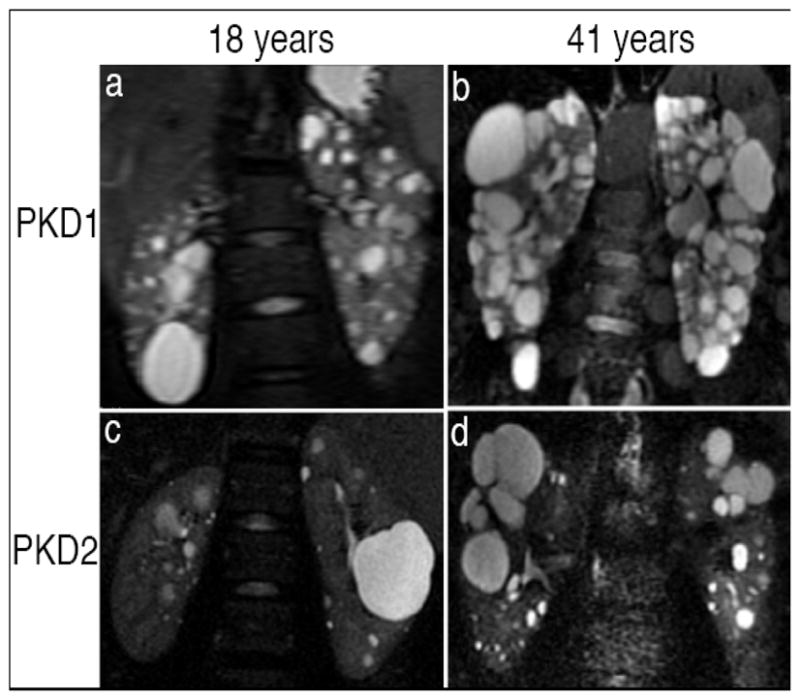
resonance images from patients with PKD1 (a and b) and PKD2 (c and d) at 18 yr (a and c) and 41 yr (b and d). Renal cysts in PKD1 are more numerous, diffusely distributed, and heterogeneous in size than those in PKD2. 21
Figure 4.
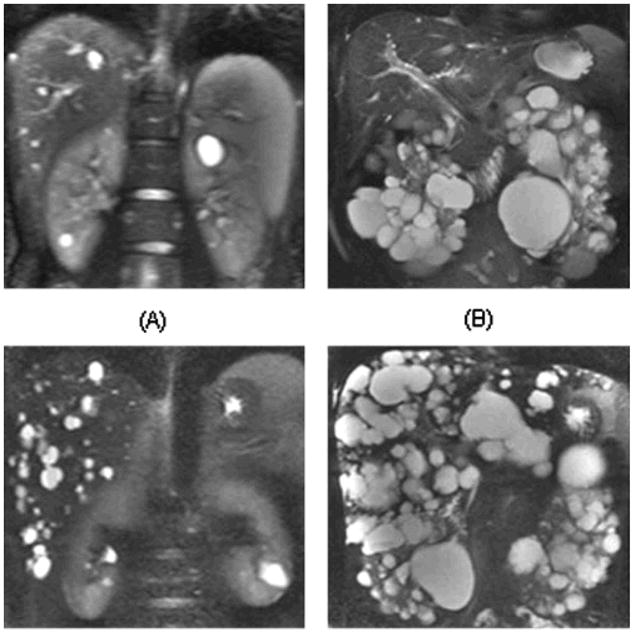
Coronal T2-weighted magnetic resonance imaging (MRI) from four different patients with variable severity of hepatic and renal cysts. Patient A is a 24-yr-old man with mild degree of hepatic cysts (a total volume of 6.3 ml) and renal cysts (15.4 ml). Patient B is a 46-yr-old man with mild hepatic cyst (9.3 ml) but severe renal cyst burden (1940 ml). Patient C is a 44-yr-old man has moderately severe degree of hepatic cysts (318.7 ml) but mild renal cyst burden (37.6 ml). Patient D is a 30-yr-old woman with severe degree of hepatic cysts (2368.8 ml) and renal cysts (1084.5 ml). 22
During the initial CRISP studies, gadolinium was used to enhance the visualization of renal parenchyma. Although no cases of nephrogenic systemic fibrosis have been reported in this cohort, given the investigational nature of these studies, subsequent imaging protocols have been refined and no longer include gadolinium23.
Potential new imaging modalities in ADPKD
Activation of the renin-angiotensin aldosterone system and decreases in renal blood flow are thought to contribute to the pathogenesis of hypertension in ADPKD24, 25. Classical measurements of renal blood flow (RBF) as measured by para-aminohippurate (PAH) clearance have been performed in ADPKD patients26. These measures are accurate but still limited due to the logistical difficulties of continuous administration of PAH and inadequate estimation of PAH extraction by the renal tubules in cystic kidneys. Alternatively, RBF can be quantified utilizing breathheld magnetic resonance imaging. A blood flow validation study in phantoms and healthy controls demonstrated a high reliability of quantitative RBF measured by breath-held velocity encoded MRI27. MRI measurements were compared with known measured flow rates in controlled-flow-loop phantoms using pulsatile flow and measurements with prospective and retrospective gating methods. Deviation from true flow was consistently below 13% for vessel diameters 3 mm and greater. Reproducibility in six healthy volunteers, comparing immediate rescan, repetition of the scan plane scouting, and week-to-week variation showed small levels of variability. The standard deviation of in vivo measurements of RBF in normal subjects was 59.7 mL/min or 10.5%. Comparison of RBF reproducibility with and without gadolinium contrast showed no significant differences in mean or standard deviation.
RBF measurements performed as part of the CRISP study indicated RBF can be accurately and reproducibly measured by MRI over a short period28. The imaging protocols used in CRISP to determine RBF included a two dimensional cine phase-contrast breath-hold pulse sequence after obtaining renal artery diameters perpendicular to the renal arteries with flow rates29. RBF was significantly associated with disease progression in the CRISP population30. While renal and cystic volume increased over 3 years, RBF decreased and eGFR remained stable. Renal vascular resistance was negatively and RBF positively correlated with eGFR slopes. The RBF reduction found in CRISP paralleled total kidney volume increase, preceded eGFR decline and independently predicted disease progression. These findings suggest that RBF utilizing MR based methodologies may be a novel predictive marker for disease progression in ADPKD.
Although disease progression in ADPKD is characterized by enlargement of renal cysts and gradual loss of kidney function, all current observations demonstrate relatively weak correlation between renal/cystic volumes vs. eGFR change. In CRISP, age-adjusted renal (r = −0.31, P < 0.0001), cyst (r = −0.36, P < 0.0001), and percentage cyst volume (r = −0.35, P < 0.0001) were inversely related to eGFR. Often there are individuals with extremely large exophytic cysts with completely normal kidney function or individuals with relatively small kidneys but with cysts throughout the medulla and parenchyma with progressive renal insufficiency. Especially when cysts tend to “hang” on the cortical edges of the kidney, grow outward and leave a major portion of the renal parenchyma intact, discordance between kidney structure and function appear. In 2006, a novel approach to interpret CT images from PKD patients indicated that potential novel morphological markers other than total kidney or cyst volume31.
Based on an interventional study32, CT scans of participants in the placebo arm were enhanced then analyzed by a histogram-based statistical approach known as otsu’s thresholding. In addition to differentiation between fluid-filled cysts and kidney tissue a third compartment among all patients, where the intensity was between cysts and renal parenchyma, approximately 100 Hounsfield, was referred as the “intermediated volume”. (Figure 5) Although renal and cystic volume failed to provide a strong correlation with change in kidney function, the “intermediate volume” demonstrated a significant association with change in GFR over a relatively short period of 6 months (duration of the study). The ratio between intermediate volume over parenchyma (Vint/Vpar %) plotted against baseline GFR (r=−0.81, p<0.001) and 6 months later (r=−0.80, p<0.005); the percentage changes of intermediate volume vs. percentage changes in GFR at the 6 months follow up (r=−0.70, p<0.01); and the ratio between change in intermediate volume/baseline parenchyma (ΔVint/Vpar %) vs. change in GFR (r=−0.75, p<0.005) were all highly significant.
Figure 5.

Representative computed tomography (CT) image before (A) and after (B) the application of anisotropic diffusion. (C) Image volume histogram and segmentation thresholds (F, fat; C, cysts; I, intermediate; P, parenchyma). (D) Segmented kidney tissue components.31
Despite the small number of participants (n=13) and short period of follow-up (6 months), intermediate volume may more accurately reflects change of kidney function, and be a potentially important marker that predicts disease progression in ADPKD. Intermediate volume may represent regions of impaired contrast uptake as a result of localized low blood flow or filtration. Alternatively atrophic or dilated tubules and fibrotic lesions may represent this component of renal parenchyma.
Summary
In summary, imaging plays a central role in the diagnosis, prognostic staging and management of patients with ADPKD. Currently ultrasound provides the most cost-effective and reliable approach to diagnosing at –risk individuals with ADPKD. However, for monitoring disease progression over short periods of time, more accurate and reliable measures of total kidney volume such as MRI play are more appropriate imaging approaches. Novel imaging assessments of reductions in RBF utilizing MRI or decreased enhancement of intermediate, non-cystic renal parenchyma utilizing CT may improve the identification of ADPKD individuals at greater risk for progression to ESRD.
Footnotes
Publisher's Disclaimer: This is a PDF file of an unedited manuscript that has been accepted for publication. As a service to our customers we are providing this early version of the manuscript. The manuscript will undergo copyediting, typesetting, and review of the resulting proof before it is published in its final citable form. Please note that during the production process errors may be discovered which could affect the content, and all legal disclaimers that apply to the journal pertain.
References
- 1.Bae KT, Grantham JJ. Imaging for the prognosis of autosomal dominant polycystic kidney disease. Nat Rev Nephrol. 2010;6:96–106. doi: 10.1038/nrneph.2009.214. [DOI] [PubMed] [Google Scholar]
- 2.Grantham JJ. Clinical practice. Autosomal dominant polycystic kidney disease. N Engl J Med. 2008;359:1477–1485. doi: 10.1056/NEJMcp0804458. [DOI] [PubMed] [Google Scholar]
- 3.Harris PC, Torres VE. Polycystic kidney disease. Annu Rev Med. 2009;60:321–337. doi: 10.1146/annurev.med.60.101707.125712. [DOI] [PMC free article] [PubMed] [Google Scholar]
- 4.Ravine D, Gibson RN, Walker RG, et al. Evaluation of ultrasonographic diagnostic criteria for autosomal dominant polycystic kidney disease 1. Lancet. 1994 Apr 2;343(8901):824–7. doi: 10.1016/s0140-6736(94)92026-5. [DOI] [PubMed] [Google Scholar]
- 5.Nicolau C, Torra R, Badenas C, et al. Autosomal dominant polycystic kidney disease types 1 and 2: assessment of US sensitivity for diagnosis. Radiology. 1999;213:273–6. doi: 10.1148/radiology.213.1.r99oc05273. [DOI] [PubMed] [Google Scholar]
- 6.Pei Y, Obaji J, Dupuis A, et al. Unified criteria for ultrasonographic diagnosis of ADPKD. J Am Soc Nephrol. 2009 Jan;20(1):205–12. doi: 10.1681/ASN.2008050507. Epub 2008 Oct 22. [DOI] [PMC free article] [PubMed] [Google Scholar]
- 7.Wołyniec W, Jankowska MM, Król E, et al. Current diagnostic evaluation of autosomal dominant polycystic kidney disease. Polskie Archiwum Medycyny Wewnetrznej. 2008 Dec;118(12):767–73. [PubMed] [Google Scholar]
- 8.Gabow PA, Kimberling WJ, Strain JD, et al. Utility of ultrasonography in the diagnosis of autosomal dominant polycystic kidney disease in children. Journal of the American Society of Nephrology. 1997 Jan;8(1):105–10. doi: 10.1681/ASN.V81105. [DOI] [PubMed] [Google Scholar]
- 9.Nascimento AB, Mitchell DG, Zhang XM, et al. Rapid MR imaging detection of renal cysts: age-based standards. Radiology. 2001 Dec;221(3):628–32. doi: 10.1148/radiol.2213010178. [DOI] [PubMed] [Google Scholar]
- 10.Bakker J, et al. Renal volume measurements: accuracy and repeatability of US compared with that of MR imaging. Radiology. 1999;211:623–628. doi: 10.1148/radiology.211.3.r99jn19623. [DOI] [PubMed] [Google Scholar]
- 11.Bakker J, Olree M, Kaatee R, et al. In vitro measurement of kidney size: Comparison of ultrasonography and MRI. Ultrasound Med Biol. 1998;24:683–688. doi: 10.1016/s0301-5629(97)00212-3. [DOI] [PubMed] [Google Scholar]
- 12.Fick-Brosnahan GM, Belz MM, McFann KK, et al. Relationship between renal volume growth and renal function in autosomal dominant polycystic kidney disease: a longitudinal study. Am J Kidney Dis. 2002;39:1127–1134. doi: 10.1053/ajkd.2002.33379. [DOI] [PubMed] [Google Scholar]
- 13.O’Neill wC, et al. Sonographic assessment of the severity and progression of autosomal dominant polycystic kidney disease: the Consortium of Renal Imaging Studies in Polycystic Kidney Disease (CRISP) Am J Kidney Dis. 2005;46:1058–1064. doi: 10.1053/j.ajkd.2005.08.026. [DOI] [PubMed] [Google Scholar]
- 14.Thomsen HS, Madsen JK, Thaysen JH, Damgaard-Petersen K. Volume of polycystic kidneys during reduction of renal function. Urol Radiol. 1981;3:85–89. doi: 10.1007/BF02927815. [DOI] [PubMed] [Google Scholar]
- 15.Sise C, Kusaka M, Wetzel LH, et al. Volumetric determination of progression in autosomal dominant polycystic kidney disease by computed tomography. Kidney Int. 2000;58:2492–2501. doi: 10.1046/j.1523-1755.2000.00433.x. [DOI] [PubMed] [Google Scholar]
- 16.Chapman AB, et al. Renal structure in early autosomal-dominant polycystic kidney disease (ADPKD): The Consortium for Radiologic Imaging Studies of Polycystic Kidney Disease (CRISP) cohort. Kidney International. 2003;64:1035–1045. doi: 10.1046/j.1523-1755.2003.00185.x. [DOI] [PubMed] [Google Scholar]
- 17.Fick-Brosnahan G, Johnson AM, Strain JD, Gabow PA. Renal asymmetry in children with autosomal dominant polycystic kidney disease. Am J Kidney Dis. 1999;34:639–645. doi: 10.1016/S0272-6386(99)70387-2. [DOI] [PubMed] [Google Scholar]
- 18.Fick-Brosnahan GM, Tran Zv, Johnson AM, Strain JD, Gabow PA. Progression of autosomal-dominant polycystic kidney disease in children. Kidney Int. 2001;59:1654–1662. doi: 10.1046/j.1523-1755.2001.0590051654.x. [DOI] [PubMed] [Google Scholar]
- 19.King BF, Reed JE, Bergstralh EJ, Sheedy PF, Torres VE. Quantification and longitudinal trends of kidney, renal cyst, and renal parenchymal volumes in autosomal dominant polycystic kidney disease. JAm Soc Nephrol. 2000;11:1505–1511. doi: 10.1681/ASN.V1181505. [DOI] [PubMed] [Google Scholar]
- 20.Ruggenenti P, et al. Safety and efficacy of longactingsomatostatin treatment in autosomal dominant polycystic kidney disease. Kidney Int. 2005;68:206–216. doi: 10.1111/j.1523-1755.2005.00395.x. [DOI] [PubMed] [Google Scholar]
- 21.Harris PC, Bae KT, Rossetti S, et al. Cyst number but not the rate of cystic growth is associated with the mutated gene in autosomal dominant polycystic kidney disease. Journal of American Society of Nephrology. 2006;17:3013–3019. doi: 10.1681/ASN.2006080835. [DOI] [PubMed] [Google Scholar]
- 22.Bae KT, Zhu F, Chapman AB, et al. Consortium for Radiologic Imaging Studies of Polycystic Kidney Disease (CRISP). Magnetic Resonance Imaging Evaluation of Hepatic Cysts in Early Autosomal-Dominant Polycystic Kidney Disease: The Consortium for Radiologic Imaging Studies of Polycystic Kidney Disease Cohort. Clinic Journal of American Society of Nephrology. 2006;1:64–69. doi: 10.2215/CJN.00080605. [DOI] [PubMed] [Google Scholar]
- 23.Chapman AB. Approaches to Testing New Treatments in Autosomal Dominant Polycystic Kidney Disease: Insights from the CRISP and HALT-PKD Studies. Clin J Am Soc Nephrol. 2008;3:1197–1204. doi: 10.2215/CJN.00060108. [DOI] [PubMed] [Google Scholar]
- 24.Chapman AB, Johnson A, Gabow PA, Schrier RW. The Renin–Angiotensin–Aldosterone System and Autosomal Dominant Polycystic Kidney Disease. New England Journal of Medicine. 1990;323:1091–1096. doi: 10.1056/NEJM199010183231602. [DOI] [PubMed] [Google Scholar]
- 25.Watson ML, Macnicol AM, Allan PL, Wright AF. Effects of angiotensin converting enzyme inhibition in adult polycystic kidney disease. Kidney International. 1992;41:206–210. doi: 10.1038/ki.1992.28. [DOI] [PubMed] [Google Scholar]
- 26.Ulla B. Berg Differences in decline in GFR with age between males and females. Reference data on clearances of inulin and PAH in potential kidney donors. Nephrol ogy Dialysis Transplantation. 2006;21(9):2577–82. doi: 10.1093/ndt/gfl227. [DOI] [PubMed] [Google Scholar]
- 27.Dambreville S, Chapman AB, Torres VE, et al. Renal Arterial Blood Flow Measurement by Breath-Held MRI: Accuracy in Phantom Scans and Reproducibility in Healthy Subjects. Magn Reson Med. 2010;63(4):940–50. doi: 10.1002/mrm.22278. [DOI] [PMC free article] [PubMed] [Google Scholar]
- 28.King BF, Torres VE, Brummer ME, et al. Consortium for Radiologic Imaging Studies of Polycystic Kidney Disease (CRISP): Magnetic resonance measurements of renal blood flow as a marker of disease severity in autosomal dominant polycystic kidney disease type 1. Mol Hum Reprod. 2005;11:65–71. [Google Scholar]
- 29.King BF, Torres VE, Brummer ME, et al. Magnetic resonance measurements of renal blood flow as a marker of disease severity in autosomal-dominant polycystic kidney disease. Kidney International. 2003;64:2214–2221. doi: 10.1046/j.1523-1755.2003.00326.x. [DOI] [PubMed] [Google Scholar]
- 30.Torres VE, King BF, Chapman AB, et al. Magnetic resonance measurements of renal blood flow and disease progression in autosomal dominant polycystic kidney disease. Clin J Am Soc Nephrol. 2007 Jan;2(1):112–20. doi: 10.2215/CJN.00910306. [DOI] [PubMed] [Google Scholar]
- 31.Antiga Luca, Piccinelli Marina, Fasolini Giorgio, et al. Computed Tomography Evaluation of Autosomal Dominant Polycystic Kidney Disease Progression: A Progress Report. Clin J Am Soc Nephrol. 2006;1:754–760. doi: 10.2215/CJN.02251205. [DOI] [PubMed] [Google Scholar]
- 32.Ruggenenti P, Remuzzi A, Patriziaondel E, et al. Safety and efficacy of long-acting somatostatin treatment in autosomal-dominant polycystic kidney disease. Kidney International. 2005;68:206–216. doi: 10.1111/j.1523-1755.2005.00395.x. [DOI] [PubMed] [Google Scholar]
- 33.O’Neill WC. Atlas of renal Ultrasonography Decatur. Margonos Productions. 2006:94–95. [Google Scholar]
- 34.Marotti M, Hricak H, Fritzsche P, et al. Complex and simple renal cysts: comparative evaluation with MR imaging. Radiology. 1987;162:679–684. doi: 10.1148/radiology.162.3.3809481. [DOI] [PubMed] [Google Scholar]