Across the developed world, generous welfare state programs for the elderly, together with projected doublings or more in the proportion old, have led to political struggles that sometimes pit younger generations against the elderly. The goal of this chapter is to put the current situation in historical and institutional context. We begin with a brief review of research on hunter-gatherer groups, and then turn to substantive results for modern-day countries at different stages of economic development drawn from the National Transfer Accounts project, a large international collaboration.
Human hunter-gatherer offspring have an exceptionally long period of immaturity and nutritional dependency, lasting until around age 20 years, judging by studies of contemporary groups (Kaplan 1994; Hill and Hurtado 2009; Howell 2010). Adults at all ages up to around 70 years produced more calories than they consumed on average, contributing their surplus to feed the young. The modern demographic transition began many thousands of years after hunting and gathering had been displaced by agriculture as the dominant form of production technology and social organization. The demographic transition eventually led to a much-reduced proportion of children in the population and a very much increased proportion of elderly. Given the intergenerational transfer patterns of hunter-gatherers just described, including the net productivity of the elderly, one would have expected that population aging would relax the social budget constraint, as the ratio of adults to children soared. But a funny thing happened along the way: societies invented retirement, older people became increasingly dependent on younger adults, and the economic consequences of population aging are now viewed with alarm.
We explore the interaction of the transition’s changing population age distributions with the changing organization of the economic life cycle and with differing institutional arrangements. We draw on estimates by 23 country teams participating in the National Transfer Accounts project. (The researchers are identified and more detailed information is available for many countries in working papers on the NTA website: «www.ntaccounts.org».) We show that the direction of intergenerational transfers in the population has shifted from downward to upward, at least in a few leading rich nations. This sea change has resulted in part from the changing economic role of the elderly, which is closely tied to the rise of the welfare state and the increasing importance of assets, and in part from population aging brought about by the demographic transition. Despite the change in the net direction of resource flows, investment in health and education per child has risen relative to incomes, in association with fertility decline.
The degree to which these changes have occurred varies across levels of economic development, broad regions of the world, and the idiosyncratic institutions of particular countries. It is well known, however, that the systems of public transfers to the elderly as currently structured will not be fiscally sustainable as populations continue to age rapidly in the first half of the twenty-first century. Structural reforms will occur and in some cases have already been made, and the outcome is likely to be a reversal in the trend toward earlier retirement and related changes.
Theoretical background
A great deal of theory is relevant for interpreting patterns of intergenerational transfers, and here we briefly mention a few particularly relevant themes. Evolutionary theory explains the co-evolution of the long period of juvenile dependency, large brain, food acquisition strategy, short birth intervals, and long life, including a long post-reproductive life span during which elders provide support and food transfers for the young (Kaplan 1994; Kaplan and Robson 2002; Hawkes and Blurton Jones 2005; Hrdy 2009; Chu and Lee 2006; Lee 2003, 2008). Elders remained net producers until near death, transferring their surplus output to the young. Presumably our emotional apparatus evolved to motivate this behavior. This emotional apparatus is taken as given by economic theories of the family, which start with a utility function expressing parental affection for children, and a parental desire to invest in their children’s human capital. However, the altruism of parents toward their children is limited by a concern for their own consumption and well-being (Becker and Lewis 1973; Willis 1973; Becker and Barro 1988; Willis 1987; Nerlove, Razin, and Sadka 1987; Razin and Sadka 1995).
Within this basic framework, various patterns of intergenerational transfers can be generated by varying the institutional, technological, and cultural contexts (Willis 1987, 1994). When the rate of return to children’s human capital is low, parents choose to have more children while investing less in each. Once technological progress raises the rate of return to education, the limited altruism of parents can lead them to invest less than the optimal amount in their children’s education (Becker and Murphy 1988). When there are cultural or institutional means of compelling adult children to repay their elderly parents for earlier investments exceeding those motivated by altruism, then parents will invest more in children’s human capital as a loan, and be supported by them in old age. When such cultural and institutional supports are lacking, human capital investment may be too low, and then there is a role for the introduction of public education packaged with public-sector support of the elderly through pensions (ibid.).
It is central to these themes that parents choose a preferred balance of their own lifetime consumption and that of their children, a balance that reflects their limited altruism. If the public sector provides overly generous pension payments, for example, then elderly parents may partially offset the pensions by making larger private transfers to their grandchildren and adult children, perhaps as bequests at death or as inter vivos transfers: help with the mortgage on a house, or grandchildren’s education, for example. Similarly, private expenditures on education may be reduced when public education is introduced. In this way, public transfers may crowd out some private transfers but “crowd in” others.
Age profiles of labor income and consumption
Our starting point is estimated age profiles of labor income and consumption. These estimates are averages across males and females in the population at a given age. For labor income, individuals are counted whether they generate income or not. Income includes pretax wages and salaries, fringe benefits paid by the employer, income accruing to unpaid family labor, and two thirds of “mixed” or self-employment income (one-third is assumed to accrue to property or capital). Estimates derive from pre-existing surveys, and the levels of the estimated profiles are adjusted so that, taken together with the population age distribution, they are consistent with the totals given in National Income and Product Accounts (NIPA). (For further details, see Lee, Lee, and Mason 2008 and Mason et al. 2009.) For hunter-gatherer populations, labor income is estimated as average food calories acquired at each age, drawing on estimates by anthropologists (for details see Kaplan 1994 and Howell 2010).
The age profile of consumption is again an average of male and female consumption at each given age, and includes both private consumption and in-kind government transfers, most notably for public education, health care, and long-term care. In household surveys, private expenditures on health and education may be reported for individual household members or may be available only for the household as a whole, in which case they can often be reliably allocated by age. Other private expenditures for each household are allocated to individual household members using Equivalent Adult Consumer weights, which start at 0.4 for those age 4 and younger and rise to 1.0 for age 20 and above. The individual estimates are then tabulated to estimate the age profile of other private consumption. Estimated private expenditures on health, education, and other consumption are adjusted to be consistent with NIPA. (For details see Lee et al. 2008 and Mason et al. 2009.) For hunter-gatherers, total food production is calculated separately for each sharing group (which could be a collection of households or a larger group). It is then allocated to the individuals in the sharing group in proportion to standard caloric-need tabulations by age, sex, and sometimes body weight and level of physical activity (Kaplan 1994). Howell (2010) uses a variant of this approach.1
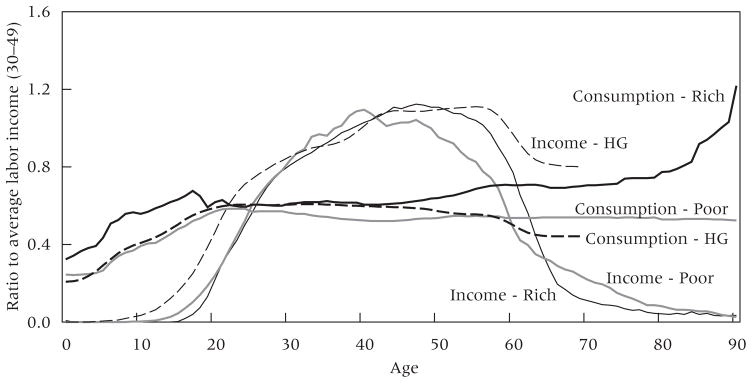
To facilitate comparison, we have formed an unweighted average of the Kaplan and Howell hunter-gatherer age profiles, which in any case are very similar. We have also made an unweighted average of the profiles for four of the lowest-income countries in our NTA collection: Kenya, Indonesia, Philippines, and India. Finally, we have formed an average of four of the richest countries in NTA: Japan, the United States, Sweden, and Finland. In order to make the shapes of the age schedules visually comparable, we adjusted the level by dividing by the average level of labor income across ages 30–49, chosen to be affected neither by educational enrollment nor by early retirement.2 The resulting age profiles are plotted in Figure 1.
FIGURE 1. The economic life cycle of hunter-gatherers (HG), poor agricultural populations, and rich industrial populations: Consumption and labor income (ratio to average labor income, ages 30–49).
NOTE: See text for method of construction and data sources.
We note, first, the close similarity between the hunter-gatherer consumption age schedule and that of the poor countries. Although there are some differences, such as the decline in consumption at older ages in the hunter-gatherer profile but not in the poor-country profile, these may well be due to differences in the methods and assumptions used to estimate these levels. For example, the caloric-need tables indicate a decline in old age whereas the equivalent adult consumer weights we use assume no change in adulthood. The slightly lower consumption schedule for hunter-gatherers, relative to the labor income schedule, reflects the higher fertility and younger age distribution among the Amazon Basin hunter-gatherers. The less favorable support ratio leads to lower consumption for all. In addition, hunter-gatherers have little or no non-labor income, and non-labor income in these estimated profiles is zero by construction.
The strongest contrast is between the consumption schedule for hunter-gatherers and poor countries, on the one hand, and the rich countries on the other. We note the strikingly higher level of child consumption up to the late teen years in the rich countries, reflecting primarily the heavy investment in education in these countries. We also note that in the rich countries, the level of consumption increases with age in the adult years, and is highest at the very highest ages. This increase is in large part attributable to the substantial expenditures on health care for the elderly, which rise with age and are largely funded by the public sector.3 At the highest ages, above 80 years, the rapid increase reflects the costs of long-term care. But publicly funded health care and long-term care are not the whole story. In the United States, at least, private consumption also rises with age until around age 60. It seems likely that this increase in private consumption with age reflects the separate living arrangements of the elderly in rich countries, and perhaps more fundamentally reflects a decline in private intergenerational sharing, in contrast to the poor and hunter-gatherer groups where private consumption is shared across ages within co-residential or sharing groups. These separate living arrangements are in turn fostered by the shift toward public transfers to the elderly.
The labor income schedules also reveal interesting differences. The relative contributions of teenagers are much greater in the hunting and gathering groups. It appears that the age schedule is similar in shape to the other groups but displaced three or four years to the left, indicating an earlier start. The poor countries also show greater labor contributions by children than the rich countries, but by a surprisingly small amount. We believe this smaller difference reflects low wages among young agricultural workers and the great importance of the nonagricultural labor force, which generally has much higher incomes and higher enrollment rates and therefore starts work later than in the agricultural areas. Preliminary estimates for some African countries suggest that rates of employment and labor income may also be very low for young adults who are not in school in urban settings.
We also note that labor income peaks around age 40 in the poor countries, at around 50 in the rich countries, and is quite flat among hunter-gatherers from ages 40 to 60. Labor income drops precipitously in the rich countries, particularly in the early 60s, reflecting retirement facilitated by pensions and motivated by the incentives for early retirement built into their structures (Gruber and Wise 1999) and an increase in the demand for leisure (Costa 1998). In poor countries, we also see an initial rapid decline, but then labor income continues well into the later years. This pattern may be the result of averaging together incomes of those in urban areas and the modern sector with those in rural areas where older people continue to work. Finally, we note the striking pattern for hunter-gatherers, who continue to work productively into old age. The data for the Amazon Basin groups include almost no one beyond age 70, but Howell reports that the !Kung continue to produce about the same amount as they consume up to around age 80 (Howell 2010, Figure 5.6).
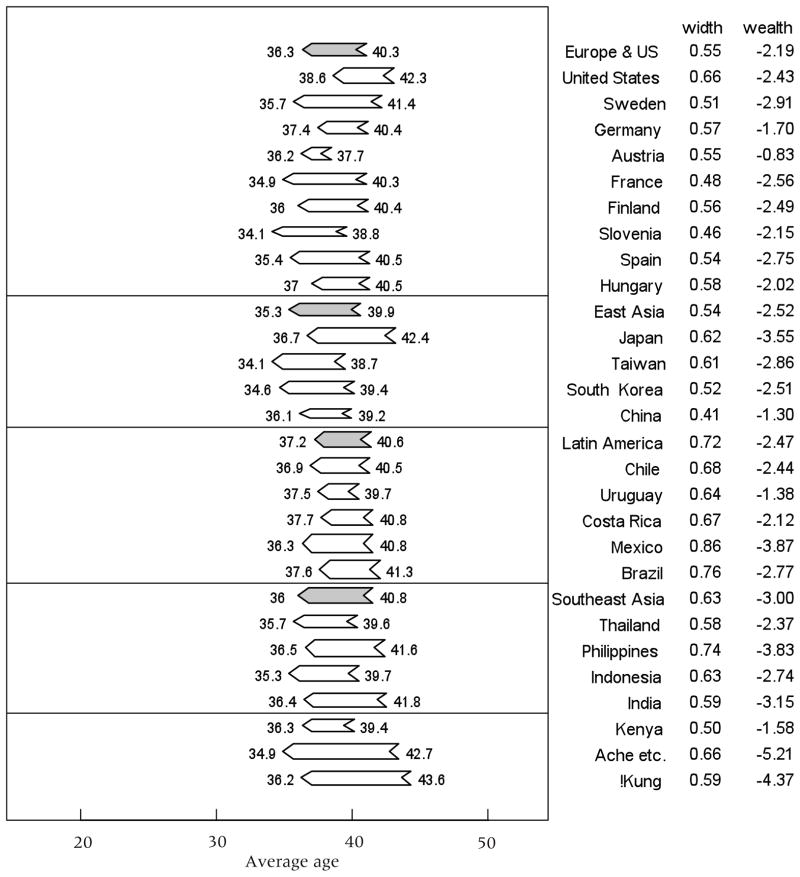
FIGURE 5. Average age of consumption (C) and labor income (Yl), using age distribution averaged across all countries.
NOTE: Arrow point is average age of C; arrow tail is average age of Yl; width is per capita C relative to average Yl over ages 30–49. Area within arrow is implied wealth. Within region, country order by ppp-adj avg GDP.
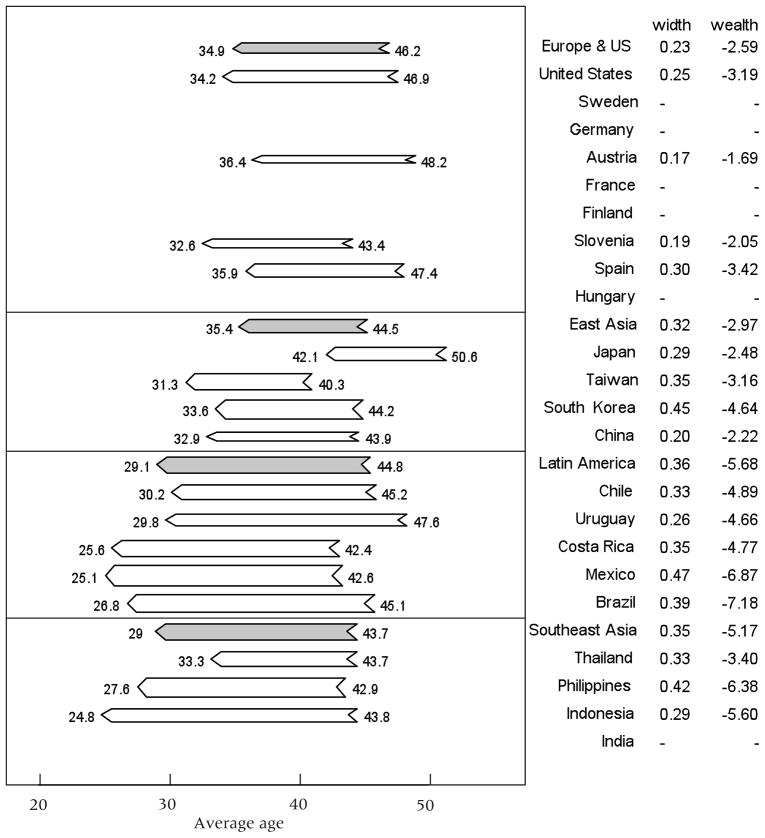
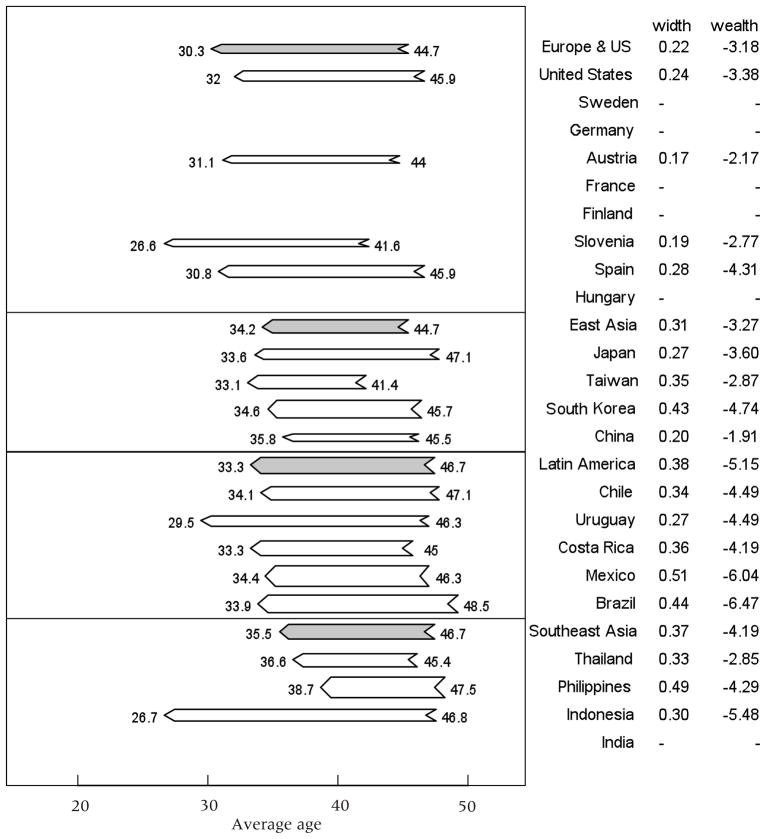
FIGURE 6. Average age of private transfer inflows (TFI) and private transfer outflows (TFO), using each country’s age distribution.
NOTE: Arrow point is average age of TFI; arrow tail is average age of TFO; width is per capita TFI relative to average labor income over ages 30–49. Area within arrow is implied wealth. Within region, country order by ppp-adj avg GDP.
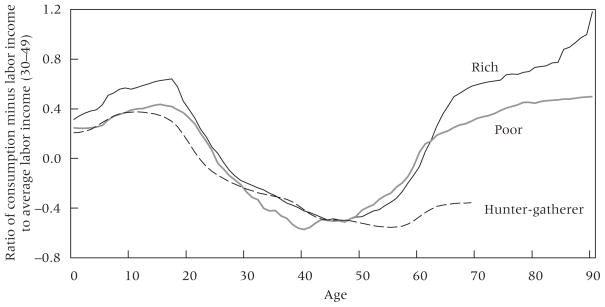
The net effect of these differences in the age schedules of consumption and labor income can be seen clearly by plotting consumption minus labor income, which we call the “life-cycle deficit,” or LCD. This is done for the three populations in Figure 2. The positive values indicate that more is consumed than is produced at those ages, hence the deficit is positive. The LCD is smaller for young hunter-gatherers because of their earlier productivity and the absence of market inputs for education, training, and health care. In all three populations, adults have a negative LCD, that is they produce more than they consume and reallocate the surplus to others. What is most noticeable, however, is that in the rich and poor countries, this adult LCD begins to move toward zero after age 45, and turns positive around age 60, whereas in the hunter-gatherer groups the LCD remains strongly negative until the end of observation at age 70 (after which it drops to zero in the !Kung data). This is driven in part by the reduction in labor income at older ages and in part by the increase in old-age consumption. In addition, consumption in rich countries is funded by asset income to a greater extent than in poor ones, which has shifted the consumption curve up relative to labor income. We also see that the LCDs in both childhood and old age have increased sharply over time and with development. These changes in the economic life cycle are central to understanding how intergenerational flows have evolved over the development process.
FIGURE 2. The life-cycle deficit (consumption minus labor income) of hunter-gatherers, poor agricultural populations, and rich industrial populations.
NOTE: See text for method of construction and data sources.
Before turning to this issue, we discuss a number of features of these estimates. The level of the LCD curve is governed by a social budget constraint—total outflows cannot exceed total inflows. Were labor income the only inflow and consumption the only outflow, the population-weighted sum of the LCD curve would necessarily equal zero and the level of the LCD curve in Figure 2 would depend only on population age structure. This is assumed to be the case in the construction of the profiles for hunter-gatherer populations. For contemporary economies, however, other economic mechanisms can be used to fund life-cycle deficits. First, the life-cycle deficit can be funded by relying on assets—using asset income or dissaving. Second, the LCD can be funded by relying on net transfers from abroad, that is, remittances and foreign aid. The higher levels of the LCD profiles for poor and rich countries, as compared with hunter-gatherer populations, reflect the increased reliance on assets by almost every contemporary population and reliance on net foreign transfers by many poor populations.4
Often in this chapter we refer to the “life cycle,” which suggests longitudinal patterns, but in fact all the estimates we present are cross-sectional, referring to different ages in the same calendar year. It is possible that cross-sections may affect some of the profiles’ features, particularly in populations experiencing rapid economic growth. For a number of countries we do have long series of these cross-sectional estimates from which longitudinal life cycles can be constructed, but we do not discuss these data here.
Probably the most serious shortcoming of the estimates is that they do not include the value of time spent in home production, other than standard measures of unpaid family labor and self-employment income. This means that we count consumption of market-provided education, health care, and long-term care, whether publicly or privately funded, but do not count the value of similar services provided privately by the family. Nor do we count the value of non-market time spent rearing children, preparing meals, cleaning, and other domestic tasks. Where data permit, it would be very useful to include time in our accounts, but our project resources have already been stretched to the limit in preparing the current version of the accounts. For an example of accounts including time, see the case of Thailand (Phananiramai 2008), early estimates for the United States (Lee and Lapkoff 1988), a study of Mayan subsistence agriculturalists (Lee and Kramer 2002), and a reanalysis of Cain’s data for a poor village in Bangladesh (Robinson, Lee, and Kramer 2008).
Life-cycle wealth and the direction and scale of generational flows
We have begun our analysis by considering the economic life cycle because intergenerational transfers and other generational flows are the counterpart of the life cycle. The purely cross-sectional perspective we have employed to this point is incomplete, however. It tells us how resources are being allocated between different generations at a point in time, but further analysis is needed to understand how features of the economic life cycle influence the allocation of resources across successive generations. This requires a generational perspective and for that reason we introduce two important concepts: life-cycle wealth and one of its components—transfer wealth.
To understand these concepts, consider first the relationship between the old-age life-cycle deficit and the demand for life-cycle wealth. In the absence of intergenerational transfers, individuals would have to accumulate assets during their working years on which they would rely during retirement. Per capita assets would rise with age and then at some point begin to decline. For the population as a whole the demand for per capita assets would depend on the asset profile that corresponds to the life-cycle deficit and the age distribution of the population.
The one-to-one relationship between the life-cycle deficit and the demand for assets is readily extended to include reliance on intergenerational transfers to fund the life-cycle deficit. During working years individuals contribute to a public transfer system and later, in retirement, they receive benefits. From the perspective of the individual, the transfer system is a form of wealth equal to the present value of benefits to be received in the future less payments to be made. Transfer wealth increases as an individual passes through the working years and then declines as he or she proceeds through retirement, drawing down lifetime benefits.
Transfer wealth is different from assets in a critical way. Assets are created through investment, raising the productive potential of an economy. Transfer wealth is purely a social obligation. There is no physical counterpart to transfer wealth, only a commitment to fulfill a social contract. For current retirees the obligation falls on those who are currently contributing. But for the current population, taken in its entirety, transfer wealth is an obligation borne by future generations. The counterpart of transfer wealth is implicit debt passed on to descendants.
Now consider the life-cycle deficit during childhood. By relying on transfers to fund the life-cycle deficit of children, we create an obligation on the part of the current population to provide resources to support current children and future generations (during their childhood). The present value of net transfers to future generations by the current population is equal to downward transfer wealth. Total transfer wealth is equal to the sum of downward transfer wealth—a negative value—and upward transfer wealth—a positive value. Depending on the relative magnitudes of these two values, transfer wealth is either positive or negative and future generations are gaining or losing from existing transfer systems.
Life-cycle wealth is the combined value of assets and transfer wealth. To explore the relationship between the economic life cycle and life-cycle wealth, we take into account the population age distribution so that we can view the scale and direction of flows in the aggregate population and economy. To do this, we multiply the population age distribution by the age profiles to calculate the aggregate consumption and labor income by age, and their difference, the aggregate LCD (in contrast to the per capita profiles in Figures 1 and 2). The information contained in these aggregate age profiles can be summarized using arrow diagrams that indicate the direction and distance across age of transfers and asset operations, and their volume or relative importance.
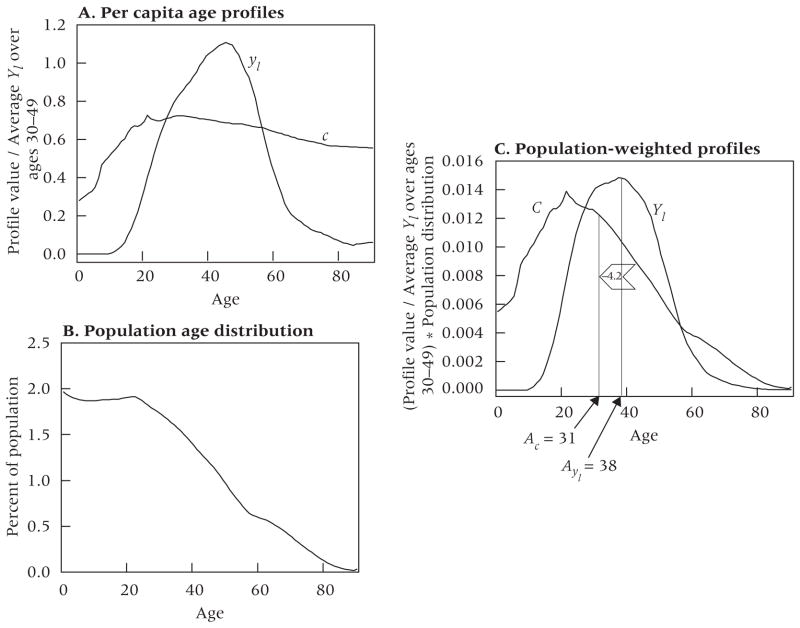
We illustrate the construction of these arrow diagrams for Indonesia in 2002 (Maliki forthcoming). Indonesia is one of the lowest-income countries in our collection, but in 2002 it was well along in the fertility transition with a TFR of about 2.6; 8.3 percent of its population was age 65 and over. Panel A of Figure 3 plots the per capita age profiles of consumption (c) and labor income (yl ). Panel B plots the population age distribution in 2002. Panel C plots the age profiles for aggregate consumption C(x) and labor income Yl(x), where x is age, obtained by multiplying the per capita values at each age by the population at that age. The simple sums across ages of these aggregate profiles shown in Panel C equal total consumption and total labor income as reported in the National Income and Product Accounts for Indonesia in 2002, by construction.
FIGURE 3. Illustration of arrow diagram construction for Indonesia (2002).
SOURCE: Data from Maliki (forthcoming).
Panel C shows the age at which each unit of consumption is consumed, and from this information we can calculate the age at which the average unit is consumed, and similarly for labor income. The average age of consumption is calculated by multiplying each age by the aggregate consumption at that age, summing these products over all ages, then dividing by the total amount of consumption at all ages. An equivalent calculation gives the average age of labor income.5 The results of these mean age calculations for Indonesia are indicated by vertical lines in Panel C. It is evident that these average ages abstract from a great deal of interesting information, reducing it to a single number, but we will see that these average ages are nonetheless useful and informative.
We then compare the average age of consumption, Ac, to the average age of labor income, Ayl. If every individual simply consumed 100 percent of his or her labor income at each age, then we would have c(x) = yl(x), C(x) = Yl(x), and therefore Ac = Ayl: the average ages would be identical. The same would be true if the aggregate deficit at young ages (C(x) – Yl(x)) were exactly offset by the deficit in old age. But neither of these situations is likely to occur. If Ac > Ayl, then the average unit of output is shifted upward from the lower age at which it was earned to the higher age at which it was consumed; and if Ac < Ayl, then the average direction of shifting is downward, from older to younger. If only a small amount of income is shifted, there will be only a small effect on the average age of consumption, and the average ages will still be close together.
In the case of Indonesia, Panel C indicates that Ac < Ayl. Indeed, the average age of consumption is 6.8 years younger than the average age of labor income. The arrow therefore points in the negative direction toward younger ages. The width of the arrow, equal to per capita consumption normalized by dividing by average labor income at ages 30–49, is equal to 0.61, that is per capita consumption is about 60 percent of the average labor income of a prime-age adult. The area of the arrow is −6.8 * .61 = −4.2. The interpretation is that over his/her remaining life, the average Indonesian in 2002 expects to consume less than he/she produces by an amount equal to 4.2 years’ worth of labor income (in survival-weighted present value). In this sense the average Indonesian holds negative transfer wealth: on average, labor income will be used to support children’s consumption in the future to a greater extent than the labor income of others or own assets will be used to support future consumption in old age.
The area of the arrow measures the demand for life-cycle wealth per capita (relative to average labor income) needed to achieve the consumption profile, given the labor income profile, under steady-state conditions with a discount rate equal to the growth rate of population plus the productivity growth rate. This was first shown by Willis 1988, and further developed in Lee 1994a.
The area of the arrow lumps together transfer wealth and asset wealth. In this chapter we largely ignore assets and concentrate on transfers and transfer wealth. Since actual populations and economies are unstable and non-steady-state, and since discount rates are generally different from the population growth rate plus productivity growth rate, the area of the arrow only approximates the demand for life-cycle wealth.6
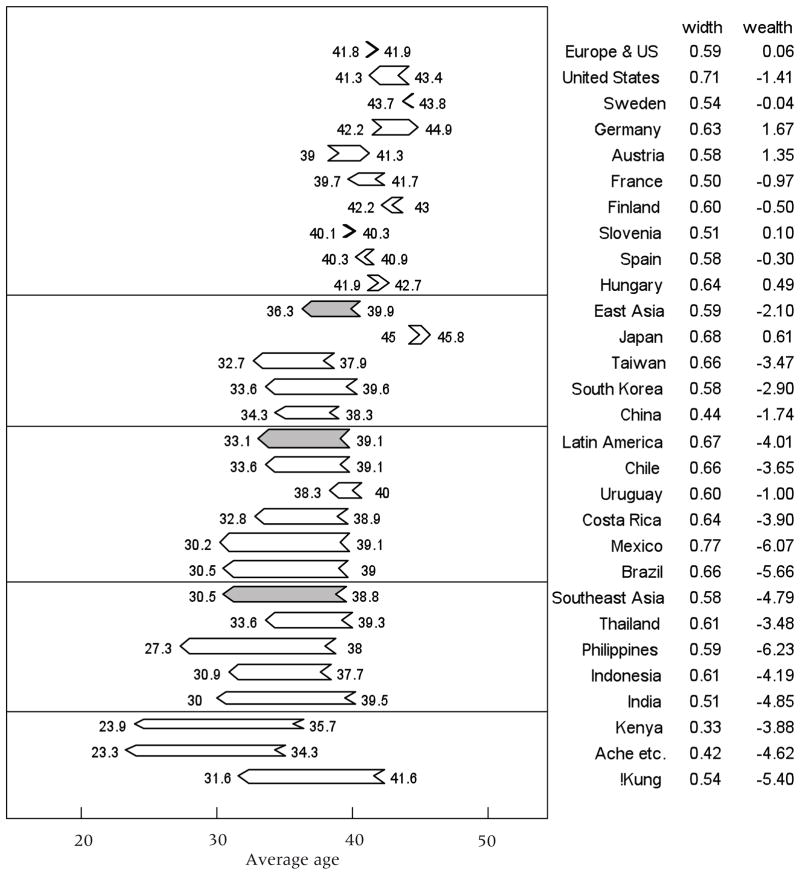
The width of the arrow is per capita consumption divided by labor income. This may differ considerably from country to country. In China, with a low value of 0.44, a very high proportion of income is saved, so consumption is low relative to labor income, and the arrow is thin. In countries with low saving rates, high support ratios reflecting favorable population age distributions, high remittance income, or high asset income including income from extractive industries, consumption may be considerably greater than labor income, so the arrow is fat. The highest values are found in Mexico (0.77) and the United States (0.71).
With this background, Figure 4 plots arrows for 23 countries plus two hunter-gatherer groups. We might expect the arrows to cluster in regional patterns, in part because regions share certain demographic features and in part because regionally similar cultures shape the life cycle. The countries are grouped into four broad regions—Europe/United States; East Asia; Latin America; and South and Southeast Asia—and two hunter-gatherer groups. These regions are arranged in order of per capita GDP, with the highest first. Within each region, the member countries are also ordered by per capita GDP, except for the hunter-gatherer groups. The unweighted averages for the regions are shaded.
FIGURE 4. Average age of consumption (C) and labor income (Yl), using each country’s age distribution.
NOTE: Arrow point is average age of C; arrow tail is average age of Yl; width is per capita C relative to average Yl over ages 30–49. Area within arrow is implied wealth. Within region, country order by ppp-adj avg GDP.
Two features of the figure are visually striking. First, the arrows for the hunter-gatherer groups7 and the poorer countries at the bottom of the figure all point to the left and are long, indicating strongly downward net transfers from older to younger ages. The length of the arrows tends to decline as we move up the figure, ending with short arrows at the top, some pointing slightly left (downward) and some slightly right (upward), indicating that net transfers are no longer predominantly from older to younger ages. The arrows for regional averages also follow this pattern, with the arrow for the average of the European/US region pointing very slightly to the right, indicating net transfers to the elderly. Second, we see that the stack of arrows, broad at the base, is tilted to the right. The richer countries toward the top are also older, so both ends of the arrows are placed at older ages and farther to the right. The mean age of making and receiving transfers is older in older populations.
For five countries the arrows point upward: Germany, Austria, Japan, Slovenia, and Hungary. For another three countries the arrows point only very slightly downward, by less than a year: Sweden, Finland, Spain. There are nine countries in our data set in which more than 15 percent of the population is 65 or over, and all five of our upward arrows come from this group, as do all three of our short downward arrows. The United States, the richest country, has only about 12 percent of its population 65+ and has a downward-pointing arrow, similar to Uruguay—which, although relatively poor, has the same proportion 65+ as does the United States. Kenya, with the youngest population, also has the longest downward-pointing arrow. This suggests that the population age distribution has an important influence on the length and direction of the arrows, a possibility we investigate below.
The main goal here is to increase our understanding of these cross-sectional patterns and apparent historical changes, and their relation to the demographic transition and the population aging it eventually brings about. The direction of flows results in part from the population age distribution, since higher proportions of the young or the old tilt the aggregate flows toward that age group. Thus population aging makes arrows less downward or more upward. However, the shapes of the age profiles of consumption and labor income also play an important role. These shapes are influenced by individual incentives, culture, and institutional contexts, and particularly by the growth of the public sector and its transfer programs.
We begin by probing the role of population age distribution in shaping the pattern we observed in Figure 4. We calculate the unweighted average population age distribution for all 23 countries in our current data set, and recompute all average ages and per capita flows using this same age distribution for all populations.8 The results are shown in Figure 5, in which all arrows are now downward and most of the variation across countries has disappeared. Austria stands out for its short downward arrow, as does Uruguay. Among the regions, Latin America now has the shortest arrow, while the arrows for Europe/US and the lowest-income region, South and Southeast Asia, are nearly identical. This shows clearly that population age distribution has a huge effect on the direction of transfers. Nonetheless, it is not the whole story, and in addition the arrows summarize and thus obscure other important changes and differences.
These data are cross-sectional and not historical. Nonetheless, they suggest that over past millennia, the direction of income flows has been strongly downward from older to younger generations, probably in all societies. Once we realize the key role that population aging has played in shortening the arrows and even reversing them, it follows that in the pretransitional and therefore young populations of the past, income would have been reallocated downward across age for any plausible shape of the per capita age profiles.9 The young population age distributions in the past would have placed so much weight on the necessarily heavy dependence of children that downward transfers would have dominated any upward flows that may have occurred.
The roles of public and private transfers
We have seen the extent to which individuals are able to consume more than their labor income, particularly in childhood and old age. How is this accomplished? The many mechanisms can be classed under the headings of asset operations and transfers. Asset operations include saving and investing during the working ages and dissaving while living on asset income and asset sales in old age. They also include borrowing money to pay for higher education, paying interest on the loan, and eventually repaying the principal. All borrowing and lending, paying and receiving interest or dividends, and similar operations come under this heading, including operations involving foreigners and foreign governments. These asset operations are included in NTA, but are not discussed here. Instead we emphasize transfers. These include private or familial transfers, both intrahousehold and interhousehold, and public transfers, both in-kind and monetary. Remittances to or from other countries are private interhousehold transfers.
NTA includes explicit measures of both public and private transfers. Public transfers received are estimated using the in-kind transfers that have already been included in the measure of consumption, plus cash transfers to individuals such as public pensions, family allowances, public assistance, and unemployment insurance, plus a prorated share of expenditures on public goods such as the military, publicly funded research, social infrastructure, and so on. Public transfers made are based on various taxes paid by age. Private transfers are interhousehold and intrahousehold. Interhousehold transfers are reported on some surveys and are here assumed to be given to the head of the household, who redistributes them through transfers to other members. Remittances from abroad are also interhousehold transfers. Intrahousehold transfers are measured as if a tax were levied within the household on all labor income in excess of consumption, and transfers are assumed to be made to those who consume more than they produce. Transfers in this way are allowed without passing through the head of household. Household assets, such as consumer durables or a home, are assumed to be owned by the head, and the services imputed to these assets are then transferred to household members in the usual way and counted as transfers from the head. Our estimates do not include bequests at death.10
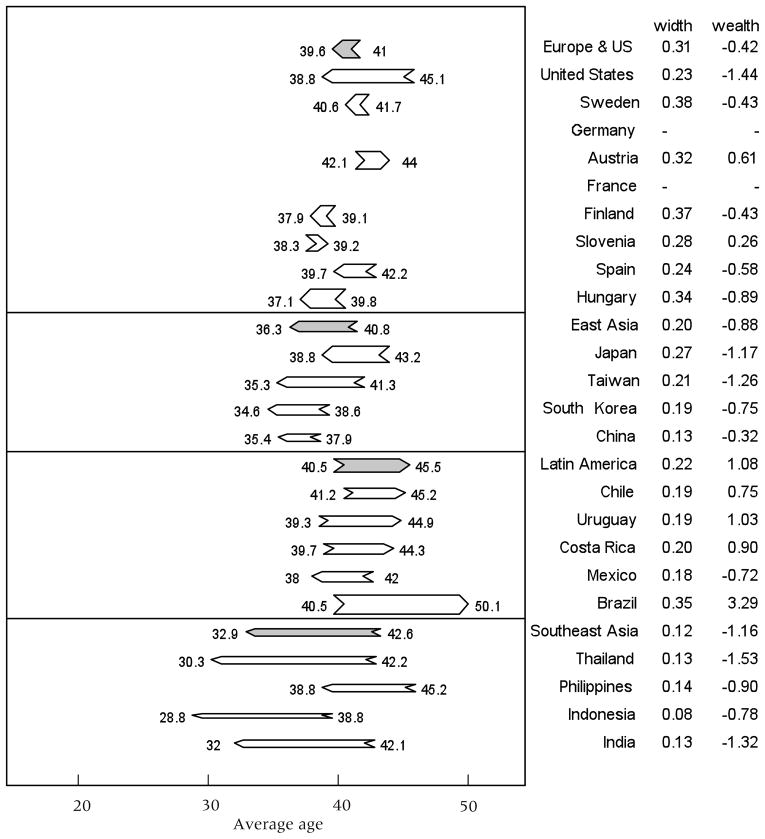
Estimates of public and private transfers are not yet available for all 23 countries included in Figures 4 and 5. Figure 6 shows arrows for private inter vivos transfers for those countries with the necessary data, and empty spaces otherwise. (Kenya and the hunter-gatherer groups are omitted here and in subsequent figures because they lack the relevant data.) The tails and heads are placed on the average age of making and receiving a private transfer. The width of the arrow is now the per capita value of private transfers divided by average labor income.
The figure shows that in every region, private transfers are strongly downward. Nonetheless, there are some important differences in length and thickness of these arrows. East Asia has the shortest arrows. Although countries in this region make substantial private transfers per child for health and education, fertility is low, and Taiwan and South Korea make substantial transfers to the elderly through family support systems, which offset the effect of child transfers. Latin America and Southeast Asia have the longest arrows, reflecting their higher fertility and younger populations with fewer elderly, so that transfers to children dominate. Aside from Thailand, these countries do not have strong familial transfers to the elderly.
Europe and the United States have extremely thin arrows. In part, this is because they have very low fertility and few children, so transfers to children are reduced.11 But in addition, these countries have very strong welfare states with good public education and, except for the United States, good publicly provided health care for children. Private expenditures on children for health and education are very limited. At the same time, private transfers to the elderly are nonexistent, and in fact the elderly make net private inter vivos transfers to younger generations on average. All this tends to make the arrows longer and thinner.
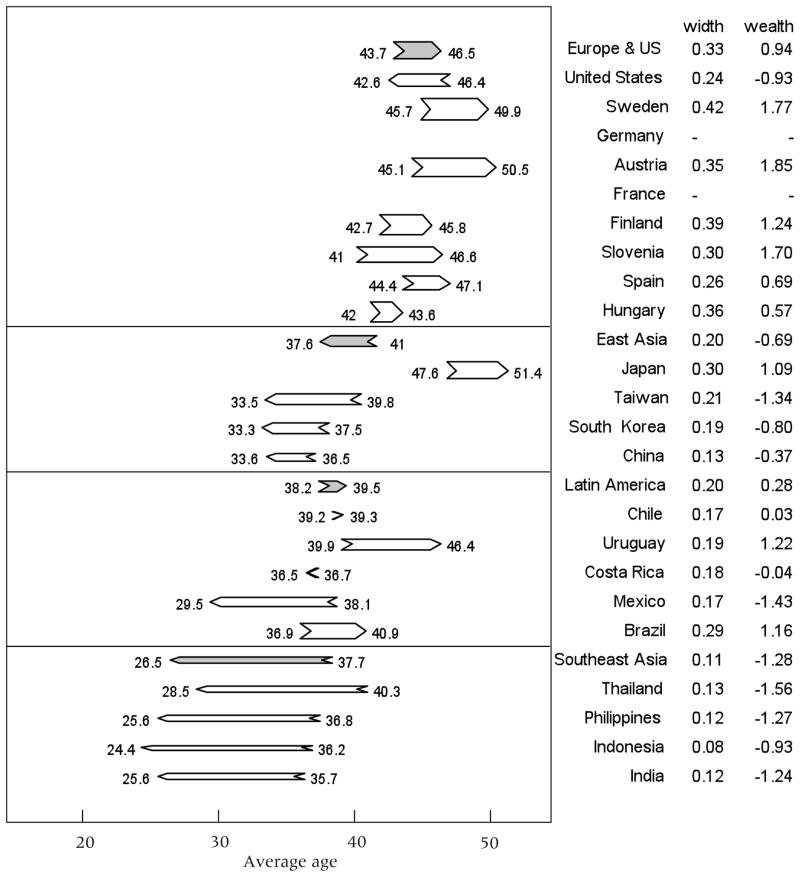
Figure 7 shows similar arrows, but this time for the standard population age distribution. Brazil has by far the strongest downward private transfers of any country, as measured by the size of the transfer wealth (area of the arrow). There are some differences from the arrows drawn using own-population weights, but no qualitative differences, so we do not dwell on these.
FIGURE 7. Average age of private transfer inflows (TFI) and private transfer outflows (TFO), using age distribution averaged across all countries.
NOTE: Arrow point is average age of TFI; arrow tail is average age of TFO; width is the annual per capita flow in the population relative to labor income over ages 30–49. Area within arrow is implied wealth. Within region, country order by ppp-adj avg GDP.
The finding that private transfers are uniformly downward from older to younger ages is important. In Caldwell’s (1976) classic article on the demographic transition, he wrote: “The key issue here, and, I will argue, the fundamental issue in demographic transition, is the direction and magnitude of intergenerational wealth flows or the net balance of the two flows—one from parents to children and the other from children to parents—over the period from when people become parents until they die.… In all primitive societies and nearly all traditional societies the net flow is from child to parent” (p. 344; emphasis in original). If we take this statement at face value, then Figures 6 and 7 contradict it for rich and poor countries alike. Private transfers, the ones relevant for private fertility decisions, are uniformly downward from older to younger on average. The figures confirm similar findings by Lee 1994b and 2000 and Stecklov 1999. When we interpret the statement more broadly to include other instrumental benefits that adults may derive from their children, such as insurance and physical security, then it is more difficult to bring quantitative evidence to bear (see Caldwell 2005 for an updated statement of his views, emphasizing that child services such as insurance should be taken into account).
In pretransitional agricultural societies, private transfers dwarf public transfers in importance, but the situation changes as countries become richer and more industrial and urban. Figure 8 shows the arrows for public transfers. Toward the bottom of the figure, the arrows are long and point downward to younger ages, and at the top in the richer countries they are short and mostly point upward. Evidently, at least in an accounting sense, the public sector plays a bigger role than the private sector in the reversal of the direction of transfer flows. The countries and regions show very divergent patterns. Net public transfers for Europe are upward, with the strong public pension programs and health care for the elderly dominating public education and family allowances, and with the already old populations of Europe. The United States, however, is an exception to this pattern with a downward arrow, the only one in the region, resulting in part from its younger age structure. The East Asian regional arrows generally point to the young (left), but Japan with its old population and substantial public transfers to the elderly looks much like the European countries. Aside from Japan, these countries do not have strong public pension programs, and spending on health care is less than in Europe and the United States. Taiwan and South Korea have relatively large familial transfers to the elderly. The upward arrow for Latin America is striking and surprising, because these populations are still young, except for Uruguay. However, the Latin American countries in our sample mostly have strong welfare state programs, including very strong public pension programs. Southeast Asia has by far the strongest downward public flow, reflecting their higher fertility and lack of public pension programs.
FIGURE 8. Average age of public transfer inflows (TGI) and public transfer outflows (TGO), using each country’s age distribution.
NOTE: Arrow point is average age of TGI; arrow tail is average age of TGO; width is per capita TGI relative to average labor income over ages 30–49. Area within arrow is implied wealth. Within region, country order by ppp-adj avg GDP.
Age standardization (see Figure 9) strengthens the upward direction of public transfers in Latin America and reverses it in the United States and the Europe/US region, since the former becomes older and the latter younger thereby. The positive public transfer wealth in Latin America is expected to displace some of the capital that would otherwise have been saved by workers to provide for retirement in old age. Given the actual age distributions of the United States and Europe, the same is true there. Indeed, a possible adverse effect on incentives to save is one of the concerns about the public pensions of the rich countries.
FIGURE 9. Average age of public transfer inflows (TGI) and public transfer outflows (TGO), using age distribution averaged across all countries.
NOTE: Arrow point is average age of TGI; arrow tail is average age of TGO; width is the annual per capita flow in the population relative to labor income over ages 30–49. Area within arrow is implied wealth. Within region, country order by ppp-adj avg GDP.
One important question is whether there is substitution between public and private transfers. Do public transfers crowd out private? For example, it is hard to believe that private spending on education and health care would not be greater if there were no public programs providing them. We also expect that without public pensions, elders would more frequently coreside with their adult children and receive support from them. But it is also possible that the alternative to public pensions would be private ones, or continuing labor effort by the elderly.
While these arguments may seem plausible, national cultures may differ considerably in the significance of spending on children and support for the elderly. Thus the relative level of consumption by the elderly varies substantially from country to country, and the same is true for human capital investments in children (on health and education, see Lee and Mason 2010).
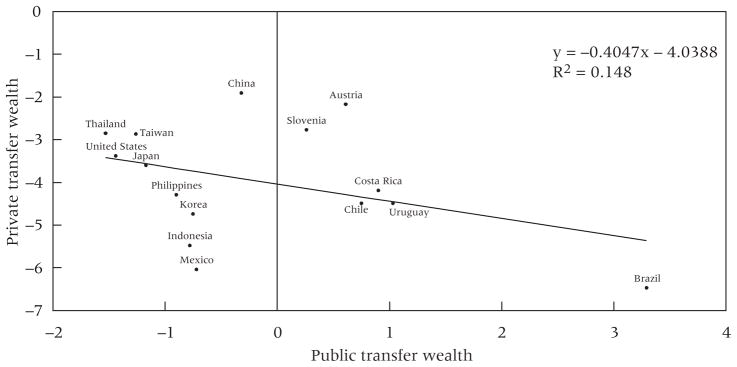
A simple scatter plot of private transfer wealth versus public transfer wealth, using a standard population age distribution, reveals a negative relationship but not a strong or striking one (see Figure 10). The regression coefficient is −.4, indicating that each unit increase of public transfer wealth is associated with .4 units less of negative private transfer wealth, consistent with a crowding out or substitution story. Three of the countries are special cases. China, which is far above the regression line, has unusually low consumption relative to labor income because of the country’s exceptionally high saving rate.12 This leads both private and public transfer wealth to fall closer to zero. Mexico and, to a lesser degree, the Philippines have high remittance income and thus have more negative private transfer wealth than would be expected given their labor income. Without these special countries in the regression, the slope rises to nearly −.5 and R2 improves to nearly .3, but this sort of selective exclusion exercise is misleading.
FIGURE 10.
Public transfer wealth vs. private transfer wealth in standard populations: per capita, in years of average labor income
We note that Brazil has by far the greatest positive public transfer wealth and by far the most negative private transfer wealth, and perhaps this is not a coincidence.
A closer look at the composition of public transfers
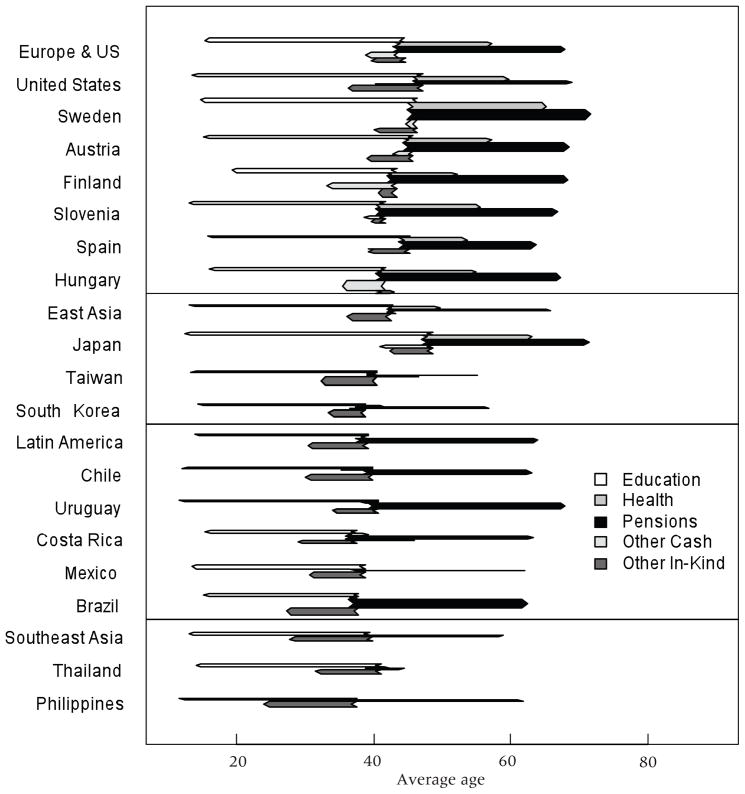
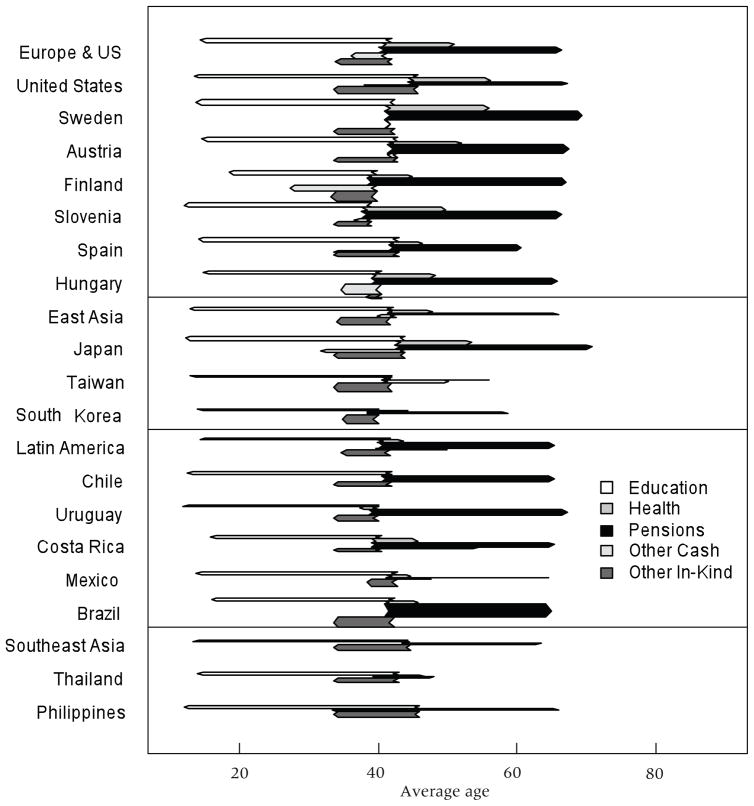
The final two figures, 11 and 12, present arrow diagrams for different components of public transfers: education, health, pensions, other in-cash, and other in-kind. The first three are self-explanatory. Other in-cash includes family allowances and need-based cash transfers. Other in-kind could include some need-based transfers such as food, but the bulk of it is public good expenditures that cannot be allocated to any particular individual or age group, such as military spending, social infrastructure, research, and so on. We treat these as going equally to each individual, but the transfer is made by taxpayers who differ from the average age. The main interest is in education, health care, and pensions. For purposes of these figures, we have placed all the tails of the arrows on the average age of paying all taxes in each country, although in many cases there are special taxes for some programs such as pensions or education. Thus for a given country, the tails of all arrows are located at the same age.
FIGURE 11. Average age of public transfer flows, using each country’s age distribution.
NOTE: Arrow point is average age of inflow; arrow tail is average age of outflow. Outflow age profile same for all sectors, adjusted to match aggregate inflow. Width is per capita inflow relative to average labor income over ages 30–49. Area within arrow is implied wealth. Within region, country order by ppp-adj avg GDP.
FIGURE 12. Average age of public sector flows, using age distribution averaged across all countries.
NOTE: Arrow point is average age of inflow; arrow tail is average age of outflow. Outflow age profile same for all sectors, adjusted to match aggregate inflow. Width is average of per capita inflow and outflow relative to average labor income over ages 30–49. Area is implied wealth. Within region, country order by ppp-adj avg GDP.
In Figure 11, it is striking that pensions are so meager in the United States, the richest country in the sample, and are so generous in Brazil, the second poorest country in the figure. To remove any effect of the different age structures, Figure 12 uses the standard for all countries. Here there is little change for the United States, but Brazil’s pension program now dominates all others in the figure. Both countries are anomalous in this regard. Most poor countries have small pension programs and most rich countries have generous ones, with or without age distribution standardized.
The two figures also reveal that only countries in the Europe/US region, plus Japan, have substantial public health care expenditures. Even relatively rich Taiwan and South Korea have weak public expenditures on health.
For education, Figure 12 shows Sweden with greater expenditures and a younger mean age of receiving education, perhaps reflecting strong public childcare expenditures. Taiwan and South Korea both have relatively weak spending on education, but these countries substantially augment public spending with private expenditures for tutoring, cram schools, and other complements to public education (see Lee and Mason 2010).
The average age of paying taxes is particularly high in the United States in Figure 12, and similarly high in the Philippines. This reflects the high labor income earned in old age in these countries.
Conclusions and discussion
In every population we have studied, net familial transfers are strongly downward from older to younger generations, which is consistent with evolutionary theory and inconsistent with simple versions of wealth flow theory. Even the Asian countries with strong familial old-age support, such as Taiwan, South Korea, China, and Thailand, have downward familial transfers overall. Parental net transfers to children over the life cycle are also the net cost of children, and they enter into fertility decisions in complicated ways (Becker and Lewis 1973; Willis 1988, 1994). In societies in which the elderly are supported by public unfunded pension and health systems, costs of this support drive a wedge between the public and private cost or benefit of children and might contribute to the low fertility of today’s industrial countries, although we offer no evidence on this point here (Lee 1990).
A fundamental change has occurred in the direction of net intergenerational transfers from downward to upward, with most of the change driven by population aging in the later stages of the most advanced demographic transitions. Changes in the shape of the economic life cycle also contributed: old-age consumption rose relative to consumption at other adult ages. At the same time, expenditures per child were raised by increasing per child human capital investment in a smaller number of children per couple. It seems likely that the growing role of the welfare state played an important role in promoting these changes. In particular, substantial public transfers to the elderly have become common, even in some low-income Latin American countries, and these have apparently largely replaced familial support for the elderly. We say “apparently” because we do not have strong evidence of the substitution of public for private transfers. The case of Brazil, with the most generous public transfers to the elderly and the most strongly downward private transfers, is certainly suggestive. However, we do not see net familial support of the elderly in the poorest countries in our sample, which have no appreciable public transfers for the elderly. Income earned by assets of the elderly, such as land and livestock, probably plays a key role in these situations. In rich industrial countries, the demand for leisure at the end of life has risen with income. In the lower-income countries, individuals are more likely to continue to work, and this prolonged work also diminishes the need for family transfers to the elderly.
It is clear that current public transfers to the elderly in rich industrial countries will not be sustainable as populations age further over the next few decades. Patterns of work, consumption, and intergenerational transfers through both public and private sectors will surely change. Already there are important moves to restructure public pension programs and to contain costs in public health care programs. In some rich countries, labor supply of the elderly has begun to rise, at least slightly. It seems unlikely, however, that these changes will prevent more reversals in the direction of flows as rich industrial nations age rapidly. Some less developed Latin American countries have adopted the public transfer programs of Europe, and will experience the resulting fiscal pressures and perhaps similar reversals of flows. Asian countries other than Japan have so far gone a different route, with strong private, but weak public, support of the elderly. Once sustainability problems are resolved, the direction of flows is not in itself an issue. Nonetheless, rising public expenditures on the elderly may compete with public investment in children, and for countries with declining numbers of workers to support increasing numbers of elderly, underinvestment in children would be a very bad outcome. More generally, policymakers should pay careful attention to levels and trends in the intergenerational and inter-age distribution of consumption, rather than leaving these to be shaped as an incidental byproduct of institutions and policies designed long ago for other purposes.
Acknowledgments
Research for this chapter was funded by parallel grants from the National Institutes of Health to Lee and to Mason, as well as by grants from MEXT.ACADEMIC FRONTIER (2006–2010) and UNFPA to NUPRI in Japan. We are grateful for help from Gretchen Done-hower and Amal Harrati, and grateful to all the country research teams in the NTA project for the use of their data. The researchers are identified and more detailed information is available for many countries in working papers on the NTA website: «www.ntaccounts.org». We are also grateful to Tim Dyson and David Reher for their comments on an earlier draft.
Footnotes
These caloric-need weights are somewhat different from the equivalent adult consumer weights used by NTA, which will lead to some differences in estimated age profiles. In particular, a decline in estimated consumption at older ages in hunter-gatherer populations is largely explained in this way.
However, it is possible that the level of fertility is associated with level of female labor supply, and therefore with the shape of the labor income curve, so this age range is not without its own problem.
We value in-kind public transfers at the cost of providing them. However, the elderly, for example, may value the in-kind health care they receive at less than its cost of provision. Put differently, public provision of in-kind transfers may involve greater inefficiencies than private provision by the family. National Transfer Accounts cannot assess the utility or welfare contributions arising from transfers, but they do measure the expenditures involved.
Of the 23 contemporary populations studied here, only China funds its life-cycle deficit entirely out of labor income. Mexico and the Philippines are two examples of countries relying heavily on net foreign transfers (remittances) to fund their life-cycle deficit.
Let c(x) be the per capita consumption at age x, and let N(x) be the total population at age x. Then aggregate consumption at age x is c(x)N(x). The average age of consumption, Ac is given by . The average age of labor income is calculated similarly. Per capita consumption over all ages is given by .
Calculations we have done elsewhere show that the approximation is quite good under the assumption that the discount rate is 3 percent per year and that individuals expect the age profiles of labor income and consumption to rise at 1 percent per year. We did not try other assumptions.
The arrow for the !Kung is located farther right than the arrow for the Ache, Piro, and Macheguenga. This is because fertility is considerably lower for the !Kung and consequently the !Kung population is older.
For per capita flows, we adjusted the level but not shape of the consumption age profile until the ratio of aggregate consumption to aggregate labor income in this hypothetical simulated economy is the same as it was in the actual economy. The length and direction of the arrows are unaffected by this adjustment; only the width of the arrow and its area are affected.
Pretransitional populations had young populations that were proximately the result of their high fertility. Their high fertility follows from their generally high mortality and non-negative growth rates.
We have estimates of bequests for a few countries, based on the assumption (known to be false) that mortality is independent of asset holdings. We plan to estimate bequests more systematically in the future. Note that only the results plotted in Figures 6, 7, and 10, all involving private transfers, would be affected by inclusion of bequests.
At lower levels of fertility there is higher investment per child in education and health care. However, total consumption expenditures for children are distinctly lower in populations with lower fertility, because other general consumption is not as responsive to lower fertility.
China’s very high saving rate will eventually lead to large bequests, either public or private, strengthening downward transfers. We expect this will also occur in a number of other countries, particularly those with high public pensions that are either not fully spent or that permit the preservation of the assets of the elderly. Unfortunately, bequests are not yet included in the National Transfer Accounts.
References
- Becker GS, Barro R. A reformulation of the economic theory of fertility. Quarterly Journal of Economics. 1988;103(1):1–25. [PubMed] [Google Scholar]
- Becker G, Lewis HG. On the interaction between the quantity and quality of children. Journal of Political Economy. 1973;84(2,2):S279–S288. [Google Scholar]
- Becker GS, Murphy KM. The family and the state. Journal of Law and Economics. 1988 April;:1–18. [Google Scholar]
- Caldwell JC. Toward a restatement of demographic transition theory. Population and Development Review. 1976;2(3/4):321–366. [Google Scholar]
- Caldwell JC. On net intergenerational wealth flows: An update. Population and Development Review. 2005;31(4):721–740. [Google Scholar]
- Chu CY, Lee R. The co-evolution of intergenerational transfers and longevity: An optimal life history approach. Theoretical Population Biology. 2006;69(2):193–201. doi: 10.1016/j.tpb.2005.11.004. [DOI] [PMC free article] [PubMed] [Google Scholar]
- Costa DL. The Evolution of Retirement: an American Economic History, 1880–1990. Chicago: University of Chicago Press; 1998. [Google Scholar]
- Gruber J, Wise DA. Social Security and Retirement Around the World, an NBER Conference Report. Chicago: University of Chicago Press; 1999. [Google Scholar]
- Hawkes K, Blurton Jones N. Human age structures, paleodemography, and the grandmother hypothesis. In: Voland E, Chasiotis A, Schiefenhövel W, editors. Grand-motherhood: The Evolutionary Significance of the Second Half of Female Life. New Brunswick, NJ: Rutgers University Press; 2005. pp. 118–140. [Google Scholar]
- Hill K, Hurtado AM. Cooperative breeding in South American hunter-gatherers. Proceedings of the Royal Society B: Biological Sciences. 2009;276(1674):3863–3870. doi: 10.1098/rspb.2009.1061. [DOI] [PMC free article] [PubMed] [Google Scholar]
- Howell N. Life Histories of the Dobe !Kung. Berkeley: University of California Press; 2010. [Google Scholar]
- Hrdy SB. Mothers and Others: The Evolutionary Origins of Mutual Understanding. Cambridge, MA: Belknap Press; 2009. [Google Scholar]
- Kaplan H. Evolutionary and wealth flows theories of fertility: Empirical tests and new models. Population and Development Review. 1994;20(4):753–791. [Google Scholar]
- Kaplan HS, Robson AJ. The emergence of humans: The coevolution of intelligence and longevity with intergenerational transfers. Proceedings of the National Academy of Science. 2002;99:10221–10226. doi: 10.1073/pnas.152502899. [DOI] [PMC free article] [PubMed] [Google Scholar]
- Lee RD. Population policy and externalities to childbearing. In: Preston S, editor. Annals of the American Academy of Political and Social Science, special issue. 1990. Jul, pp. 17–32. World Population: Approaching the Year 2000. [Google Scholar]
- Lee RD. The formal demography of population aging, transfers, and the economic life cycle. In: Martin LG, Preston SH, editors. The Demography of Aging. Washington, DC: National Academy Press; 1994a. pp. 8–49. [Google Scholar]
- Lee RD. Fertility, mortality and intergenerational transfers: Comparisons across steady states. In: Ermisch J, Ogawa N, editors. The Family, the Market and the State in Ageing Societies. Oxford: Oxford University Press; 1994b. pp. 135–157. [Google Scholar]
- Lee RD. A cross-cultural perspective on intergenerational transfers and the economic life cycle. In: Mason A, Tapinos G, editors. Sharing the Wealth: Demographic Change and Economic Transfers between Generations. Oxford: Oxford University Press, Oxford; 2000. pp. 17–56. [Google Scholar]
- Lee RD. Rethinking the evolutionary theory of aging: Transfers, not births, shape senescence in social species. Proceedings of the National Academy of Sciences. 2003;100(16):9637–9642. doi: 10.1073/pnas.1530303100. [DOI] [PMC free article] [PubMed] [Google Scholar]
- Lee RD. Sociality, selection and survival: Simulated evolution of mortality with inter-generational transfers and food sharing. PNAS. 2008;105(20):7124–7128. doi: 10.1073/pnas.0710234105. [DOI] [PMC free article] [PubMed] [Google Scholar]
- Lee R, Kramer K. Children’s economic roles in the context of the Maya family life cycle: Cain, Caldwell, and Chayanov revisited. Population and Development Review. 2002;28(3):475–499. [Google Scholar]
- Lee R, Lapkoff S. Intergenerational flows of time and goods, and consequences of slowing population growth. Journal of Political Economy. 1988;96(3):618–651. [Google Scholar]
- Lee R, Lee S-H, Mason A. Charting the economic life cycle. Population and Development Review. 2008;34(Supp):208–237. [PMC free article] [PubMed] [Google Scholar]
- Lee R, Mason A. Fertility, human capital, and economic growth over the demographic transition. European Journal of Population. 2010;26(2):159–182. doi: 10.1007/s10680-009-9186-x. [DOI] [PMC free article] [PubMed] [Google Scholar]
- Maliki . Support system of the Indonesian elderly: Moving toward the Sustainable National Pension System. In: Lee R, Mason A, editors. Population Aging and the Generational Economy: A Global Perspective. Edward Elgar; Forthcoming. [Google Scholar]
- Mason A, Lee R, Tung A-C, Lai MS, Miller T. Population aging and intergenerational transfers: Introducing age into national accounts. In: Wise D, editor. Developments in the Economics of Aging. Chicago: NBER and University of Chicago Press; 2009. pp. 89–122. [Google Scholar]
- Nerlove M, Razin A, Sadka E. Household and Economy: Welfare Economics of Endogenous Fertility. Boston: Academic Press; 1987. [Google Scholar]
- Phananiramai M. Incorporating time into the national transfer accounts. NTA Working Paper. 2008 January 29; « www.ntaccounts.org».
- Razin E, Sadka E. Population Economics. Cambridge, MA: MIT Press; 1995. [Google Scholar]
- Robinson RS, Lee RD, Kramer KL. Counting women’s labour: A reanalysis of children’s net production using Cain’s data from a Bangladeshi village. Population Studies. 2008;62(1):25–38. doi: 10.1080/00324720701788590. [DOI] [PMC free article] [PubMed] [Google Scholar]
- Stecklov G. Evaluating the economic returns to childbearing in Côte d’Ivoire. Population Studies. 1999;53(1):1–17. [Google Scholar]
- Willis RJ. A new approach to the economic theory of fertility behavior. Journal of Political Economy. 1973;81(2):S14–64. Part II. [Google Scholar]
- Willis RJ. Externalities and population. In: Johnson DG, Lee RD, editors. Population Growth and Economic Development: Issues and Evidence. Madison: University of Wisconsin Press; 1987. pp. 661–702. [Google Scholar]
- Willis RJ. Life cycles, institutions and population growth: A theory of the equilibrium interest rate in an overlapping-generations model. In: Lee R, Arthur WB, Rodgers G, editors. Economics of Changing Age Distributions in Developed Countries. Oxford: Oxford University Press; 1988. pp. 106–138. [Google Scholar]
- Willis RJ. Economic analysis of fertility: Micro-foundations and aggregate implications. In: Lindahl-Kiessling K, Landberg H, editors. Population and Economic Development and the Environment. Oxford: Oxford University Press; 1994. pp. 139–172. [Google Scholar]


