

Abstract
BACKGROUND: Indoxyl sulphate (IS) and p-cresylsulphate (PCS) are uremic toxins with similar protein-binding, dialytic clearance, and proinflammatory features. Few studies have evaluated the possible associations between these solutes and coronary artery disease (CAD) in type 2 diabetes (T2D) patients. METHODS: A hospital-based case control study was performed. A total of 209 T2D patients were divided into two groups based on the presence/absence of significant CAD (≥50% luminal reduction). Serum total PCS and IS levels were measured using the Ultra Performance LC System. The relationship between total PCS and IS levels were investigated. Coronary calcium scores and the modified Gensini score were analyzed. RESULTS: Serum total PCS and IS levels were significantly higher in patients with both T2D and significant CAD, than in non-diabetic control subjects and T2D patients without CAD (all p < 0.05). Logistic regression analysis revealed independent and significant associations between the two solutes and CAD status. Serum total PCS, IS, and numbers of diseased vessels were elevated in groups with estimated glomerular filtration rate (eGFR) of 60-89 ml/min/1.73 m2 and below. Also, serum total PCS and IS levels were significantly associated with eGFR, coronary calcium scores, Gensini score, adipocytokines (adiponectin, visfatin, and leptin), and total white blood cell count. CONCLUSIONS: Serum total PCS and IS levels were elevated in patients with T2D and CAD. These increases were associated with renal function deterioration, inflammation, and coronary atherosclerosis.
Keywords: total p-cresylsulphate, indoxyl sulphate, coronary artery disease, type 2 diabetes, renal function
Abbreviations: ANOVA - analysis of variance; BEH - bridged ethyl hybrid; BMI - body mass index; BP - blood pressure; CAD - coronary artery disease; CI - confidence interval; CKD - chronic kidney disease; CRP - C-reactive protein; CT - computed tomography; eGFR - estimated glomerular filtration rate; GFR - glomerular filtration rate; HbA1c - glycated hemoglobin; HDL - high-density lipoprotein; HDL-C - high-density lipoprotein cholesterol; hs-CRP - highly sensitive C-reactive protein; IS - indoxyl sulphate; KDOQI - Kidney Disease Outcomes Quality Initiative; LDL - low-density lipoprotein; LDL-C - low-density lipoprotein cholesterol; MS - mass spectrometry; MulV - multivariate; NCEP-ATP-III - National Cholesterol Education Program Adult Treatment Panel III guidelines; OR - odds ratio; PC - p-cresol (para-cresol); PCS - p-cresylsulphate (para-cresylsulphate); SBP - systolic blood pressure; SD - standard deviation; T2D - type 2 diabetes; T-cholesterol - total cholesterol; UniV - univariate; UPLC - ultra performance liquid chromatography; WBC - white blood cell; WC - waist circumference; WHR - waist-to-hip ratio
Introduction
The main cause of death in diabetic patients is cardiovascular disease [1]. Loss of kidney function is due to diabetic nephropathy. When diabetic renal failure develops, several harmful uremic retention solutes accumulate in the circulation. This accumulation may play a direct role in the pathogenesis of diabetic nephropathy-related cardiovascular disease [2, 3].
The major renal toxins are protein-bound uremic retention solutes, especially p-cresylsulphate (PCS) and indoxyl sulfate (IS), which are absorbed from the gastrointestinal tract. They are newly investigated compounds in connection with coronary atherosclerosis. P-cresol (PC) is derived from ingested phenylalanine and plant phenols. In humans, it exists predominantly as the conjugate PCS [4]. IS is an organic anion metabolized in the liver and originates from indole, which is produced by intestinal bacteria as a metabolite of tryptophan [5]. In uremic patients, serum levels of PC and IS are elevated approximately 10-fold [6] and 50-fold [7], respectively, because of their strong protein binding ability, and poor clearance from the kidney and during conventional hemodialysis [8]. PCS and IS have been widely investigated for their contributions the pathogenesis of vascular injury via endothelial dysfunction [9, 10], proliferation of vascular smooth muscle cells [11], activation of atherosclerotic pro-inflammatory markers [12], and suppression of endothelial repair [13]. These findings indicate that these two protein-bound uremic toxins induce the initiation and/or progression of atherosclerosis. Moreover, our recent study demonstrated that higher total PCS levels were associated with the severity of coronary atherosclerosis in patients with stable angina in the early stages of chronic kidney disease [14]. Atoh et al. confirmed that IS was already elevated at the time of early type 2 diabetic nephropathy (estimated glomerular filtration rate (eGFR) of 60-89 ml/min/1.73 m2) [2]. However, the relationship between serum total PCS and IS levels and coronary atherosclerotic development in T2D patients is not understood at the moment.
In the present study, we investigated the hypothesis that total PCS and IS levels are associated with coronary atherosclerotic development in T2D patients. We assessed serum total PCS and IS levels, modified Gensini scores, and coronary artery calcium scores (as measured by cardiac multi-slice computed tomography) in a cohort of T2D patients. We further examined whether total PCS and IS levels might be associated with selected atherosclerotic inflammatory cytokines, and traditional cardiovascular risk markers in this population.
Subjects and methods
Subjects
This study included 209 patients who underwent coronary angiography between June 2007, and December 2010, for the diagnosis and interventional treatment of coronary artery disease (CAD) in diabetic, or cardiovascular, clinics of E-Da Hospital. Diagnosis of T2D was based on World Health Organization criteria [15]. Patients were excluded who presented with type 1 diabetes symptoms, such as diabetic ketoacidosis, acute ketonuria, or continuous insulin requirements within one year of diagnosis. Also, patients with histories of concomitant valvular disease, congenital heart disease, or cardiomyopathy, and those who refused to provide informed consent were excluded. Subjects without clinical evidence of major diseases, including T2D, renal disease, cerebrovascular disease, and CAD, who underwent routine medical check-ups were randomly recruited as control subjects. Non-diabetic subjects were defined as individuals with fasting plasma glucose lower than 100 mg/dl, no diabetes history, and absence of familial T2D history. Individuals were considered as non-CAD if they had undergone coronary angiographic examination, and if insignificant coronary stenosis was documented. Detailed personal disease history and family history were obtained from all study subjects under the supervision of trained personnel. Questionnaires were checked for proper completion and plausibility. This case-control study was approved by the human research ethics committee of E-Da Hospital, I-Shou University. Informed consent was obtained from each patient. Examined anthropometric parameters included:
- Body mass index (BMI)
- Waist-to-hip ratio (WHR). Waist and hip circumferences were measured to the nearest 0.1 cm, at the narrowest point between the lowest rib and the uppermost lateral border of the right iliac crest. The hips were measured at their widest point.
Blood pressure (BP) was measured in the morning (two readings at least 2 min apart) at the right upper arm in line with the heart, with the subjects seated and after at least 5 min of rest. BP measurement was carried out using a mercury column sphygmomanometer. The average values of these measurements were recorded for analysis.
Hypertension was defined as systolic BP (SBP) of ≥140 mmHg, diastolic BP of ≥90 mmHg, or both, or intake of anti-hypertensive drugs. Dyslipidemia was defined as follows:
- triglyceride level of ≥150 mg/dl, and/or
- high-density lipoprotein (HDL) cholesterol level of <35 mg/dl for men and <39 mg/dl for women, and/or
- total cholesterol level of ≥200 mg/dl, and/or
- low-density lipoprotein cholesterol level of ≥130 mg/dl, or
- those undergoing treatment for lipid disorders according to the criteria of NCEP-ATP-III [16].
Patient smoking status was classified as (i) individuals who never smoked, (ii) former smokers (ceased smoking for at least 1 year), or (iii) current smokers. In this study, former and current smokers were analyzed as a group, and compared with those who had never smoked.
Angiographic definitions
Coronary angiograms were obtained according to standard techniques. The severity of stenosis was assessed using quantitative coronary angiography. Angiograms and quantitative coronary angiographic analyses were evaluated by at least 2 experienced interventional cardiologists blinded to clinical information and serologic parameters. Angiographic outcomes were scored according to the following two systems:
1. The possible scores of this index ranged from 0 to 3 diseased vessels. The criterion for 1-, 2-, or 3-vessel disease was a ≥50% luminal reduction of the right coronary artery. The stenosis of the left main coronary artery did not exceed 50%.
2. In the modified Gensini scoring system, weights are assigned to each coronary segment depending on vessel size and importance, and range from 0.5 to 5.0. Segments serving larger regions of the myocardium are more heavily weighted. The narrowing of the coronary artery lumen is rated as follows:
i) 2 for 0-25% stenosis,
ii) 4 for 26-50% stenosis,
iii) 8 for 51-75% stenosis,
iv) 16 for 76-90% stenosis,
v) 32 for 91-99% stenosis, and
vi) 64 for 100% stenosis.
The modified Gensini index is the sum of the total weights for each segment [17, 18].
Calculation of coronary calcium score on coronary CT angiography
Agatston calcium scores were measured for 75 randomly selected subjects by using coronary artery calcification-scoring software (SmartScore). The Agatston calcium score was obtained by multiplying the area by a weighting factor, dependent on the peak signal anywhere in the lesion. The scores for individual lesions were added to obtain the Agatston calcium score for the entire coronary tree. The total calcium volume was calculated by multiplying the area of the calcified lesion (mm2) by section thickness [18].
Laboratory measurements
Peripheral blood samples were taken from an antecubital vein after admission to the hospital. Blood for total PCS and IS determinations was obtained, centrifuged, and stored at -80°C for subsequent assay. Before coronary angiography, complete blood counts, serum creatinine profiles, and serum lipid profiles were determined for all patients. Plasma triglycerides, total cholesterol, low-density lipoprotein cholesterol (LDL-C), high-density lipoprotein cholesterol (HDL-C), uric acid, albumin, creatinine, and glucose were measured by standard commercial methods on a parallel multichannel analyzer (SYNCHRON, Los Angeles, CA, USA), as described in our previous reports [19].
Serum samples were deproteinized by adding 3 parts methanol to 1 part serum, for determination of total PCS and IS. All analyses were performed on a Waters Acquity Ultra Performance Liquid Chromatography (UPLC) system (Milford, MA, USA). UPLC assays using detection at 280 nm for IS, and 260 nm for PCS, were performed at room temperature on an Acquity UPLC bridged ethyl hybrid (BEH) phenyl column of 2.1 x 100 mm. The column temperature was maintained at 30°C. The buffer flow was 0.4 ml/min using 10 mM NH4H2PO4 (pH = 4.0) (A) and acetonitrile (B), with a gradient running from 82.5%A/17.5%B to 55%A/45%B over 9 min. Under these conditions, IS and PCS appeared at 1.4 min and 1.7 min, respectively. The limits of detection of this assay were 0.225 mg/l for IS and 1 mg/l for PCS. Calibration curves were constructed by plotting the peak areas versus the concentrations of each analysate. The average r2 values were 0.999 ± 0.001. Quantitative results were obtained and calculated as concentrations (mg/l). Intra- and inter-assay coefficients of variation (relative standard deviation) were 0.4% and 0.05% for IS, and 5.50% and 7.48% for PCS, respectively. Parallel comparisons of serum total PCS and IS levels, obtained from UPLC and mass spectrometry (MS) in 10 randomly selected patients, were in agreement with Bland-Altman plots. For serum IS, Pitman’s test of difference in variance showed r = -0.263 and p = 0.493 (for serum PCS, r = -0.765 and p = 0.124) [14, 20, 21]. The concentration of plasma visfatin was determined using a commercial enzyme immunoassay kit (Phoenix Pharmaceuticals, Belmont, CA, USA). Adiponectin and leptin levels were determined by commercial solid-phase enzyme-linked immunosorbent assay kits (B-Bridge International, Sunnyvale, CA, USA; Phoenix Pharmaceuticals, Belmont, CA, USA; and R&D Systems, Inc., USA). The concentration of plasma C-reactive protein (CRP) was measured using a high-sensitivity method (IMMAGE; Beckman Coulter, Immunochemistry Systems, Brea, CA, USA). The intra-assay coefficients of variation were 2.4-2.7% for visfatin, 3.2-7.3% for adiponectin, 3.2-6.9% for leptin, and 4.2-8.7% for hs-CRP. In any single experiment, samples were measured in duplicate.
The eGFR (ml/min/1.73 m2) of individual patients was calculated using the Modification of Diet in Renal Disease (MDRD) Study simplified equation [22]. The patients were stratified by eGFR into CKD stage 1 (≥90 ml/min/1.73m2), stage 2 (60-89 ml/min/1.73m2), stage 3 (30-59 ml/min/1.73m2), and stage 4 (≤29 ml/min/1.73m2) according to Kidney Disease Outcomes Quality Initiative (KDOQI) clinical practice guidelines outlined by the National Kidney Foundation. The 4 stages were compared with respect to clinical characteristics and laboratory data.
Statistical analysis
Data normality was analyzed using the Kolmogorov-Smirnov test. Continuous, normally distributed variables are presented as mean ± SD, and non-normally distributed variables as median (interquartile range). Statistical differences in variables were compared using unpaired Student's t-tests, and one-way analysis of variance (ANOVA) for normally distributed variables, followed by Tukey's pairwise comparison. Categorical variables were recorded as frequencies and/or percentages, and inter-group comparisons were analyzed by the chi-square test. Because the distributions of serum total PCS, IS, hs-CRP, and triglycerides were skewed, logarithmically transformed values were used for statistical analysis.
The association of total PCS and IS with CAD was examined by univariate and multivariate logistic regression analysis that contained:
1. total PCS or IS, age, and gender,
2. total PCS or IS, age, gender, BMI, and BP,
3. total PCS or IS, age, gender, BMI, BP, lipid profile, and fasting glucose, and
4. total PCS or IS, age, gender, BMI, BP, lipid profile, fasting glucose, eGFR, and smoking status.
Multivariate adjusted odds ratios (ORs) were applied together with 95% confidence intervals (CI). Pearson's correlation analysis was used to examine the correlations between serum total PCS and IS, and the values of other parameters. Statistical significance was accepted if p < 0.05. All statistical analyses were performed using SAS statistical software, version 8.2 (SAS Institute, Inc., Cary, NC, USA).
Results
Table 1 shows the clinical characteristics of control and diabetic subjects. Patients with T2D were older and predominantly male; a higher proportion of these patients smoked, had hypertension, and received anti-hypertensive medication. Furthermore, they had higher levels of BMI, WHR, SBP, fasting glucose, HbA1c, uric acid, blood urea nitrogen, creatinine, total white blood cell (WBC) count, hs-CRP, total PCS, and IS than controls. Also, they exhibited lower levels of serum total cholesterol, HDL-C, LDL-C, and eGFR than controls. Table 1 shows the comparison between T2D in patients with and without CAD. Patients with T2D and CAD were older and predominantly male. A significantly greater proportion of them smoked, had hypertension and/or dyslipidemia, were being treated with an anti-hypertensive drug, had higher WHR, fasting glucose, HbA1C, triglycerides, creatinine, total PCS, and IS levels, and had lower SBP, HDL-C, and eGFR levels. No significant difference in total PCS and IS levels was found between untreated T2D patients and patients treated with statins (5.5 ± 6.7 vs. 4.4 ± 5.3, p = 0.198 for total PCS; 1.8 ± 3.7 vs. 1.5 ± 4.1, p = 0.590 for IS).
Table 1. Clinical characteristics and biochemical measurements of study participants.
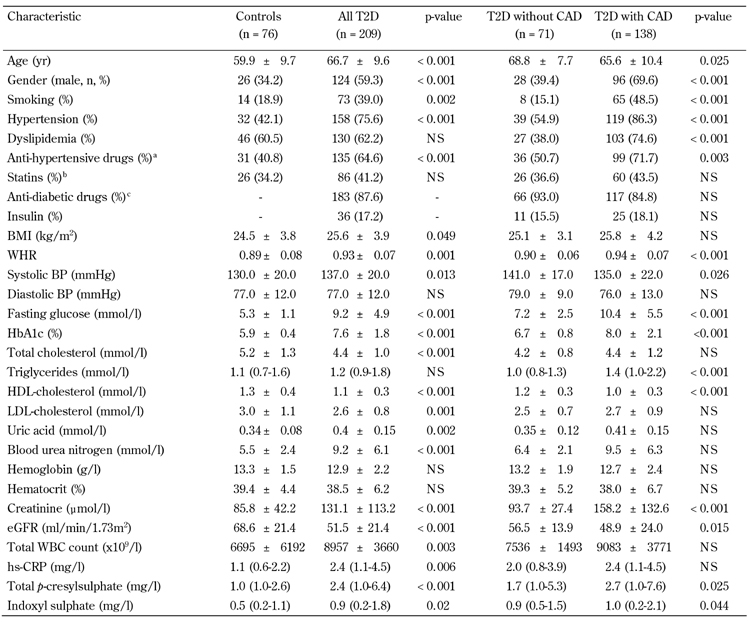
Legend: Data are mean ± SD, number (%), or median (interquartile range). CAD: coronary artery disease. BMI: body mass index. WHR: waist-to-hip ratio. BP: blood pressure. HDL: high-density lipoprotein. LDL: low-density lipoprotein. eGFR: estimated glomerular filtration rate. WBC: white blood cell. hs-CRP: highly sensitive C-reactive protein. NS: not significant. a Anti-hypertensive drugs: mainly angiotensin-converting enzyme inhibitors (captopril, enalapril, or lisinopril), with the addition of calcium antagonists or angiotensin II receptor antagonists (losartan) in some patients. b Statins: mainly atorvastatin and rosuvastatin. c Antidiabetic drugs: mainly metformin, sulphonylureas, α-glucosidase inhibitors, and thiazolidinediones.
Table 2 shows that decreased eGFR values, and increased total PCS and IS levels, were noted in 3-vessel disease and CAD patients. We subdivided the distribution of eGFR into pooled data, according to CKD classification status, to examine serum total PCS and IS levels with respect to risk for CAD in different CKD classification statuses. Stage 4 patients (eGFR < 29 ml/min/1.73 m2) had a significantly higher mean age, frequency of T2D, CAD, and 3-vessel disease, as well as higher WHR, fasting glucose, uric acid, creatinine, total WBC count, hs-CRP, adiponectin, visfatin, leptin, total PCS, and IS levels. However, they had lower BMI than did stage 1, 2, or 3 patients according to the CKD classification (Table 2).
Table 2. Comparison of clinical and biochemical characteristics by CKD classes.
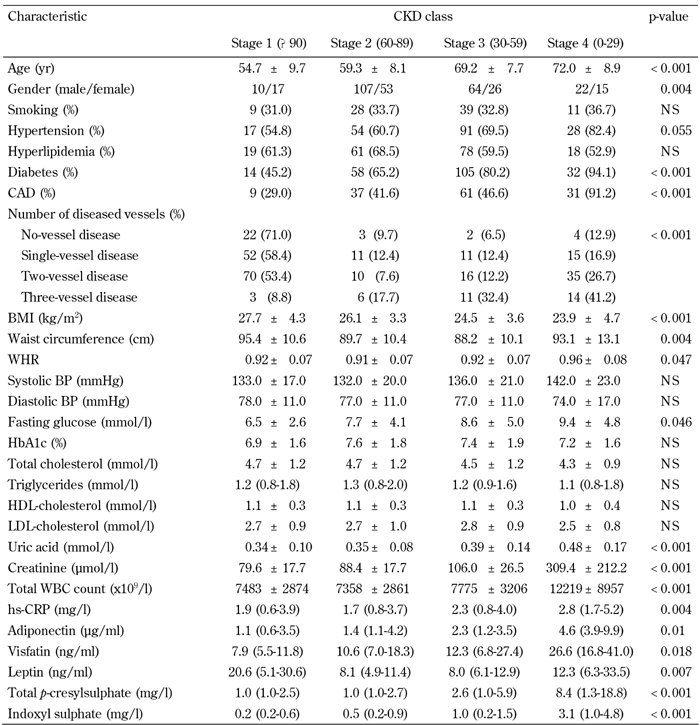
Legend: Data are mean ± SD, number (%), or median (interquartile range). CKD: chronic kidney disease. CAD: coronary artery disease. BMI: body mass index. BP: blood pressure. WHR: waist-to-hip ratio. BP: blood pressure. HDL: high-density lipoprotein. LDL: low-density lipoprotein. WBC: white blood cell. hs-CRP: highly sensitive C-reactive protein. NS: not significant.
Univariate and multivariate logistic regression analysis showed that serum total PCS and IS concentrations were significantly associated with CAD, even after controlling for anthropometric variables, BP, lipid profile, fasting glucose, eGFR, and smoking status (Table 3 and Figure 1). Moreover, serum levels of total PCS and IS were positively related to Agatston calcium scores, volume calcium scores, Gensini scores, adiponectin, visfatin, leptin, and total WBC count. These levels were negatively correlated with eGFR (all p < 0.05) (Table 4).
Table 3. Association of serum total p-cresylsulphate and indoxyl sulphate with coronary artery disease in fully adjusted models.
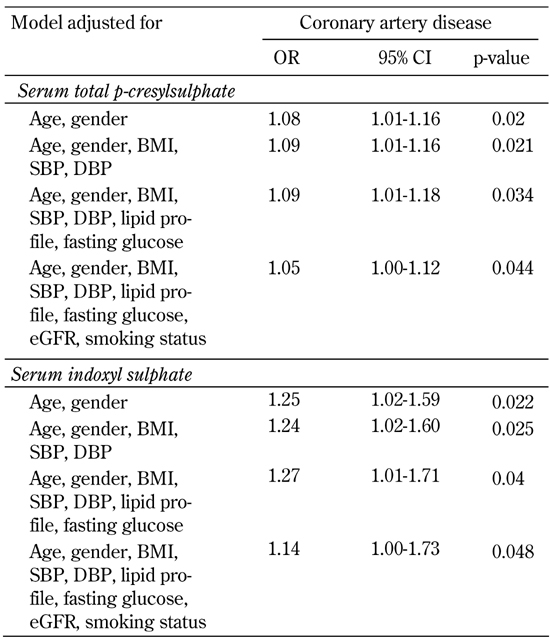
Legend: Results of multivariate logistic regression analysis are presented as odds ratios (OR) of increases in serum total p-cresylsulphate and indoxyl sulphate in CAD-positive patients. BMI: body mass index. SBP: systolic blood pressure. DBP: diastolic blood pressure. Lipid profile: including total cholesterol, triglyceride, LDL- and HDL-cholesterol. eGFR: estimated glomerular filtration rate.
Figure 1.
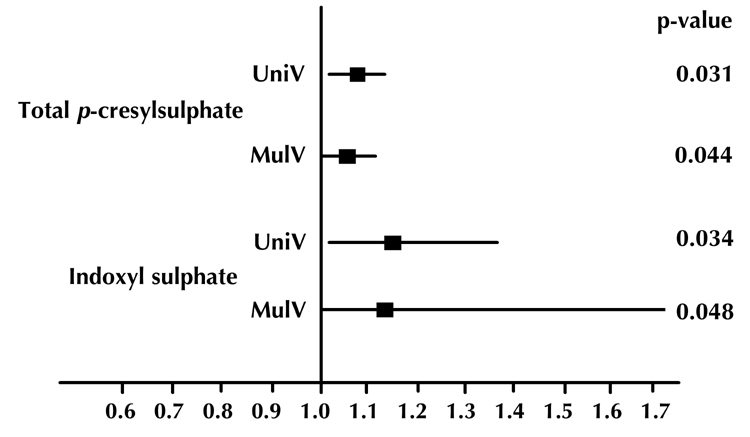
Odds ratios and 95% confidence intervals of univariate (UniV) and multivariate (MulV) analyses of total p-cresylsulphate and indoxyl sulphate on coronary artery disease.
Table 4. Pearson's correlation of total p-cresylsulphate and indoxyl sulphate levels with cardiovascular risk factors in patients with type 2 diabetes.
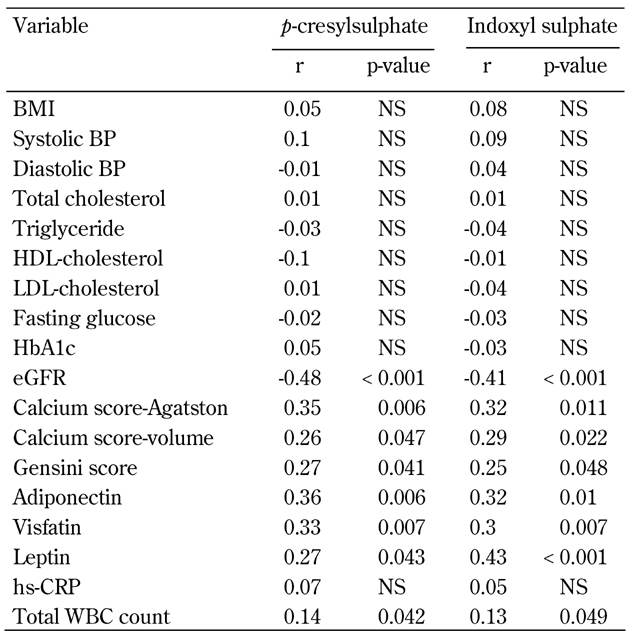
Legend: HDL: high-density lipoprotein. LDL: low-density lipoprotein. eGFR: estimated glomerular filtration rate. WBC: white blood cell. hs-CRP: highly sensitive C-reactive protein. NS: not significant.
Discussion
Previous research indicated that total PCS and IS play potential roles in the development of uremic vascular complications [23]. To our knowledge, the current study is the first report to address the significant association between total PCS and IS levels and CAD in T2D patients. It showed that total PCS and IS levels were significantly correlated with renal function deterioration. They were also related to Gensini scores, calcium scores, total WBC counts, and adipocytokines (adiponectin, visfatin, and leptin).
Diabetic nephropathy with GFR deterioration is a major factor in CKD etiology, and an important early complication linked with future diabetic cardiovascular morbidity and mortality [24, 25]. Current evidence shows that serum total PCS and IS increase markedly with a GFR of < 60 ml/h [26], and promote the progression of renal failure [27]. These are not only biomarkers for renal function, but actively participate in the development of diseases [27]. IS and PCS share various similarities, including their production by gut bacteria, metabolism by the kidney, strong albumin binding with low dialytic clearance [28], and a critical role in cardiovascular morbidity and mortality in advanced CKD patients [29, 30]. However, Meijers et al. demonstrated that total IS and PCS serum concentrations are not associated with each other in dialysis patients, pointing to different metabolic pathways, and non-interchangeable risk markers [31, 32].
Furthermore, there are several different molecular mechanisms between PCS and IS. PCS significantly increases the percentage of leukocytes displaying oxidative burst activity at baseline. It induces the shedding of endothelial microparticles in the absence of overt endothelial damage in vitro, and is independently associated with the number of endothelial microparticles in hemodialysis patients [33]. This suggests that PCS contributes to the propensity for vascular disease in patients with chronic renal failure. IS causes endothelial and vascular dysfunction by promoting vascular smooth muscle cell proliferation through the activation of platelet-derived growth factor receptors and mitogen-activated protein kinase pathways [34, 35]. These consequences are clinically associated with increased aortic calcification and vascular stiffness [30]. Moreover, IS and PCS share the same albumin binding site, for which they are clinically competitive binding inhibitors [31]. The consequence of diabetes-related CKD, with the accumulation of these two compounds, is that it has the capacity to interfere with both the kidney and the cardiovascular system. This causes a degree of endothelial damage that accelerates atherosclerosis and creates cardiovascular damage, as shown in our present study [26, 36-38].
An interesting finding of our study is that serum total PCS and IS levels are significantly, and positively, associated with total WBC counts and coronary inflammatory adipocytokines (e.g., adiponectin, leptin, and visfatin). The latter are classified into the middle molecules of uremic solutes, and accumulated when renal function deteriorates [39]. Our previous report showed that leukocytes are activated and secrete cytokines in the diabetic state, and that leptin stimulates leukocyte proliferation and differentiation which contributes to the development and progression of nephropathy in patients with T2D [40].
The relationship established by high total WBC counts and high adiponectin, leptin, and visfatin levels are significantly associated with coronary atherosclerosis, platelet function activation, increased incidence of acute coronary syndrome and major adverse cardiovascular events [41-46]. Moreover, the effects of specific uremic retention solutes (especially middle and protein-bound molecules) on platelet and leukocyte functions, suggest a role for these solutes in the initiation and progression of renal failure-related atherosclerosis [47]. However, elevated total PCS and IS concentrations, and their significant association with total WBC counts and adipocytokines in T2D patients with CAD, indicate that increased risk of coronary atherosclerosis in such patients may involve the aforementioned mechanisms.
Previous reports have demonstrated a gradual but significant increase in serum total PCS and IS, as CKD worsens. This has been associated with cardiovascular mortality risk [29, 30]. In the present study, the patients were divided into different stages of CKD, and showed a diversity of common measurable risk factors. Our findings suggest that serum total PCS and IS levels are novel predictors of renal progression. Also, they provide additional information beyond baseline renal function, as well as other traditional and uremia-related predictors. Furthermore, the diabetic CAD group had clinically more compromised renal function compared to the diabetic non-CAD group. This may cause impaired renal clearance, and lead to a marked increase in serum total PCS and IS concentrations. Also, it may contribute to coronary atherosclerosis in diabetic CAD patients; but further experience and more data are required to verify the statement.
Limitations of this study are firstly that blood samples were obtained without stopping the anti-diabetic medications in this group of patients. However, anti-diabetic drugs and insulin treatments were not significantly different between patients with T2D with, or without, CAD. Secondly, no free form of PCS or IS data were available in this study. In future studies, it would be interesting to investigate their relationships with diabetic nephropathy.
In conclusion, serum total PCS and IS levels were increased in patients with T2D and CAD. Elevated PCS and IS levels in these patients were associated with renal function deterioration, inflammation, and coronary atherosclerosis.
Disclosures (conflict of interests statement): The authors report no conflict of interests.
Acknowledgments
The authors thank the E-Da Hospital of Taiwan for financially supporting this research under contract EDAHP-99012. We would also like to thank Conmed Pharmaceutical and Biomedical Corporation, and Prevision Medical Corporation for providing us with total PCS and IS measurements. Finally, the authors are grateful to the staff and members of the diabetes and heart care team for their assistance in various measurements, and other organizational aspects of this study.
References
- 1.Haffner SM, Lehto S, Rönnemaa T, Pyörälä K, Laakso M. Mortality from coronary heart disease in subjects with type 2 diabetes and in nondiabetic subjects with and without prior myocardial infarction. N Engl J Med. 1998;339:229–234. doi: 10.1056/NEJM199807233390404. [DOI] [PubMed] [Google Scholar]
- 2.Atoh K, Itoh H, Haneda M. Serum indoxyl sulfate levels in patients with diabetic nephropathy: relation to renal function. Diabetes Res Clin Pract. 2009;83:220–226. doi: 10.1016/j.diabres.2008.09.053. [DOI] [PubMed] [Google Scholar]
- 3.Yamagishi S. Advanced glycation end products and receptor-oxidative stress system in diabetic vascular complications. Ther Apher Dial. 2009;13:534–539. doi: 10.1111/j.1744-9987.2009.00775.x. [DOI] [PubMed] [Google Scholar]
- 4.de Loor H, Bammens B, Evenepoel P, De Preter V, Verbeke K. Gas chromatographic-mass spectrometric analysis for measurement of p-cresol and its conjugated metabolites in uremic and normal serum. Clin Chem. 2005;51:1535–1538. doi: 10.1373/clinchem.2005.050781. [DOI] [PubMed] [Google Scholar]
- 5.Niwa T, Ise M. Indoxyl sulfate, a circulating uremic toxin, stimulates the progression of glomerular sclerosis. J Lab Clin Med. 1994;124:96–104. [PubMed] [Google Scholar]
- 6.De Smet R, David F, Sandra P, Van Kaer J, Lesaffer G, Dhondt A, Lameire N, Vanholder R. A sensitive HPLC method for the quantification of free and total p-cresol in patients with chronic renal failure. Clin Chim Acta. 1998;278:1–21. doi: 10.1016/s0009-8981(98)00124-7. [DOI] [PubMed] [Google Scholar]
- 7.Niwa T, Takeda N, Tatematsu A, Maeda K. Accumulation of indoxyl sulfate, an inhibitor of drug-binding, in uremic serum as demonstrated by internal-surface reversed-phase liquid chromatography. Clin Chem. 1988;34:2264–2267. [PubMed] [Google Scholar]
- 8.Martinez AW, Recht NS, Hostetter TH, Meyer TW. Removal of P-cresol sulfate by hemodialysis. J Am Soc Nephrol. 2005;16:3430–3436. doi: 10.1681/ASN.2005030310. [DOI] [PubMed] [Google Scholar]
- 9.Yu M, Kim YJ, Kang DH. Indoxyl sulfate-induced endothelial dysfunction in patients with chronic kidney disease via an induction of oxidative stress. Clin J Am Soc Nephrol. 2010 doi: 10.2215/CJN.05340610. In press. [DOI] [PMC free article] [PubMed] [Google Scholar]
- 10.Meijers BK, Van Kerckhoven S, Verbeke K, Dehaen W, Vanrenterghem Y, Hoylaerts MF, Evenepoel P. The uremic retention solute p-cresyl sulfate and markers of endothelial damage. Am J Kidney Dis. 2009;54:891–901. doi: 10.1053/j.ajkd.2009.04.022. [DOI] [PubMed] [Google Scholar]
- 11.Shimizu H, Hirose Y, Nishijima F, Tsubakihara Y, Miyazaki H. ROS and PDGF-beta receptors are critically involved in indoxyl sulfate actions that promote vascular smooth muscle cell proliferation and migration. Am J Physiol Cell Physiol. 2009;297:C389–C396. doi: 10.1152/ajpcell.00206.2009. [DOI] [PubMed] [Google Scholar]
- 12.Dou L, Jourde-Chiche N, Faure V, Cerini C, Berland Y, Dignat-George F, Brunet P. The uremic solute indoxyl sulfate induces oxidative stress in endothelial cells. J Thromb Haemost. 2007;5:1302–1308. doi: 10.1111/j.1538-7836.2007.02540.x. [DOI] [PubMed] [Google Scholar]
- 13.Dou L, Bertrand E, Cerini C, Faure V, Sampol J, Vanholder R, Berland Y, Brunet P. The uremic solutes p-cresol and indoxyl sulfate inhibit endothelial proliferation and wound repair. Kidney Int. 2004;65:442–451. doi: 10.1111/j.1523-1755.2004.00399.x. [DOI] [PubMed] [Google Scholar]
- 14.Wang CP, Lu LF, Yu TH, Hung WC, Chiu CA, Chung FM, Yeh LR, Chen HJ, Lee YJ, Houng JY. Serum levels of total p-cresylsulphate are associated with angiographic coronary atherosclerosis severity in stable angina patients with early stage of renal failure. Atherosclerosis. 2010;211:579–583. doi: 10.1016/j.atherosclerosis.2010.03.036. [DOI] [PubMed] [Google Scholar]
- 15.Alberti KG, Zimmet PZ. Definition, diagnosis and classification of diabetes mellitus and its complications. Part 1: diagnosis and classification of diabetes mellitus provisional report of a WHO consultation. Diabet Med. 1998;15:539–553. doi: 10.1002/(SICI)1096-9136(199807)15:7<539::AID-DIA668>3.0.CO;2-S. [DOI] [PubMed] [Google Scholar]
- 16.Expert Panel on Detection, Evaluation, and Treatment of High Blood Cholesterol in Adults. Executive summary of the third report of the National Cholesterol Education Program (NCEP) Expert Panel on Detection, Evaluation, And Treatment of High Blood Cholesterol In Adults (Adult Treatment Panel III) JAMA. 2001;285:2486–2497. doi: 10.1001/jama.285.19.2486. [DOI] [PubMed] [Google Scholar]
- 17.Gensini GG. A more meaningful scoring system for determining the severity of coronary heart disease. Am J Cardiol. 1983;51:606. doi: 10.1016/s0002-9149(83)80105-2. [DOI] [PubMed] [Google Scholar]
- 18.Wang CP, Hsu HL, Hung WC, Yu TH, Chen YH, Chiu CA, Lu LF, Chung FM, Shin SJ, Lee YJ. Increased epicardial adipose tissue (EAT) volume in type 2 diabetes mellitus and association with metabolic syndrome and severity of coronary atherosclerosis. Clin Endocrinol. 2009;70:876–882. doi: 10.1111/j.1365-2265.2008.03411.x. [DOI] [PubMed] [Google Scholar]
- 19.Chung FM, Yang YH, Shieh TY, Shin SJ, Tsai JC, Lee YJ. Effect of alcohol consumption on estimated glomerular filtration rate and creatinine clearance rate. Nephrol Dial Transplant. 2005;20:1610–1616. doi: 10.1093/ndt/gfh842. [DOI] [PubMed] [Google Scholar]
- 20.Wu IW, Hsu KH, Lee CC, Sun CY, Hsu HJ, Tsai CJ, Tzen CY, Wang YC, Lin CY, Wu MS. p-Cresyl sulphate and indoxyl sulphate predict progression of chronic kidney disease. Nephrol Dial Transplant. 2010 doi: 10.1093/ndt/gfq580. In press. [DOI] [PMC free article] [PubMed] [Google Scholar]
- 21.Lee CT, Kuo CC, Chen YM, Hsu CY, Lee WC, Tsai YC, Ng HY, Kuo LC, Chiou TT, Yang YK. et al. Factors associated with blood concentrations of indoxyl sulfate and p-cresol in patients undergoing peritoneal dialysis. Perit Dial Int. 2010;30:456–463. doi: 10.3747/pdi.2009.00092. [DOI] [PubMed] [Google Scholar]
- 22.Levey AS, Bosch JP, Lewis JB, Greene T, Rogers N, Roth D. A more accurate method to estimate glomerular filtration rate from serum creatinine: a new prediction equation. Modification of Diet in Renal Disease Study Group. Ann Intern Med. 1999;130:461–470. doi: 10.7326/0003-4819-130-6-199903160-00002. [DOI] [PubMed] [Google Scholar]
- 23.Vanholder R, Argiles A, Baurmeister U, Brunet P, Clark W, Cohen G, De Deyn PP, Deppisch R, Descamps-Latscha B, Henle T. et al. Uremic toxicity: present state of the art. Int J Artif Organs. 2001;24:695–725. [PubMed] [Google Scholar]
- 24.Zerbini G, Gabellini D, Ruggieri D, Maestroni A. Dysfunction of cellular transporters and predisposition to diabetic nephropathy. Curr Diabetes Rev. 2006;2:163–168. doi: 10.2174/157339906776818550. [DOI] [PubMed] [Google Scholar]
- 25.Aso Y. Cardiovascular disease in patients with diabetic nephropathy. Curr Mol Med. 2008;8:533–543. doi: 10.2174/156652408785747960. [DOI] [PubMed] [Google Scholar]
- 26.Vanholder R, Massy Z, Argiles A, Spasovski G, Verbeke F, Lameire N European Uremic Toxin Work Group. Chronic kidney disease as cause of cardiovascular morbidity and mortality. Nephrol Dial Transplant. 2005;20:1048–1056. doi: 10.1093/ndt/gfh813. [DOI] [PubMed] [Google Scholar]
- 27.Raff AC, Meyer TW, Hostetter TH. New insights into uremic toxicity. Curr Opin Nephrol Hypertens. 2008;17:560–565. doi: 10.1097/MNH.0b013e32830f45b6. [DOI] [PubMed] [Google Scholar]
- 28.Martinez AW, Recht NS, Hostetter TH, Meyer TW. Removal of P-cresol sulfate by hemodialysis. J Am Soc Nephrol. 2005;16:3430–3436. doi: 10.1681/ASN.2005030310. [DOI] [PubMed] [Google Scholar]
- 29.Liabeuf S, Barreto DV, Barreto FC, Meert N, Glorieux G, Schepers E, Temmar M, Choukroun G, Vanholder R, Massy ZA. et al. Free p-cresylsulphate is a predictor of mortality in patients at different stages of chronic kidney disease. Nephrol Dial Transplant. 2010;25:1183–1191. doi: 10.1093/ndt/gfp592. [DOI] [PubMed] [Google Scholar]
- 30.Barreto FC, Barreto DV, Liabeuf S, Meert N, Glorieux G, Temmar M, Choukroun G, Vanholder R, Massy ZA European Uremic Toxin Work Group (EUTox) Serum indoxyl sulfate is associated with vascular disease and mortality in chronic kidney disease patients. Clin J Am Soc Nephrol. 2009;4:1551–1558. doi: 10.2215/CJN.03980609. [DOI] [PMC free article] [PubMed] [Google Scholar]
- 31.Meijers BK, De Loor H, Bammens B, Verbeke K, Vanrenterghem Y, Evenepoel P. p-Cresyl sulfate and indoxyl sulfate in hemodialysis patients. Clin J Am Soc Nephrol. 2009;4:1932–1938. doi: 10.2215/CJN.02940509. [DOI] [PMC free article] [PubMed] [Google Scholar]
- 32.Enomoto A, Takeda M, Tojo A, Sekine T, Cha SH, Khamdang S, Takayama F, Aoyama I, Nakamura S, Endou H. et al. Role of organic anion transporters in the tubular transport of indoxyl sulfate and the induction of its nephrotoxicity. J Am Soc Nephrol. 2002;13:1711–1720. doi: 10.1097/01.asn.0000022017.96399.b2. [DOI] [PubMed] [Google Scholar]
- 33.Schepers E, Meert N, Glorieux G, Goeman J, Van der Eycken J, Vanholder R. P-cresylsulphate, the main in vivo metabolite of pcresol, activates leucocyte free radical production. Nephrol Dial Transplant. 2007;22:592–596. doi: 10.1093/ndt/gfl584. [DOI] [PubMed] [Google Scholar]
- 34.Shimizu H, Hirose Y, Nishijima F, Tsubakihara Y, Miyazaki H. ROS and PDGF-beta [corrected] receptors are critically involved in indoxyl sulfate actions that promote vascular smooth muscle cell proliferation and migration. Am J Physiol Cell Physiol. 2009;297:C389–C396. doi: 10.1152/ajpcell.00206.2009. [DOI] [PubMed] [Google Scholar]
- 35.Yamamoto H, Tsuruoka S, Ioka T, Ando H, Ito C, Akimoto T, Fujimura A, Asano Y, Kusano E. Indoxyl sulfate stimulates proliferation of rat vascular smooth muscle cells. Kidney Int. 2006;69:1780–1785. doi: 10.1038/sj.ki.5000340. [DOI] [PubMed] [Google Scholar]
- 36.Lindner A, Charra B, Sherrard DJ, Scribner BH. Accelerated atherosclerosis in prolonged maintenance hemodialysis. N Engl J Med. 1974;290:697–701. doi: 10.1056/NEJM197403282901301. [DOI] [PubMed] [Google Scholar]
- 37.Foley RN, Parfrey PS, Sarnak MJ. Epidemiology of cardiovascular disease in chronic renal disease. J Am Soc Nephrol. 1998;9:S16–S23. [PubMed] [Google Scholar]
- 38.Gris JC, Branger B, Vecina F, al Sabadani B, Fourcade J, Schved JF. Increased cardiovascular risk factors and features of endothelial activation and dysfunction in dialyzed uremic patients. Kidney Int. 1994;46:807–813. doi: 10.1038/ki.1994.336. [DOI] [PubMed] [Google Scholar]
- 39.Vanholder R, Van Laecke S, Glorieux G. The middle-molecule hypothesis 30 years after: lost and rediscovered in the universe of uremic toxicity? J Nephrol. 2008;21:146–160. [PubMed] [Google Scholar]
- 40.Chung FM, Tsai JC, Chang DM, Shin SJ, Lee YJ. Peripheral total and differential leukocyte count in diabetic nephropathy: The relationship of plasma leptin to leukocytosis. Diabetes Care. 2005;28:1710–1717. doi: 10.2337/diacare.28.7.1710. [DOI] [PubMed] [Google Scholar]
- 41.Madjid M, Awan I, Willerson JT, Casscells SW. Leukocyte count and coronary heart disease: implications for risk assessment. J Am Coll Cardiol. 2004;44:1945–1956. doi: 10.1016/j.jacc.2004.07.056. [DOI] [PubMed] [Google Scholar]
- 42.Piestrzeniewicz K, Luczak K, Goch JH. Value of blood adipose tissue hormones concentration - adiponectin, resistin and leptin in the prediction of major adverse cardiac events (MACE) in 1-year follow-up after primary percutaneous coronary intervention in ST-segment elevation acute myocardial infarction. Neuro Endocrinol Let. 2008;29:581–588. [PubMed] [Google Scholar]
- 43.Hung WC, Wang CP, Lu LF, Yu TH, Chiu CA, Chung FM, Chen HJ, Houng JY, Shin SJ, Lee YJ. Circulating adiponectin level is associated with major adverse cardiovascular events in type 2 diabetic patients with coronary artery disease. Endocr J. 2010;57:793–802. doi: 10.1507/endocrj.k10e-020. [DOI] [PubMed] [Google Scholar]
- 44.Bigalke B, Stellos K, Geisler T, Seizer P, Mozes V, Gawaz M. High plasma levels of adipocytokines are associated with platelet activation in patients with coronary artery disease. Platelets. 2010;21:11–19. doi: 10.3109/09537100903377584. [DOI] [PubMed] [Google Scholar]
- 45.Dahl TB, Yndestad A, Skjelland M, Oie E, Dahl A, Michelsen A, Damas JK, Tunheim SH, Ueland T, Smith C. et al. Increased expression of visfatin in macrophages of human unstable carotid and coronary atherosclerosis: possible role in inflammation and plaque destabilization. Circulation. 2007;115:972–980. doi: 10.1161/CIRCULATIONAHA.106.665893. [DOI] [PubMed] [Google Scholar]
- 46.Liu SW, Qiao SB, Yuan JS, Liu DQ. Association of plasma visfatin levels with inflammation, atherosclerosis, and acute coronary syndromes in humans. Clin Endocrinol. 2009;71:202–207. doi: 10.1111/j.1365-2265.2008.03453.x. [DOI] [PubMed] [Google Scholar]
- 47.Glorieux G, Cohen G, Jankowski J, Vanholder R. Platelet/leukocyte activation, inflammation, and uremia. Semin Dial. 2009;22:423–427. doi: 10.1111/j.1525-139X.2009.00593.x. [DOI] [PubMed] [Google Scholar]