Abstract
Cystathionine γ-lyase (CSE) is the major enzyme in vascular smooth muscle cells (SMCs) that catalyzes the endogenous production of H2S. Phenotypic switching of SMCs is affected by endogenous H2S level and alterations of this switching may result in vascular disorders. To date, the mechanisms underlying the alteration of CSE expression and H2S production in vascular proliferative diseases have been unclear. In the present study, we found that serum deprivation induced SMC differentiation marker gene expressions and increased CSE expression and H2S production in cultured human aorta SMCs (HASMCs). Carotid artery ligation in mice resulted in enhanced neointima formation and down-regulation of CSE expression, suggesting an important role of CSE in SMC differentiation. Transient transfection of HASMCs with human CSE (hCSE) promoter/luciferase reporter revealed that the region between −226 to +140 base pair contains the core promoter for the hCSE gene. Deletion and mutation analysis demonstrated that two specificity protein-1 (Sp1) consensus binding sites were present in the core promoter region of the hCSE gene. Incubation of HASMCs with Sp1 binding inhibitor mithramycin inhibited CSE mRNA expression in a dose-dependent manner. Overexpression of Sp1 alone was sufficient to increase the activity of the hCSE core promoter and CSE protein expression. Chromatin immunoprecipitation assay showed that the binding of Sp1 to the hCSE promoter was increased in differentiated HASMCs compared with that in proliferated HASMCs. Exogenously applied H2S at 100 μm stimulated SMC differentiation, which was reversed by p38 MAPK inhibitor SB203580. These results suggest that transcript factor Sp1 is a critical regulator of the hCSE expression during SMC differentiation, and CSE/H2S system is essential for maintenance of SMC phenotype.
Keywords: Cell Differentiation, Gene Regulation, Signal Transduction, Sp1, Transcription Promoter, Human Cystathionine Gamma-Lyase, Hydrongen Sulfide, Smooth Muscle Cells
Introduction
Vascular smooth muscle cells (SMCs)2 are highly specialized cells whose contractile status regulates blood vessel tone, blood pressure, and blood flow (1, 2). Vascular SMCs can alternate their phenotypes from contractile (differentiated) to synthetic (proliferated) phenotypes in response to extracellular cues (1–3). Concomitant with this phenotypic change, a variety of SMC differentiation-specific genes, including SM myosin heavy chain (SM-MHC), calponin, SM22α, SM α-actin, and smoothelin, are reduced (4, 5). SMC phenotypic switching is believed to play a key role in many cardiovascular diseases, such as hypertension, atherosclerosis, coronary heart diseases, postangioplasty restenosis, and transplantation arteriopathy (4, 6, 7).
In recent years, hydrogen sulfide (H2S) has emerged as a novel and important gasotransmitter for the cardiovascular system (8–10). CSE is the major H2S-producing enzyme in vascular tissues, and abnormal metabolism and functions of the CSE/H2S pathway have been linked to various cardiovascular diseases, including atherosclerosis and hypertension (9, 11, 12). CSE expression and H2S production were reduced during the development of atherosclerotic plaque in apolipoprotein E knock-out mice and neointimal hyperplasia induced by balloon injury in rats, and treatment with H2S significantly reversed these processes (11, 12). In both spontaneous hypertensive rats and experimental hypertensive animals, CSE expression and H2S production in vascular tissues were also significantly decreased, and exogenous administration of H2S attenuated the elevation of pressure and lessened the vascular structural remodeling during the development of hypertension (13, 14). Mice genetically deficient in CSE expression exhibited age-dependent uprising of blood pressure, decreased endogenous H2S level, and increased SMC proliferation (9, 15). These studies indicate that lower endogenous levels of H2S attributable to suppression of CSE expression could be pathogenic in diverse cardiovascular diseases. However, the mechanisms for altered CSE expression in these pathological conditions remain unclear. It is therefore essential to decipher signaling and regulatory pathways for abnormal expression and/or function regulation of CSE/H2S system in these pathological conditions.
In the current study, we demonstrated that CSE expression was reduced in proliferated SMCs and ligated carotid arteries accompanying with decreased expression of SMC differentiation marker genes. We also found that transcript factor specificity protein-1 (Sp1) is a critical regulator for CSE expression during SMC phenotype change, and the CSE/H2S system is required for maintenance of differentiated SMC phenotype.
EXPERIMENTAL PROCEDURES
Cell Culture
Human aorta SMCs (HASMCs) (American Type Culture Collection, Manassas, VA) were cultured with HAM's F-12K medium supplemented with 10% fetal bovine serum (Invitrogen), 100 units/ml penicillin and 100 μg/ml streptomycin, 30 mg/liter Endothelial Cell Growth Supplement, 10 mg/liter insulin, 10 mg/liter transferrin, 50 mg/liter ascorbic acid, 10 mm HEPES, 10 mm N-[Tris(hydroxymethyl)methyl]-2-aminoethanesulfonic acid, and 10 μg/l sodium selenite at 37 °C in a humidified chamber containing 5% CO2 (16, 17). The cells used in experiments were from passages 22–26. Confluent cultures were incubated in medium containing 10% serum for 5 days to achieve the postconfluent state. Serum was then withdrawn for 4 days to induce redifferentiation (18, 19). Proliferated HASMCs continually cultured in medium containing 10% serum were used as controls. Drosophila Schneider cells (SL2) (American Type Culture Collection) were cultured in Schneider's Drosophila medium (Invitrogen). For cell number count, HASMCs (4 × 10⁴) were seeded in 24-well plates and cultured in medium containing 10% serum for 5 days. After changed into serum-free medium for another 96 h, the cells were trypsinized, and the total number of cells were counted using a hemocytometer.
Single SMCs from mesenteric arteries of CSE knock-out mice and wild-type mice were isolated and identified as described previously (15). These SMCs were cultured in Dulbecco's modified Eagle's medium containing 10% supplemented fetal bovine serum, 100 units/ml penicillin, and 100 μg/ml streptomycin. The experiments were performed when the cells reached 70–80% confluence at passage 6.
Vascular Injury Model
All animal experiments were conducted in compliance with the Guide for the Care and Use of Laboratory Animals published by the U.S. National Institutes of Health (NIH Publication no. 85-23) and approved by the Animal Care Committee of Lakehead University. All animals were maintained on standard rodent chow and had free access to food and water. The carotid artery ligation model used in these experiments has been described previously (20, 21). Briefly, 8-week-old male WT mice were anesthetized by intraperitoneal injection of ketamine HCl and xylazine (80 mg/kg and 5 mg/kg of body weight, respectively). The left common carotid artery was dissected and ligated just proximal to its bifurcation with 5 to 0 silk ligatures. The animals were processed for morphological and biochemical studies 4 weeks after the initial surgery.
siRNA Transfection
Predesigned CSE-targeted siRNA (CSE-siRNA) was purchased from Ambion (Austin, TX). Negative siRNA, a 21-nucleotide RNA duplex with no known sequence homology with all the genes, was also from Ambion. Transfection of siRNA into HASMCs was achieved using the siPORTTM lipid transfection agent from Ambion (17). Briefly, postconfluent cells were starved overnight, and CSE-siRNA or negative siRNA at 100 nm and transfection reagent complex was added to the cells in serum-free medium for 4 h. Fresh normal growth medium with or without 10% serum was then added, and the cells were incubated for another 68 h.
Histology
Mice were euthanized and transcardially perfused with 4% paraformaldehyde in phosphate-buffered saline under physiological pressure. Fixed ligated arteries were embedded and frozen in Tissue-Tek Optimal Cutting Temperature media. Serial sections (5-μm thick) at 2 mm proximal to the ligated site were stained with hematoxylin and eosin (15).
Western Blotting
After different treatments, HASMCs or mesentery arteries from mice were obtained and lysed. Equal amounts of proteins were boiled and separated by SDS-PAGE and electrophoretically transferred to nitrocellulose membrane as described previously (16, 17). The dilutions of primary antibody were 1:1000 for CSE (Abnova), 1:100 for total and phosphorylated Sp1 (Santa Cruz Biotechnology, Santa Cruz, CA), 1:500 for SM-MHC, calponin, and SM-α-actin (Santa Cruz Biotechnology), and 1:10,000 for β-actin. Horseradish peroxidase-conjugated secondary antibody was used at 1:5000. The immunoreactions were visualized by ECL and exposed to x-ray film (Kodak Scientific Imaging film).
Real-time PCR Analysis
The total RNA from HASMCs or carotid arteries was isolated using TriReagent (New England Biolabs). First strand cDNA was prepared by reverse transcription using Moloney Murine Leukemia Virus reverse transcriptase and random hexamer primers according to the manufacturer's protocol (New England Biolabs). Real-time PCR was performed in an iCycler iQ5 apparatus (Bio-Rad) associated with the iCycler optical system software (version 3.1) using SYBR Green PCR Master Mix, as described previously (15). Briefly, all PCRs were performed in a volume of 20 μl, using 96-well optical grade PCR plates and an optical sealing tape. The cycling was conducted at 95 °C for 90 s followed by 38 cycles of 95 °C for 10 s and at 60 °C for 20 s. The primers of human CSE (hCSE) gene (GenBankTM accession no. NM_001902) were 5′-CCCCACAAACCCCACCCAGAA-3′ (forward, position 474–494) and 5′-GACACCAGGCCCATTAC-3′ (reverse, position 654–677). These primers produced a product of 204 bp. The primers of SM-MHC (GenBankTM accession no. NM_013607) were 5′-TGGAGCCGGAAAGACAGAGAACAC-3′ (forward, position 540–563) and 5′-TCCGGCGAGCAGGTAGTAGAAGA-3′ (reverse, position 848–870) with a product of 330 bp. The primers of calponin (GenBankTM accession no. BC138864.1) were 5′-AGAAGGCAGGAACATCATTGG-3′ (forward, position 474–494) and 5′-CTGCCGCTTGGTGCCTGGTG-3′ (reverse, position 662–681) with a product of 208 bp. The primers of β-actin were purchased from Ambion, which produce a product of 295 bp. A standard curve was constructed using a series of dilution of total RNA (Ambion) transcribed to cDNA using the same protocol outlined above to confirm the same amplifying efficiency in the PCR. A standard melting curve analysis was performed using the following thermal cycling profile: 95 °C for 10 s, 55 °C for 15 s, and ramping to 95 °C at 1° increments to confirm the absence of primer dimers. Relative mRNA quantification was calculated by using the arithmetic formula 2−ΔΔCT, where ΔCT is the difference between the threshold cycle of a given target cDNA and an endogenous reference β-actin cDNA.
H2S Production Measurement
H2S production rate was measured as described previously (8, 15). HASMCs were collected and homogenized in 50 mm ice-cold potassium phosphate buffer (pH 6.8). The cell homogenates were first incubated with l-cysteine (10 mm) for 90 min at 37 °C, and then trichloroacetic acid was added to stop the reaction. The level of methylene blue generated by the interaction of H2S with N,N-dimethyl-p-phenylenediamine sulfate was determined at 670 nm with a FLUOstar OPTIMA microplate spectrophotometer (BMG LABTECH).
Immunofluorescence Staining
HASMCs were fixed and permeabilized in a 50% acetone:50% methanol solution and subjected to staining using anti-calponin antibody conjugated with FITC and nuclear staining with DAPI (Invitrogen). Serial sections from ligated arteries were also stained overnight at 4 °C with anti-Sp1 antibody (1:50, Santa Cruz Biotechnology) in 1% normal goat serum following FITC-conjugated second antibody (1:2000). Images were captured and analyzed using an inverted Olympus IX70 fluorescence microscope (22).
Cloning and Analysis of hCSE Promoter
Various 5′-3′ deletion constructs of the hCSE gene, 2448-, 1216-, 366-, 261-, 216-, and 181-bp fragments relative to the starting site of opening reading frame, were generated from HASMCs. For construction of the hCSE promoter deletion constructs, the reverse primer for PCR was 5′-GAAGCTTTGCTGAACCGCGAAAG-3′, and the forward primers were as follows: 5′-AGGTACCTGGTGGCTGCATCTG (2448 bp), AGGTACCGAGCTGTTTATTCCTT (1216 bp), AGGTACCCCGCAGGGACTAAC (366 bp), AGGTACCAGCGGGAGACGCGTCG (261 bp), AGGTACTGATCGTGAGACTG (216 bp), and AGGTACCCCAACAATCGCTGTG (181 bp). PCR-amplified products were subcloned into pGL3-basic vector (Progema, Madison, WI) to generate pGL3–2448, pGL3–1216, pGL3–366, pGL3–261, pGL3–216, and pGL3–181, respectively. The plasmid vector carrying Sp1 (pcDNA3.1-Sp1) was a generous gift from Dr. Xuyu Zu (Tsinghua University) (23).
Site-directed Mutagenesis
Site-directed mutagenesis of Sp1 putative recognition sites was conducted using the QuikChange site-directed mutagenesis kit (Stratagene, La Jolla, CA) (24). pGL3–366 construct was used as a template. The oligonucleotides used for mutagenesis were 5′-gcactgggtggatcggtcgcggtgacgt-3′ (−170/−143) and 5′-gccgcgctggtccatccccactgtgatc-3′ (−79/−51). The altered nucleotides were underlined. All deletions and site-directed mutants were confirmed by DNA sequencing.
Transfection and Reporter Gene Assays
HASMCs (80% confluence unless otherwise mentioned) or SL2 cells were transfected with 0.5 μg of the hCSE promoter constructs or pGL3-basic vector with 0.1 μg of pRL-TK vector (Promega) containing Renilla luciferase reporter gene as an internal control. For Sp1 overexpression studies, 0.5 μg of pcDNA3.1-Sp1 vector or pcDNA3.1-control vector was transfected in the presence or absence of 0.5 μg of pGL3–366 construct. All transfections were performed with Lipofectamine 2000 (Invitrogen) in an OptiMEM medium (Invitrogen). At 48 h after transfection, the cells were harvested and lysed, and luciferase activities were measured with a Dual-Luciferase reporter assay kit (Promega).
ChIP Assay
HASMCs in 100-mm dishes were fixed directly by adding formaldehyde to culture medium for 10 min at 37 °C to cross-link protein to DNA (23). The fixed cells were harvested and prepared for ChIP assay following the manufacturer's instructions (Sigma). Briefly, the cells were scraped and resuspended in ChIP sonication buffer containing protease inhibitors. The cells were sonicated to shear DNA to lengths between 500 to 2000 bp. The sonicated supernatant was diluted with ChIP dilution buffer and incubated with antibody against Sp1 or nonspecific IgG antibody overnight at 4 °C with rotation. A fraction of the protein-DNA was not precipitated but set aside for the total chromatin examination (termed input). The chromatin-antibody complexes and the input were eluted, reversed, and purified. The aimed sequence containing the two Sp1 sites, spanning from the −194- to −28-bp region of the hCSE promoter, was amplified by PCR using primers (forward, 5′-GGACTCCAGCTTCACTCCGCTT-3′ and reverse, 5′-TTAGCGGGTCTGCAGTCTCACG-3′). A single 166-bp band was generated and electrophoresed on a 2% agarose stained with ethidium bromide. The input was used as a positive control. The PCR bands produced were sequenced to confirm their identity. Quantitative analysis of Sp1 and the hCSE gene interaction was determined by real-time PCR, and the binding intensity of Sp1 with the hCSE core promoter was normalized to the level of input by using the same primers.
Reagents
H2S stock solution was freshly prepared by directly bubbling distilled water with pure H2S gas (Praxair, Danbury, CT) to make the saturated H2S solution (0.09 m at 30 °C) (8). H2S stock solution was diluted to different concentrations into cell culture medium, and the pH of medium was adjusted to 7.4. Chemicals were all obtained from Sigma unless otherwise mentioned.
Statistical Analysis
Data are presented as means + S.E., representing at least three independent experiments. Statistical comparisons were made using Student's t test or one-way analysis of variance followed by a post hoc analysis (Tukey test) where applicable, and the significance level was set at p < 0.05.
RESULTS
Increased Expressions of CSE and SMC Differentiation Marker Genes in Serum-deprived HASMCs
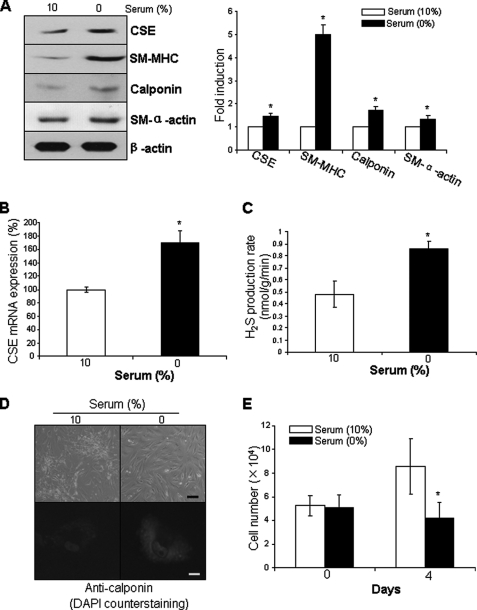
Cultured SMCs are highly dedifferentiated SMCs with reduced expressions of SMC differentiation marker genes. It is well established that serum deprivation can revert dedifferentiated SMCs to the differentiated state (18). To compare the expression of CSE between differentiated and proliferated SMCs, post-confluent HASMCs were deprived of serum for 96 h to induce redifferentiation. The expressions of SMC differentiation marker proteins, including SM-MHC, calponin, and SM α-actin, were increased in serum-derived HASMCs compared with proliferated HASMCs incubated with 10% serum (Fig. 1A). The expression of CSE protein and mRNA as well as the endogenous H2S production were decreased in proliferated HASMCs compared with differentiated HASMCs (Fig. 1, A–C). The staining intensity for calponin in differentiated SMCs was stronger than that in proliferative SMCs (Fig. 1D). Cell proliferation was observed in the presence of 10% serum, but not in serum-deprived HASMCs (Fig. 1E).
FIGURE 1.
Serum withdrawal induced the expressions of CSE and SMC differentiation marker genes. After postconfluent HASMCs were serum-deprived for 96 h to induce redifferentiation, the cells were collected and subjected to Western blotting analysis (A), real-time PCR analysis (B), H2S production rate measurement (C), cell immunofluorescence staining (D), or cell proliferation assay (E). Scale bar in D, 20 μm for the top panel and 5 μm for the bottom panel. In the bottom panel of D, Calponin in cytoplasm was stained with FITC, and nuclei were stained with DAPI. The data were from at least three independent experiments. *, p < 0.05 versus serum incubated cells in the same group.
Reduced Expressions of CSE and SMC Differentiation Marker Genes in Injured Vascular Tissues
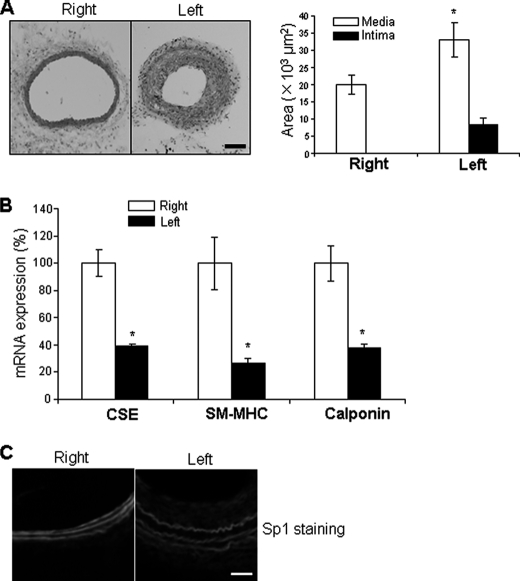
Reduced expression of CSE during vascular injury was confirmed using a mouse model of carotid artery ligation. Thickening of the arterial wall was observed in ligated left carotid arteries with significant intimal lesion formation but not in unligated right carotid arteries (Fig. 2A). CSE mRNA expression in ligated left carotid arteries was down-regulated compared with the unligated right carotid arteries (Fig. 2B). The expressions of SM-MHC and calponin mRNAs were also significantly decreased in injured carotid arteries (Fig. 2B). We further found that the immunostaining for Sp1 was very weaker in the ligated carotid arteries (especially in the intima) compared with that in unligated carotid arteries (Fig. 2C).
FIGURE 2.
Down-regulated expressions of CSE and SMC differentiation marker genes in ligated carotid arteries. Four weeks after ligation of the left carotid arteries from 8-week-old male WT mice, both the left and right carotid arteries were collected for histology study (A), real-time PCR analysis (B), and immunofluorescence staining (C), respectively. Quantitative analysis of media area and intima area in both left ligated and right control carotid arteries were shown in the right panel of A. Scale bar, 100 μm. A total of five mice were used for the histology study, and 11 mice were used for real-time PCR analysis. *, p < 0.05.
Functional Analysis of Sp1 Binding Sites within hCSE Promoter
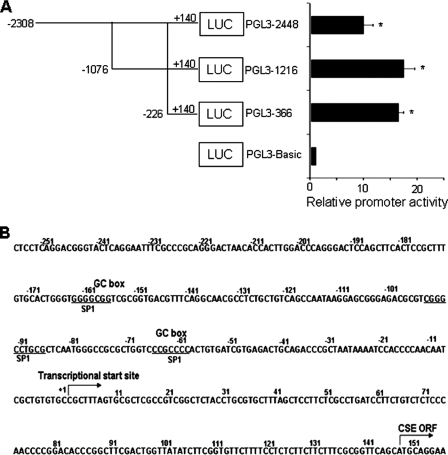
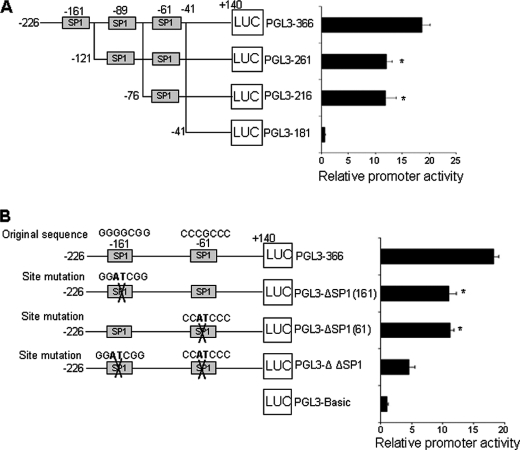
To identify potential cis-acting elements required for basal CSE promoter activity, we generated a series of 5′-3′-deleted luciferase reporter constructs, containing 2488-, 1216-, and 366-bp fragments of the hCSE promoter (Fig. 3A). Functional analysis of these constructs showed that a proximal promoter (pGL3–366) maintains high level of basal activity in HASMCs, which suggests that it would contain some important cis-acting elements. We then used the Promoter Scan program (Web Promoter Scan Service) to search for potential cis-elements in the 366 bp hCSE core promoter and found three putative Sp1 binding sites: −164/−158, −96/−86, and −66/−60 (Fig. 3B). To determine whether all three of these elements were responsible for basal activity of the hCSE core promoter, we further generated 5′-3′-deleted luciferase reporter constructs to delete one Sp1 binding site (pGL3–261), two Sp1 binding sites (pGL3–216), and all three Sp1 binding sites (pGL3–181), respectively. Deletion of −164/−158 Sp1 putative binding site (pGL3–261) significantly decreased the hCSE promoter activity compared with that of pGL-366; however, further deletion of −96/−86 Sp1 binding site (pGL3–216) did not lead to further reduction of luciferase activity. Complete deletion of all three Sp1 putative binding sites almost abolished the promoter activity, suggesting −164/−158 and −66/−60 Sp1 putative binding sites are critical for the hCSE promoter activity (Fig. 4A). We also mutated these two Sp1 binding sites. The mutation of Sp1 binding site(s) resulted in significant decrease of luciferase activity (Fig. 4B). These results confirmed that these two Sp1 binding sites are required for the hCSE core promoter activity.
FIGURE 3.
Analysis of the hCSE gene promoter activity in HASMCs. A, the 5′ deletion constructs of the promoter regions were schematically shown on the left panels. Nucleotides of fusion plasmids were numbered with respect to the transcriptional start site. Firefly luciferase activities were divided by the activities of Renilla luciferase (LUC) and expressed as relative activity divided by the promoter-less construct (PGL3-Basic). The results revealed −226/+140 as the hCSE core promoter. The data were from four independent experiments in duplicate. *, p < 0.05. B, the 5′-flanking regions containing the core promoter sequence of the hCSE gene. Transcription start site was indicated by the arrow and designated position +1. The putative consensus binding sequences for Sp1 were underlined.
FIGURE 4.
Deletion and mutation analysis of putative Sp1 binding sites in the hCSE core promoter. A, the 5′ deletion constructs of the hCSE core promoter regions were schematically shown on the left panels. Nucleotides of fusion plasmids were numbered with respect to the transcriptional start site. Firefly luciferase activities were divided by the activities of Renilla luciferase and expressed as relative activity divided by the promoter-less construct (PGL3-Basic). B, mutation for Sp1 binding sites diminished the hCSE promoter activity. The mutated sequences were shown in boldface type. The data in A and B were from four independent experiments in duplicate. *, p < 0.05.
Enhanced hCSE Promoter Activity and CSE Expression by Sp1 Overexpression
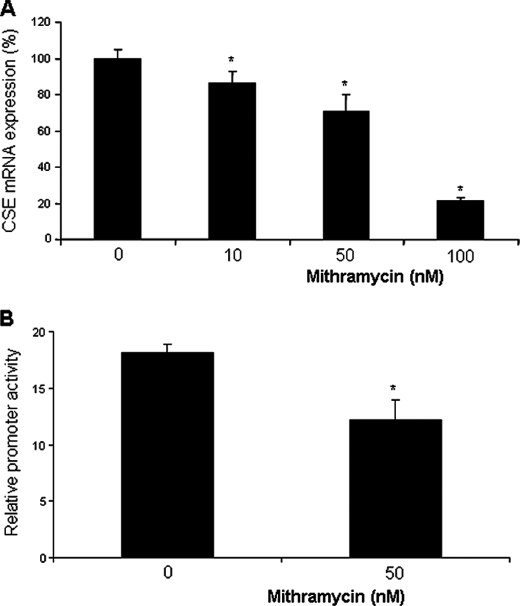
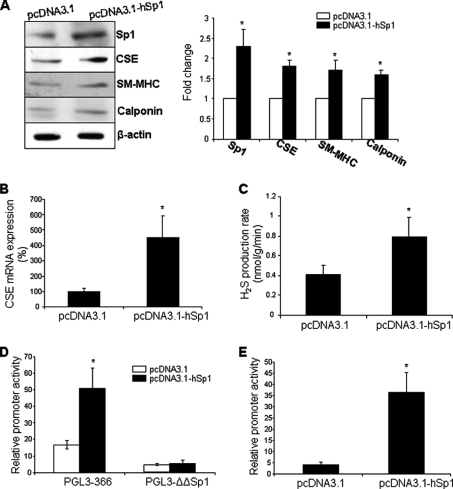
To further understand the role of Sp1 in CSE transcription, we assessed the effect of Sp1 binding inhibitor mithramycin on CSE mRNA expression and the hCSE core promoter activity in HASMCs. Mithramycin significantly reduced CSE mRNA expression in a dose-dependent manner (Fig. 5A). At 50 nm, mithramycin decreased CSE mRNA levels by 30.6 ± 5.6%. Mithramycin at 50 nm also produced considerable reduction of the promoter activity (Fig. 5B). We then evaluated the effects of Sp1 overexpression on CSE expression and promoter activity. Sp1 overexpression strikingly enhanced the expressions of CSE and H2S production as well as the hCSE core promoter activity, as compared with pcDNA3.1 control vector (Fig. 6, A–D). Sp1 also stimulated the expressions of SMC differentiation marker genes (Fig. 6A). In SL2 cells, a Sp1-null environment, the luciferase reporter activity was very low after transfection with the hCSE core promoter without supplying exogenous Sp1 cDNA. After SL2 cells were cotransfected with Sp1 cDNA, the relative hCSE promoter activity was increased significantly (Fig. 6E).
FIGURE 5.
Mithramycin inhibited CSE mRNA expression and the hCSE core promoter activity. A, after HASMCs were incubated with the Sp1 inhibitor mithramycin for 48 h, the cells were collected and processed for real-time PCR analysis. The CSE mRNA level was normalized to an internal standard gene β-actin. The data were from three independent experiments. *, p < 0.05. B, after HASMCs were transfected with the construct containing the hCSE core promoter region in the presence of 50 nm mithramycin, the cells were lysed and processed for luciferase activity analysis. The data were from three independent experiments in duplicate. *, p < 0.05.
FIGURE 6.
Sp1 induced CSE expression and the hCSE core promoter activity. Sp1 stimulated the expressions of CSE and SMC differentiation marker genes (A and B) as well as H2S production (C). After HASMCs were transfected with the construct pcDNA3.1-Sp1 or the control construct pcDNA3.1 for 48 h, the cells were lysed and processed for Western blotting (A), real-time PCR analysis (B), and measurement of H2S production (C). The data were from three independent experiments. *, p < 0.05. Sp1 also induced the hCSE core promoter activities in both HASMCs (D) and SL-2 cells (E). The cells were co-transfected with pcDNA3.1-Sp1 or pcDNA3.1 and hCSE core promoter construct PGL3–366 or mutated construct PGL3-ΔΔSp1 for 48 h. The data were from three independent experiments in duplicate. *, p < 0.05.
Increased Binding of Sp1 to hCSE Promoter in Differentiated SMCs
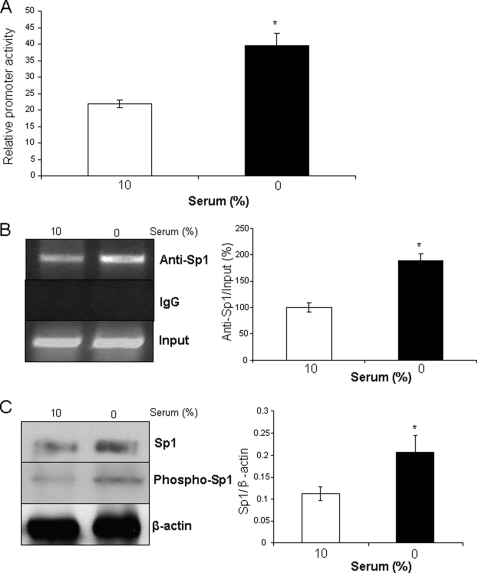
To examine whether Sp1 was capable of directing high expression level of CSE in differentiated SMCs, we performed luciferase assays in differentiated and proliferated HASMCs. There was a significant increase in the hCSE core promoter activity after HASMCs changed from a proliferated to a differentiated phenotype (Fig. 7A). We next analyzed the binding of Sp1 to the CSE gene using ChIP assay with primers that amplify the identified Sp1 binding sites in the hCSE core promoter. Sp1 bound to the hCSE promoter in both differentiated and proliferated HASMCs. However, serum deprivation stimulated more binding of Sp1 to the hCSE core promoter, as compared with that in the presence of 10% serum (Fig. 7B). The ChIP assay with anti-IgG failed to produce PCR products. Sp1 protein expression and phosphorylation were increased in serum-deprived HASMCs (Fig. 7C).
FIGURE 7.
Serum deprivation induced hCSE core promoter activity and stimulated the binding of Sp1 to hCSE core promoter. A, postconfluent HASMCs were cultured in serum-free medium for 48 h and then transfected with pGL3–366 for another 48 h at the same medium. After that, the cells were lysed and processed for luciferase activity analysis. The data were from three independent experiments. *, p < 0.05. B, after post-confluent HASMCs were serum-deprived for 96 h to induce redifferentiation, the cells were processed for ChIP assay with the antibody against Sp1. Quantitative analysis of Sp1 and hCSE core promoter interaction by real-time PCR was shown on the right panel. The data were from three independent experiments. *, p < 0.05. C, postconfluent HASMCs were cultured in serum-free medium for 96 h to induce redifferentiation, and the cells cultured with 10% serum acted as control. The data were from three independent experiments. *, p < 0.05.
Requirement of H2S for Maintenance of SMC Phenotype
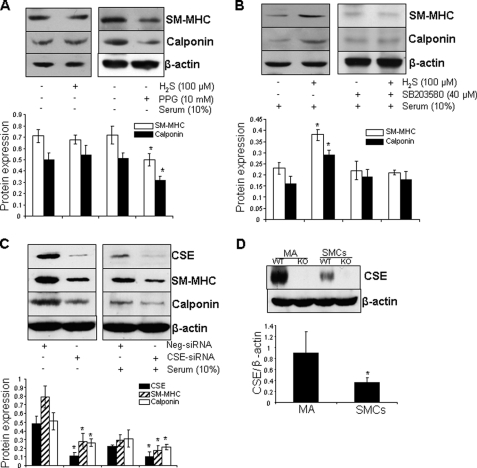
In the absence of serum, exogenous applied H2S (100 μm) did not change the expressions of SM-MHC and calponin in HASMCs; however, inhibition of endogenous H2S production by D,L-propargylglycine significantly repressed the expressions of SM-MHC and calponin (Fig. 8A). In contrast, in the presence of 10% serum, H2S strikingly induced the expressions of SMC differentiation maker genes in proliferated HASMCs. In addition, H2S-stimualted SMC differentiation maker gene expressions was reversed by co-treatment of the cells with SB203580 (40 μm), a p38 MAPK inhibitor (Fig. 8B). We further provided evidence that, in the presence or absence of serum, knockdown of CSE by CSE-specific siRNA significantly reduced the expressions of both SM-MHC and calponin (Fig. 8C). CSE expression was markedly decreased when SMCs were established in culture compared with that in mesentery arteries from mice (Fig. 8D).
FIGURE 8.
H2S was required for maintenance of SMC differentiation. A, inhibition of CSE activity reduced the expressions of SMC differentiation marker genes. Postconfluent HASMCs were serum deprived for 96 h in the presence of H2S (100 μm) or D,L-propargylglycine (10 mm). B, SB203580-reversed H2S induced the expressions of SMC differentiation maker genes. Postconfluent HASMCs were incubated with H2S (100 μm) or p38 MAPK inhibitor SB203580 (40 μm) in the presence of serum (10%) for 96 h. H2S was supplemented every 24 h. Quantitative analysis was shown in the bottom panel. *, p < 0.05 versus all other groups. C, knockdown of CSE by siRNA attenuated the expressions of SMC differentiation marker genes. Postconfluent HASMCs were transfected with CSE-siRNA or negative siRNA (Neg-siRNA) at 100 nm for 72 h in the presence or absence of serum. *, p < 0.05 versus the same group in negative siRNA-transfected cells. D, CSE expression in SMCs was reduced when established in culture. SMCs were isolated from mesentery arteries (MA) of both WT and KO mice. *, p < 0.05. The data were from at least three independent experiments.
DISCUSSION
Cell differentiation is a process by which multipotent cells in the developing organism acquire those cell-specific characteristics that distinguish them from other cell types. SMCs within adult blood vessels exhibit very low synthetic activity and express a unique repertoire of contractile proteins and signaling molecules required for the contractile function of the cell (1, 2). Upon vascular injury, SMCs are able to undergo a phenotypic change from a differentiated (contractile phenotype) to a dedifferentiated (synthetic phenotype) state, and the expressions of SMC differentiation marker genes are reduced (4, 5). A similar transition from a contractile to a synthetic phenotype occurs when SMCs are established in culture (18, 19). Dedifferentiated SMCs are able to change back into the differentiated phenotype, termed rediffereniation, a common cellular event in the recovery from vascular injury and regression of atherosclerosis in vivo (25). The molecular basis of SMC phenotypic change is still poorly understood.
CSE is an inducible enzyme in many types of cells, responsible for the production of H2S (11, 12, 26, 27). The present study confirmed that the expression of CSE mRNA was down-regulated in the ligated carotid artery accompanied by neointimal formation and reduced expressions of SMC differentiation marker genes (Fig. 2). When SMCs were established in culture, CSE expression was reduced significantly compared with that in the tissues of mesentery arteries (Fig. 8D). We hypothesized that SMCs would be mainly responsible for the reduced CSE expression during vascular injury and neointimal formation. As expected, serum withdrawal in cultured HASMCs induced redifferentiation and stimulated CSE expression at both mRNA and protein levels. In contrast, the expressions of CSE mRNA and protein as well as H2S production were significantly decreased in proliferated HASMCs induced by serum (Fig. 1). Our previous study demonstrated that treatment with H2S significantly reduced neointimal lesion formation by inhibiting SMC proliferation in rats (12). All of these findings beg the questions: how is CSE regulated during SMC phenotypic change, and does CSE/H2S play a role in regulating SMC differentiation?
Gene expression is finely controlled by the relative promoter sequence containing varying cis-acting elements in the 5′-flanking region. Transcription factors can bind to these specific cis-acting sequences to regulate transcription of the gene by assisting RNA polymerase binding (28, 29). Sp1, a zinc finger protein, is an important component of the eukaryotic cellular transcriptional machinery (30). The current study demonstrated that Sp1 is a critical regulator of the hCSE gene transcription during SMC phenotypic switching. Firstly, the hCSE gene core promoter contained two Sp1 binding sites, and deletion or mutation of these two Sp1 binding sites markedly decreased hCSE promoter activity (Figs. 3 and 4). Secondly, inhibiting Sp1 binding with mithramycin attenuated CSE mRNA expression and the hCSE core promoter activity (Fig. 5). Mithramycin is a drug that binds to GC-rich regions in chromatin and interferes with the transcription of genes that bear GC-rich motifs in their promoters (31). Third, in the absence of Sp1 in SL-2 cells, the hCSE core promoter activity was negligible; but Sp1 overexpression significantly stimulated hCSE core promoter activity in both SL-2 cells and HASMCs (Fig. 6). Fourth, ChIP assay confirmed Sp1 binds to the hCSE promoter at the predicted sites in HASMCs (Fig. 7). Furthermore, compared with proliferated HASMCs, hCSE core promoter activity was significantly higher in differentiated HASMCs, and there were more binding of Sp1 to the hCSE promoter in differentiated HASMCs. These observations suggest that serum withdrawal stabilizes Sp1 binding to the hCSE promoter. Increase in the binding of Sp1 after serum withdrawal could be due to an increase in Sp1 abundance. We therefore evaluated Sp1 protein abundance in differentiated SMCs versus proliferated SMCs. Western blotting analysis showed significant higher Sp1 protein expression in differentiated SMCs compared with that in proliferated SMCs (Fig. 7C). The induction of CSE mRNA and protein expressions after serum withdrawal correlated with the change in Sp1 protein expression. Posttranslational induction of Sp1 in differentiated SMCs may also contribute to transcriptional activation of CSE gene. It has been suggested that DNA binding activity of Sp1 can be modulated either positively or negatively by phosphorylation (32). The Sp1 protein contains consensus phosphorylation sites for many kinases including protein kinase A, protein kinase C, MAPK, casein kinases 1 and 2, and calmodulin kinases (33, 34). Here, we also found that serum withdrawal stimulated Sp1 phosphorylation in HASMCs. It is likely that different kinases or phosphatases target selected motifs of Sp1 in response to extracellular stimuli and thus alter Sp1 phosphorylation. Sp1 also can influence gene expression by changing its nuclear concentration and interacting with the promoter or by providing architectural support, serving as a co-factor, or by undergoing other chemical modification (35). The expression change of Sp1 protein and the posttranslational regulation of Sp1 protein during SMC phenotypic switching need to be further explored.
The fact that Sp1 increases CSE expression in differentiated SMCs raises the possibility that Sp1 may alter the expressions of multiple genes that contribute to phenotypic switching. Indeed, Sp1 has been shown to increase the expressions of many genes involved in regulating SMC proliferation. PPARα activated p16 gene transcription by interacting with Sp1 at specific proximal Sp1-binding sites of the p16 promoter, which leads to inhibition of SMC proliferation and intimal hyperplasia (36). Posttranslational induction of Sp1 DNA-binding activity contributed to the induction of p27 expression and SMC growth arrest at late time points after balloon angioplasty in rats (37). Sp1 is also an important transcriptional modulator of p21 (38). Sp1 overexpression inhibited proliferation and induced apoptosis in SMCs by stimulating the Fas ligand (39). In contrast, others have reported that a proproliferative role for Sp1 in SMCs (40, 41). Various factors, including species- and tissue-specific SMC, SMC growth density, and serum withdrawal time, resulted in these differences (18). The contribution of Sp1 to tumor cell differentiation has been the subject of intense investigation (42–45). In contrast to tumor cells, little is known about the role of Sp1 in promoting SMC differentiation. The present study first demonstrated the involvement of Sp1-stimulated CSE expression and H2S production during SMC differentiation. It is worthy noted here, although Sp1 is expressed ubiquitously, there are significant differences in the expression levels of Sp1 in different cell types (46). These facts suggest that the level of Sp1 protein in various tissues may contribute to the regulation of lineage-specific genes.
Another major finding of this study is the induction of SMC differentiation maker gene expressions by H2S in the presence but not absence of serum (Fig. 8). There were less CSE expression and H2S production in the presence of serum, and exogenous supplementation of H2S would overcome the absence of CSE, leading to increased expressions of SMC differentiation maker genes. H2S inhibited serum-stimulated SMC proliferation, which suggests that H2S may promote coordinated regulation of proliferation and contractile proteins expression to induce the differentiated SMC phenotype. The induction of cell differentiation by H2S in other cell types has been reported. Pronounced genetic differentiation was observed in extremophile fish when exposed to H2S (47). H2S stimulated epithelial cell differentiation by inducing intestinal expression of rhodanese (48). Differently, inhibition of CSE activity significantly decreased the expressions of SMC differentiation marker genes, indicating CSE/H2S signaling is essential for the maintenance of the contractile and differentiated SMC phenotype. These data are consistent with a model wherein CSE was listed as a potential cytoplasmic marker of hematopoietic differentiation (49). Human lymphoblastic leukemia cell lines CEM and Laz-221 contained undetectable CSE protein, corresponding to their behavior as cysteine auxotrophs. In contrast, nonmalignant lymphoblastoid lines contained easily detectable CSE protein, which correlates with their behavior as cysteine prototrophs, suggesting that this enzyme may be a useful marker of cellular differentiation (50, 51).
One more interesting finding in this study is that blockage of p38 MAPK reversed H2S-stimulated SMC differentiation maker gene expressions in HASMCs (Fig. 8B). The MAPK family represents important signal transduction machinery and occupies a central position in cell differentiation, growth, and apoptosis (52). Previous study has demonstrated that both ERK and p38 MAPK were activated by H2S incubation and down-regulation of ERK activity inhibited H2S-induced apoptosis in SMCs. However, inhibition of p38 MAPK did not alter the apoptotic sensitivity of HASMCs to H2S (16). It was questioned at that time what is the actual role of p38 MAPK stimulated by H2S in HASMCs. Here, we further provided evidence that p38 MAPK was involved in H2S-regulated SMC differentiation. Extensive studies have established the key role of serum response factor in regulating SMC differentiation (53, 54). p38 MAPK was shown to be associated with an increase in serum response factor-dependent transcription of SMC differentiation marker genes (53–55). Taking these observations together, it is reasonable to speculate that H2S may increase the interaction of serum response factor and SMC differentiation marker genes by stimulating the activation of p38 MAPK, and p38 MAPK plays a central role in the regulation of SMC phenotypic switching.
The transcriptional regulation of mouse CSE gene expression has been studied (56). Computer-assisted analysis of the promoter region of mouse CSE gene revealed the presence of a potential Sp1 binding site (5′-GAGGCGGGGC-3′) located within the −155/+27 region of the mouse CSE promoter, and deletion of Sp1 binding sites significantly decreased the basic promoter activity of mouse CSE gene in HEK-293 cells, but not in Cos-7 cells (56). Exposure of HEK-293 cells transfected with a vector containing the mouse CSE core promoter to nonsteroidal anti-inflammatory drugs inhibited Sp1 binding to the promoter and abrogated CSE expression (28). Species- and cell type-specific promoter activities have been indicated, and the most comprehensive comparisons for the promoter regions between human and mouse have been made (57, 58). For the genes involved in “stress response,” the promoter sequences were less conserved between human and mouse. Many genes, including APP and TAU genes, were differentially regulated in human and mouse (59, 60). The differences in their regulations could indicate pathways relevant to their specific roles in human-specific cognitive processes. Substantial differences exist between the human and mouse CSE promoters, and there is only 10% sequence homology between these two promoters. Although Sp1 stimulated both mouse and human CSE gene core promoter activity, there were two Sp1 binding sites in human CSE gene core promoter but only one in the mouse CSE gene core promoter. It should also be emphasized the regulation of human CSE gene transcription is a complex process, and this present study only indicates the contributions of Sp1 to this process but does not exclude other regulatory factors.
In summary, we have identified Sp1 as a critical activator of human CSE expression during SMC phenotypic switching. Serum withdrawal induced both Sp1 protein expression and Sp1 phosphorylation in association with increased CSE expression, and the CSE/H2S system is essential for the maintenance of SMC differentiation. Further investigation into the roles of CSE/H2S system during SMC differentiation, development and dysfunction will provide additional insight into the therapeutic value of H2S for vascular proliferative diseases by controlling SMC phenotype.
Acknowledgment
We greatly appreciate the gift of plasmid vector carrying Sp1 (pcDNA3.1-Sp1) from Dr. Xuyu Zu (Tsinghua University).
This work was supported by grants from Canadian Institutes of Health Research (to G. Y. and R. W.).
- SMC
- smooth muscle cell
- CSE
- cystathionine γ-lyase
- H2S
- hydrogen sulfide
- HASMC
- human aorta smooth muscle cell
- hCSE
- human CSE
- SM-MHC
- smooth muscle myosin heavy chain
- Sp1
- specificity protein-1.
REFERENCES
- 1. Owens G. K., Kumar M. S., Wamhoff B. R. (2004) Physiol. Rev. 84, 767–801 [DOI] [PubMed] [Google Scholar]
- 2. Metharom P., Caplice N. M. (2007) Curr. Vasc. Pharmacol. 5, 61–68 [DOI] [PubMed] [Google Scholar]
- 3. Hoofnagle M. H., Thomas J. A., Wamhoff B. R., Owens G. K. (2006) Arterioscler. Thromb. Vasc. Biol. 26, 2579–2581 [DOI] [PubMed] [Google Scholar]
- 4. Yoshida T., Owens G. K. (2005) Circ Res. 96, 280–291 [DOI] [PubMed] [Google Scholar]
- 5. Jain M. K., Layne M. D., Watanabe M., Chin M. T., Feinberg M. W., Sibinga N. E., Hsieh C. M., Yet S. F., Stemple D. L., Lee M. E. (1998) J. Biol. Chem. 273, 5993–5996 [DOI] [PubMed] [Google Scholar]
- 6. Sreejayan N., Yang X. (2007) Methods Mol. Med. 139, 283–292 [DOI] [PubMed] [Google Scholar]
- 7. Grond-Ginsbach C., Pjontek R., Aksay S. S., Hyhlik-Dürr A., Böckler D., Gross-Weissmann M. L. (2010) Cell Mol. Life Sci. 67, 1799–1815 [DOI] [PMC free article] [PubMed] [Google Scholar]
- 8. Zhao W., Zhang J., Lu Y., Wang R. (2001) EMBO J. 20, 6008–6016 [DOI] [PMC free article] [PubMed] [Google Scholar]
- 9. Yang G., Wu L., Jiang B., Yang W., Qi J., Cao K., Meng Q., Mustafa A. K., Mu W., Zhang S., Snyder S. H., Wang R. (2008) Science 322, 587–590 [DOI] [PMC free article] [PubMed] [Google Scholar]
- 10. Wang R. (2002) FASEB J. 16, 1792–1798 [DOI] [PubMed] [Google Scholar]
- 11. Wang Y., Zhao X., Jin H., Wei H., Li W., Bu D., Tang X., Ren Y., Tang C., Du J. (2009) Arterioscler. Thromb. Vasc. Biol. 29, 173–179 [DOI] [PubMed] [Google Scholar]
- 12. Meng Q. H., Yang G., Yang W., Jiang B., Wu L., Wang R. (2007) Am. J. Pathol. 170, 1406–1414 [DOI] [PMC free article] [PubMed] [Google Scholar]
- 13. Shi Y. X., Chen Y., Zhu Y. Z., Huang G. Y., Moore P. K., Huang S. H., Yao T., Zhu Y. C. (2007) Am. J. Physiol. Heart Circ. Physiol. 293, H2093–2100 [DOI] [PubMed] [Google Scholar]
- 14. Lu M., Liu Y. H., Goh H. S., Wang J. J., Yong Q. C., Wang R., Bian J. S. (2010) J. Am. Soc. Nephrol. 21, 993–1002 [DOI] [PMC free article] [PubMed] [Google Scholar]
- 15. Yang G., Wu L., Bryan S., Khaper N., Mani S., Wang R. (2010) Cardiovasc Res. 86, 487–495 [DOI] [PubMed] [Google Scholar]
- 16. Yang G., Sun X., Wang R. (2004) FASEB J. 18, 1782–1784 [DOI] [PubMed] [Google Scholar]
- 17. Yang G., Wu L., Wang R. (2006) FASEB J. 20, 553–555 [DOI] [PubMed] [Google Scholar]
- 18. Han M., Wen J. K., Zheng B., Cheng Y., Zhang C. (2006) Am. J. Physiol. Cell Physiol. 291, C50–58 [DOI] [PubMed] [Google Scholar]
- 19. Matsushita T., Rama A., Charolidi N., Dupont E., Severs N. J. (2007) Eur. J. Cell Biol. 86, 617–628 [DOI] [PubMed] [Google Scholar]
- 20. Hui D. Y. (2008) Curr. Drug Targets 9, 251–260 [DOI] [PMC free article] [PubMed] [Google Scholar]
- 21. Kumar A., Lindner V. (1997) Arterioscler. Thromb. Vasc. Biol. 17, 2238–2244 [DOI] [PubMed] [Google Scholar]
- 22. Sun X., Cao K., Yang G., Huang Y., Hanna S. T., Wang R. (2004) Biochem. Pharmacol. 67, 147–156 [DOI] [PubMed] [Google Scholar]
- 23. Zu X., Yu L., Sun Q., Liu F., Wang J., Xie Z., Wang Y., Xu W., Jiang Y. (2009) BMC Res. Notes. 2, 175 [DOI] [PMC free article] [PubMed] [Google Scholar]
- 24. Jiang B., Tang G., Cao K., Wu L., Wang R. (2010) Antioxid Redox Signal. 12, 1167–1178 [DOI] [PubMed] [Google Scholar]
- 25. Orr A. W., Hastings N. E., Blackman B. R., Wamhoff B. R. (2010) J. Vasc Res. 47, 168–180 [DOI] [PMC free article] [PubMed] [Google Scholar]
- 26. Zhu X. Y., Liu S. J., Liu Y. J., Wang S., Ni X. (2010) Cell Mol. Life Sci. 67, 1119–1132 [DOI] [PMC free article] [PubMed] [Google Scholar]
- 27. Fiorucci S., Antonelli E., Distrutti E., Rizzo G., Mencarelli A., Orlandi S., Zanardo R., Renga B., Di Sante M., Morelli A., Cirino G., Wallace J. L. (2005) Gastroenterology 129, 1210–1224 [DOI] [PubMed] [Google Scholar]
- 28. Kaczynski J., Cook T., Urrutia R. (2003) (2003) Genome. Biol. 4, 206 [DOI] [PMC free article] [PubMed] [Google Scholar]
- 29. Sellak H., Yang X., Cao X., Cornwell T., Soff G. A., Lincoln T. (2002) Circ. Res. 90, 405–412 [DOI] [PubMed] [Google Scholar]
- 30. Safe S., Abdelrahim M. (2005) Eur. J. Cancer. 41, 2438–2448 [DOI] [PubMed] [Google Scholar]
- 31. Blume S. W., Snyder R. C., Ray R., Thomas S., Koller C. A., Miller D. M. (1991) J. Clin. Invest. 88, 1613–1621 [DOI] [PMC free article] [PubMed] [Google Scholar]
- 32. Reisinger K., Kaufmann R., Gille J. (2003) J. Cell Sci. 116, 225–238 [DOI] [PubMed] [Google Scholar]
- 33. Wamhoff B. R., Hoofnagle M. H., Burns A., Sinha S., McDonald O. G., Owens G. K. (2004) Circ. Res. 95, 981–988 [DOI] [PubMed] [Google Scholar]
- 34. Armstrong S. A., Barry D. A., Leggett R. W., Mueller C. R. (1997) J. Biol. Chem. 272, 13489–13495 [DOI] [PubMed] [Google Scholar]
- 35. Schäfer D., Hamm-Künzelmann B., Brand K. (1997) FEBS Lett. 417, 325–328 [DOI] [PubMed] [Google Scholar]
- 36. Gizard F., Amant C., Barbier O., Bellosta S., Robillard R., Percevault F., Sevestre H., Krimpenfort P., Corsini A., Rochette J., Glineur C., Fruchart J. C., Torpier G., Staels B. (2005) J. Clin. Invest. 115, 3228–3238 [DOI] [PMC free article] [PubMed] [Google Scholar]
- 37. Andrés V., Ureña J., Poch E., Chen D., Goukassian D. (2001) Arterioscler. Thromb. Vasc. Biol. 21, 342–347 [DOI] [PubMed] [Google Scholar]
- 38. Santiago F. S., Ishii H., Shafi S., Khurana R., Kanellakis P., Bhindi R., Ramirez M. J., Bobik A., Martin J. F., Chesterman C. N., Zachary I. C., Khachigian L. M. (2007) Circ. Res. 101, 146–155 [DOI] [PubMed] [Google Scholar]
- 39. Kavurma M. M., Santiago F. S., Bonfoco E., Khachigian L. M. (2001) J. Biol. Chem. 276, 4964–4971 [DOI] [PubMed] [Google Scholar]
- 40. Chan J., Prado-Lourenco L., Khachigian L. M., Bennett M. R., Di Bartolo B. A., Kavurma M. M. (2010) Circ. Res. 106, 1061–1071 [DOI] [PubMed] [Google Scholar]
- 41. Santiago F. S., Khachigian L. M. (2004) Circ. Res. 95, 479–487 [DOI] [PubMed] [Google Scholar]
- 42. Ellenrieder V. (2008) Anticancer Res. 28, 1531–1539 [PubMed] [Google Scholar]
- 43. Takeda T., Sakata M., Isobe A., Yamamoto T., Nishimoto F., Minekawa R., Hayashi M., Okamoto Y., Desprez P. Y., Tasaka K., Murata Y. (2007) Placenta 28, 192–198 [DOI] [PubMed] [Google Scholar]
- 44. Okamoto Y., Sakata M., Yamamoto T., Nishio Y., Adachi K., Ogura K., Yamaguchi M., Takeda T., Tasaka K., Murata Y. (2001) Biochem. Biophys. Res. Commun. 288, 940–948 [DOI] [PubMed] [Google Scholar]
- 45. Sasagawa M., Yamazaki T., Endo M., Kanazawa K., Takeuchi S. (1987) Placenta 8, 515–528 [DOI] [PubMed] [Google Scholar]
- 46. Maruyama I., Zhou L., Sugar J., Yue B. Y. (2000) Curr. Eye Res. 21, 886–890 [DOI] [PubMed] [Google Scholar]
- 47. Plath M., Hauswaldt J. S., Moll K., Tobler M., García De León F. J., Schlupp I., Tiedemann R. (2007) Mol. Ecol. 16, 967–976 [DOI] [PubMed] [Google Scholar]
- 48. Ramasamy S., Singh S., Taniere P., Langman M. J., Eggo M. C. (2006) Am. J. Physiol. Gastrointest. Liver Physiol. 291, G288–296 [DOI] [PubMed] [Google Scholar]
- 49. Link D., Drebing C., Glode L. M. (1983) Blut. 47, 31–39 [DOI] [PubMed] [Google Scholar]
- 50. Glode L. M., Epstein A., Smith C. G. (1981) Cancer Res. 41, 2249–2254 [PubMed] [Google Scholar]
- 51. Klein C. E., Roberts B., Holcenberg J., Glode L. M. (1988) Cancer. 62, 291–298 [DOI] [PubMed] [Google Scholar]
- 52. Xia Z., Dickens M., Raingeaud J., Davis R. J., Greenberg M. E. (1995) Science 270, 1326–1331 [DOI] [PubMed] [Google Scholar]
- 53. Wang D. Z., Olson E. N. (2004) Curr. Opin. Genet. Dev. 14, 558–566 [DOI] [PubMed] [Google Scholar]
- 54. Wang Z., Wang D. Z., Hockemeyer D., McAnally J., Nordheim A., Olson E. N. (2004) Nature 428, 185–189 [DOI] [PubMed] [Google Scholar]
- 55. Deaton R. A., Su C., Valencia T. G., Grant S. R. (2005) J. Biol. Chem. 280, 31172–31181 [DOI] [PubMed] [Google Scholar]
- 56. Ishii I., Akahoshi N., Yu X. N., Kobayashi Y., Namekata K., Komaki G., Kimura H. (2004) Biochem. J. 381, 113–123 [DOI] [PMC free article] [PubMed] [Google Scholar]
- 57. Xuan Z., Wang J., Zhang M. Q. (2003) Genome Biol. 4, R1 [DOI] [PMC free article] [PubMed] [Google Scholar]
- 58. Ounallah-Saad H., Beeri R., Goshen I., Yirmiya R., Renbaum P., Levy-Lahad E. (2009) Gene. 446, 81–89 [DOI] [PubMed] [Google Scholar]
- 59. Gao L., Tucker K. L., Andreadis A. (2005) Biochim. Biophys Acta. 1681, 175–181 [DOI] [PubMed] [Google Scholar]
- 60. Ge Y. W., Ghosh C., Song W., Maloney B., Lahiri D. K. (2004) J. Neurochem. 90, 1432–1444 [DOI] [PubMed] [Google Scholar]


