

Abstract
FK506-binding proteins (FKBPs) are members of the immunophilins, enzymes that assist protein folding with their peptidyl-prolyl isomerase (PPIase) activity. Some non-immunosuppressive inhibitors of these enzymes have neuroregenerative and neuroprotective properties with an unknown mechanism of action. We have previously shown that FKBPs accelerate the aggregation of α-synuclein (α-SYN) in vitro and in a neuronal cell culture model for synucleinopathy. In this study we investigated whether acceleration of α-SYN aggregation is specific for the FKBP or even the PPIase family. Therefore, we studied the effect of several physiologically relevant PPIases, namely FKBP12, FKBP38, FKBP52, FKBP65, Pin1, and cyclophilin A, on α-SYN aggregation in vitro and in neuronal cell culture. Among all PPIases tested in vitro, FKBP12 accelerated α-SYN aggregation the most. Furthermore, only FKBP12 accelerated α-SYN fibril formation at subnanomolar concentrations, pointing toward an enzymatic effect. Although stable overexpression of various FKBPs enhanced the aggregation of α-SYN and cell death in cell culture, they were less potent than FKBP12. When FKBP38, FKBP52, and FKBP65 were overexpressed in a stable FKBP12 knockdown cell line, they could not fully restore the number of α-SYN inclusion-positive cells. Both in vitro and cell culture data provide strong evidence that FKBP12 is the most important PPIase modulating α-SYN aggregation and validate the protein as an interesting drug target for Parkinson disease.
Keywords: Immunophilin, Neurodegeneration, Parkinson Disease, Protein Isomerase, Synuclein, FK506-binding Proteins, Aggregation
Introduction
Parkinson disease (PD)2 is the second most common neurodegenerative disorder. Accumulating evidence points to a causative role for the protein α-synuclein (α-SYN) in PD (1–13), but the exact relationship between α-SYN aggregation and pathogenesis remains unresolved.
We have recently shown that FKBP12, a member of the FK506-binding proteins (FKBPs), accelerates the aggregation of α-SYN in vitro (14). Furthermore, we demonstrated that FKBP12 and FKBP52 also enhance the aggregation of α-SYN in a neuronal cell culture model for synucleinopathy (15). FK506, a small molecule inhibitor of the FKBPs, counteracts this effect in a dose-dependent way. In addition, knockdown of FKBP12 and FKBP52 decreased the number of α-SYN aggregates in this cellular model and protected against cell death.
FKBP12 and FKBP52 belong to the human FKBP family, of which currently 15 members have been identified. FKBPs are members of the immunophilins. These are enzymes that bind immunosuppressant drugs such as FK506 and have a peptidyl-prolyl cis-trans isomerase (PPIase) activity (16). They are able to accelerate the interconversion of cis-trans isomers of Xaa-Pro peptide bonds. This is an energy-demanding step in protein folding (17). Several other functions have also been assigned to the human FKBP family, such as regulation of Ca2+ levels in muscles (18, 19), regulation of immune activation (20), and chemotropic nerve guidance (21). In addition, it was also shown that immunophilin ligands, such as FK506, exhibit significant neuroregenerative and neuroprotective properties in cell culture and in animal models for neurodegeneration in general and in PD models in particular (22). Although the interaction with FKBP likely plays a role in these favorable properties, their mechanism of action is unknown. Currently there are four FKBPs known that are strongly expressed in the brain and in particular in the substantia nigra: FKBP12, FKBP38, FKBP52, and FKBP65. Several reports have already linked FKBP12 and/or FKBP52 to neurodegeneration (23–28). The mitochondrial FKBP38 (29) was reported to play a role in neurodegeneration through the regulation of cytochrome c release (30). Also, FKBP65 has a possible role in neurodegeneration through its association with Hsp90 and c-Raf-1 in a heterocomplex (31).
In addition to FK506-binding proteins, the immunophilin family also includes cyclophilins (CYPs), which bind cyclosporin A. Parvulins, the third family of PPIases, are not immunophilins because they do not bind calcineurin and are, therefore, unable to influence the activity of the immune system. All PPIases appear to function in a wide range of cellular activities (for review, see Ref. 32). Pin1, a human parvulin, has been associated with Alzheimer disease. By catalyzing the cis-trans isomerization of some peptide bonds (Ser(P)/Thr(P)-Pro) in Tau protein, Pin1 restores the ability of phosphorylated Tau to bind microtubules and promotes tau dephosphorylation by the PP2A phosphatase (33, 34). Although there is still some controversy in the field, Pin1 is also believed to interact with the C-terminal domain of the amyloid precursor protein (APP) via recognition of the phosphorylated Thr-688, influencing APP metabolism and toxic Aβ production (35–37). In contrast to the increasing evidence that Pin1 is crucial in the pathogenesis of Alzheimer disease, little is yet known about its involvement in PD. Ryo et al. (38) claimed that Pin1 plays a role in the aggregation and degradation of α-SYN as overexpression of Pin1 enhanced the formation of α-SYN inclusions, whereas dominant-negative Pin1 expression suppressed this process. Pin1 was also shown to accumulate in the Lewy bodies (LB) of PD tissue and to co-localize with α-SYN in a cell culture model for α-SYN aggregation (38).
Cyclosporin A, an inhibitor of CYPs, displays significant neurotrophic properties in different neurodegenerative models such as cerebral ischemia and traumatic brain injury, and it stimulates neurite outgrowth (39–43). Several groups ascribe these properties to the inhibition of cyclophilin D (44, 45), located in the mitochondrial matrix and part of the mitochondrial permeability transition pore. Recently, it has also been reported that cyclophilin A (CYPA) plays a role in neuronal protection in response to oxidative, ischemic, and traumatic injury (46, 47). Although the mechanism of this neuroprotection remains unclear, it has been suggested that CYPA functions as an antioxidant.
In this study we investigated if stimulation of α-SYN aggregation is a common property of the FKBP or even the PPIase family or is rather restricted to a specific FKBP(s). Therefore, we have studied the effect of several physiologically relevant PPIases on α-SYN aggregation in vitro and in neuronal cell culture.
EXPERIMENTAL PROCEDURES
Construction of Expression Plasmids and Purification of Recombinant Proteins
Recombinant α-SYN and Pin1 were purified as described before (14, 48). The FKBP38 (IMAGE ID 4299915), FKBP52 (IMAGE ID 3542330), FKBP65 (IMAGE ID 4154344), and CYPA cDNA (IMAGE ID 2986147) were ordered from Imagenes GmbH (Berlin, Germany). The pGEX2TK-FKBP12 plasmid was a generous gift of Dr. G. Bultynck (Laboratory of Physiology, K. U. Leuven).
The FKBP65 cDNA was cloned into pRSET A (Invitrogen), a prokaryotic expression vector that adds an N-terminal His tag to the recombinant protein. DNA sequencing confirmed the correct sequence and reading frame.
BL21-CodonPlus Escherichia coli cells (Stratagene, La Jolla, CA) were transformed with pRSET A-FKBP65. In the presence of 100 μg/ml ampicillin (VWR, Leuven, Belgium), transformed cells were grown to a 6-liter culture in LB medium at 37 °C. At an absorbance of 0.6, cultures were induced with 1 mm isopropyl 1-thio-β-d-galactopyranoside and left to shake for another 3 h at 30 °C. After harvesting by centrifugation (8300 × g, SLA 3000 rotor, Sorvall® RC-24 Refrigerated Superspeed Centrifuge), pellets were solubilized in sonication buffer (20 mm Hepes, pH 7.4, 100 mm NaCl, 0.05 mm EDTA, 1 mm PMSF, and 1 mm mercaptoethanol). The cells were disrupted by sonication with an MSE sonicator (MSE 150-watt Ultrasonic Desintegrator, Sussex, England). The cell lysate was centrifuged for 30 min at 4 °C and 30,600 × g in the Sorvall® centrifuge with SS-34 rotor. The supernatant was applied onto a Protino Ni-TED affinity column (Macherey Nagel, Düren, Germany). The column was washed with buffer (20 mm Hepes, pH 7.4, 100 mm NaCl) and eluted with the same buffer containing 200 mm imidazole. The protein fractions were analyzed with SDS-PAGE (4–12% Bis-Tris NUPage gels, Invitrogen). Fractions containing His-FKBP65 were pooled. The pooled His-FKBP65 was afterward dialyzed (20 mm Hepes and 150 mm NaCl) overnight to remove imidazole. The concentration of His-FKBP65 was calculated after determining the absorbance at 280 nm (ϵ = 59500 m−1cm−1).
The CYPA cDNA was cloned into pGEX2T (GE Healthcare), a prokaryotic expression vector that adds an N-terminal GST tag to the recombinant protein. After transforming BL21-CodonPlus E. coli cells, a 6-liter culture was grown to an absorbance of 0.6 in 2×YT (Yeast Extract Trypton) medium with 100 μg/ml ampicillin and induced with 0.1 mm isopropyl 1-thio-β-d-galactopyranoside for 4 h at 28 °C. After harvesting, pellets were solubilized in sonication buffer (PBS, 1% Triton, 5 mm DTT, 0.5 μg/ml leupeptin, 0.5 μg/ml aprotinin, 0.6 μg/ml pepstatin, 0.23 mm PMSF, and 0.83 mm benzamidine) and disrupted by sonication. The cell lysate was centrifuged for 30 min at 4 °C and 30,600 × g (Sorvall Centrifuge, SS-34 rotor). The supernatant was applied onto a glutathione-Sepharose 4B column (GE Healthcare) followed by a first washing step with PBS, 0.83 mm benzamidine, 0.23 mm PMSF, and 5 mm DTT and a second washing step with PBS. Overnight, 500 units of thrombin protease were applied to cleave the CYPA from the GST-tag. The following day flow-through fractions were analyzed with SDS-PAGE (4–12% Bis-Tris NUPage gels, Invitrogen) and fractions containing CYPA were pooled. The pooled CYPA was afterward applied on a benzamidine column (GE Healthcare) to remove excess thrombin. The peak fraction from this column was pooled, and the concentration of the CYPA protein was calculated after determining the absorbance at 280 nm (ϵ = 8605 m−1cm−1).
The FKBP12 and FKBP52 cDNA were cloned into the 6pGEX6p2 plasmid (GE Healthcare). This expression vector also contains a GST domain N-terminal to the multiple cloning site. Transformation, culture, and sonication were identical, as for the purification of CYPA. After centrifugation, the supernatant was applied onto a glutathione-Sepharose 4B column followed by a washing step with PBS, 0.83 mm benzamidine, 0.23 mm PMSF, and 5 mm DTT. The GST fusion protein was eluted with glutathione elution buffer (50 mm Tris, 20 mm reduced glutathione, pH 8.0). Fractions containing GST-FKBP12 or GST-FKBP52 were pooled after analysis with SDS-PAGE and dialyzed (20 mm Hepes and 150 mm NaCl) to remove glutathione. The concentration of both fusion proteins was calculated after determining the absorbance at 280 nm (ϵGST-FKBP12 = 52955 m−1cm−1, ϵGST-FKBP52 = 90000 m−1cm−1). The purity of all recombinant proteins was checked on SDS-PAGE after optimized Coomassie G-250 staining (SimplyBlueTM SafeStain, Invitrogen).
Peptidyl-Prolyl Cis-Trans Isomerase Activity
The method described by Küllertz et al. (49) was used to measure the cis-trans isomerase activity of the PPIases. 5 μl of chymotrypsin solution (1 g/liter in 35 mm Hepes, pH 7.8) was added to 1 μl of enzyme (10 or 1 μm in 35 mm Hepes, pH 7.8). The reaction was started by adding 100 μl of substrate (250 mg/liter). The substrates (Bachem, Torrance, CA) used to measure the enzymatic activity of the different PPlases were succ-Ala-Phe-Pro-Phe-4-nitroanilide (FKBPs, CYPA), succ-Ala-Glu-Pro-Phe-4-nitroanilide (FKBPs, Pin1), succ-Ala-His-Pro-Phe-4-nitroanilide (CYPA), and succ-Ala-Ala-Pro-Phe-4-nitroanilide (Pin1). Immediately after mixing, the absorbance at 390 nm was measured every second for 300 s. Measurements were performed at room temperature (±22 °C). Data were exported to GraphPad Prism 5 and fitted to Equation 1,
From the following equation, the specific enzymatic activity was calculated,
where k0 is the rate constant of the uncatalyzed reaction, kobs is the rate constant in the presence of enzyme, Km is the Michaelis-Menten constant, and [Enz] is the final concentration of PPIase.
Turbidity and Thioflavin T Fluorescence Measurements
Lyophilized α-SYN was dissolved in 20 mm Hepes buffer, pH 7.4, with 150 mm NaCl and 0.02% NaN3. Before each experiment, the pre-existing aggregates were removed from the sample by increasing the pH to 11 with NaOH (0.6 m) for 10 min to dissolve small oligomers and, immediately after lowering the pH again to 7.4, with HCl (0.6 m), a subsequent centrifugation step (10 min at 16,300 × g) to remove the larger aggregates (50). The sample was then analyzed by UV spectrophotometry to measure protein concentration. Assay solutions contained α-SYN at a concentration of 140 μm, 50 μm thioflavin T (Thio T, Sigma), and various concentrations of PPIases as indicated. A volume of 100 μl of the mixture was pipetted into a well of a flat-bottom black 96-well plate (Greiner Bio-One, Wemmel, Belgium). The plates were sealed with transparent microplate sealer (Greiner Bio-One), loaded into a fluorescence plate reader (Infinite M1000, TECAN, Mechelen, Belgium), and incubated at 37 °C under continuous shaking (3.5-mm amplitude) or without shaking. Every 900 s the turbidity of the samples was determined at 350 nm, and the thioflavin T fluorescence was detected at 482 nm (excitation at 446 nm). To reduce the number of data points and to simplify the graph, a running average was made of each consecutive set of 20 data points. All experiments were performed at least three times, and each graph is a representative example of those measurements. The data were fitted to a four-parameter sigmoidal model using Graphpad Prism 5 software (San Diego, CA),
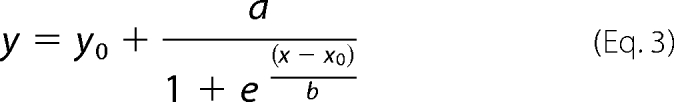 |
in which y is the turbidity or the thioflavin T fluorescence signal, x is the time, and y0 is the absorbance or the fluorescence at the beginning of the measurement. a is the total increase in absorbance or fluorescence, x0 is the half-time of aggregation, and 1/b describes the slope of the curve at its mid-point and is also the rate constant of aggregation at this point.
Cell Culture
Human neuroblastoma SHSY5Y cells were grown in Dulbecco's modified Eagle's medium (DMEM) (Invitrogen), 50 μg/ml gentamycin (Invitrogen), and 1% nonessential amino acids (Invitrogen) (referred to herein as DMEM-complete) at 37 °C and 5% CO2 in a humidified atmosphere.
Generation of Polyclonal Stable Overexpression Cell Lines Using Lentiviral Vectors
cDNAs encoding CYPA, Pin1, FKBP12, FKBP38, FKBP52, and FKBP65 were cloned into the pCHMWS-IRES-puro transfer plasmid, whereas the α-SYN cDNA was cloned into the pCHMWS-IRES-hygro transfer plasmid. Lentiviral vectors (LV) encoding α-SYN, CYPA, Pin1, FKBP12, FKBP38, FKBP52, or FKBP65 under control of the cytomegalovirus promoter were prepared in-house as described earlier with the triple transfection method using a transfer plasmid (see above), an envelope plasmid, and a packaging plasmid (51). The LV constructs allowed co-expression of the hygromycin (for α-SYN) or the puromycin (for CYPA, Pin1, FKBP12, FKBP38, FKBP52, and FKBP65) selection marker from the same transcript via an internal ribosome entry site. For transduction, 3 × 10⁶ SHSY5Y cells were plated in a 25-cm2 culture flask and grown in DMEM-complete. The following day unconcentrated vector was applied to the cells for 2 days, after which the vector-containing medium was replaced by DMEM-complete with 1 μg/ml puromycin or 200 μg/ml hygromycin according to the selection marker in the LV construct. Overexpression of the different proteins was controlled via Western blot after 3 days of selection. Using two different selection markers allowed us to make double overexpression SHSY5Y cell lines (α-SYN and CYPA, Pin1, FKBP12, FKBP38, FKBP52, or FKBP65).
Stable Knockdown of FKBP12
A stable FKBP12 knockdown cell line was generated as described before (15). This cell line is further mentioned as shFKBP12. After transduction of SHSY5Y cells with this LV and selection with hygromycin, the expression of FKBP12 was verified by Western blot. All cell lines (overexpression and knockdown lines) were kept in culture no longer than 10 passages to avoid loss of cells with strongest overexpression or knockdown levels.
Western Blotting
Cells were plated in 24-well plates (2.5 × 10⁵ cells/well). After 2 days, cells were washed with PBS and lysed in 50 μl of 1% SDS solution. The SDS cell extracts were boiled for 2 min followed by 6 passages through a 30-gauge G insulin syringe. 10 μg of protein of the cell extracts were separated on 4–12% sodium dodecyl sulfate-polyacrylamide gels and electroblotted onto polyvinylidene difluoride membranes (Bio-Rad). Membranes were blocked with 4% milk supplemented with 0.05% Tween 80 and incubated with specific antibodies against FKBP12 (rabbit polyclonal antibody, 1:5000 dilution, Affinity BioReagents, Golden, CO 80403), FKBP38 (mouse monoclonal antibody, 1:500 dilution, Santa Cruz Biotechnology, Santa Cruz, CA), FKBP52 (mouse monoclonal antibody, 1:2000 dilution, Enzo Life Sciences, Farmingdale, NY), FKBP65 (mouse monoclonal antibody, 1:2000 dilution, BD Transduction Laboratories, San Jose, CA), CYPA (rabbit polyclonal antibody, 1:500 dilution, Abcam, Cambridge, UK), or Pin1 (rabbit polyclonal antibody, 1:500 dilution, Santa Cruz Biotechnology) and α-SYN (rabbit polyclonal antibody, 1:2000 dilution, Chemicon, Temecula, CA). α-Tubulin antibody (mouse monoclonal antibody, 1:10000 dilution, Sigma) was used to control for equal loading. Detection was performed using chemiluminescence (ECL+-kit, GE Healthcare) and a horseradish peroxidase-conjugated secondary antibody (Dako, Heverlee, Belgium). Quantification of the density of the bands was performed with MultiGauge V3.2 software (Fujifilm, Dusseldorf, Germany). With a loading control taken into account, the net density of each band was calculated as the difference between the density in a window delimiting the band and the density of a window of the same size in a part of the membrane representative of the background. Results of independent Western blots were expressed as relative overexpression compared with endogenous levels (absorbance units = 1).
Immunocytochemistry
For immunocytochemistry, cells were grown on 12-mm diameter, gelatin-coated (2% gelatin from porcine skin type A, Sigma) round glass plates within the wells of a 24-well plate (5 × 10⁵ cells/well). For visualization of the mitochondria, cells were stained with 500 nm Mitotracker Deep Red (Invitrogen) for 45 min. Cells were fixed with 4% formaldehyde for 15 min after an initial wash step with PBS. After a blocking step with 2% BSA, 40 mm NH4Cl, and 0.05% Tween 20 in PBS for 1 h, cells were incubated overnight with primary antibody (specific antibodies against FKBP12 (rabbit polyclonal antibody, 1:1000 dilution, Affinity BioReagents), FKBP38 (mouse monoclonal antibody, 1:50 dilution, Santa Cruz Biotechnology), FKBP65 (mouse monoclonal antibody, 1:1000 dilution, BD Transduction Laboratories), CYPA (rabbit polyclonal antibody, 1:50 dilution, Santa Cruz Biotechnology), Pin1 (rabbit polyclonal antibody, 1:50 dilution, Santa Cruz Biotechnology), α-SYN (rabbit polyclonal antibody, 1:200 dilution, Chemicon, or mouse monoclonal antibody, 1:50 dilution, Santa Cruz Biotechnology), and the ER membrane marker calnexin (rabbit polyclonal antibody, 1:100 dilution, Abcam)) in PBS with 0.05% Tween 20. After washing twice with PBS for 15 min, the cells were incubated for 1 h with secondary antibody (Alexafluor 488 or 633-conjugated antibodies, Invitrogen, 1:500 dilution). After a second washing step with PBS (2 times 15 min), the cells were incubated with DAPI (1:10000 in PBS) for 1 h and washed again with PBS twice for 15 min. Thereafter, the glass plates were mounted on a microscope slide with Mowiol solution (Sigma). Fluorescence was detected with the 488 argon-ion laser, the 633 helium-neon laser and 405 diode for the DAPI staining with a laser scanning microscopy unit (LSM 710, Carl Zeiss, Jena, Germany). Images were further analyzed using Zeiss co-localization software.
Synucleinopathy Cell Culture Model
We used the cell culture model described by Ostrerova-Golts et al. (52) to induce α-SYN aggregation with a few modifications as previously described (15). Cells were plated in 96-well plates (1.5 × 10⁴ cells/well). The next day cells were treated for 72 h with 100 μm H2O2 and 5 mm freshly prepared FeCl2 in DMEM-complete and filtered through a 0.20-μm filter (Corning Inc., New York, NY). Different concentrations of FK506 (a stock solution in DMSO was diluted 100-fold, Sigma) were added to this stress-inducing medium. The control condition received a similar amount of DMSO. After 3 days, cells were washed with PBS and fixed with 4% formaldehyde for 15 min. Cells were stored in PBS until analysis.
High Content Analysis of α-SYN Aggregation and Cell Death
To quantify α-SYN aggregation and apoptosis in our synucleinopathy cell culture model, we used the IN Cell Analyzer 1000 and IN Cell Investigator software (GE Healthcare) as described before (15). Samples were prepared as follows. After fixation, the cells were incubated with 0.05% Thioflavin S (Sigma) for 20 min and washed twice with 70% ethanol for 2 min. Next, the cells in the wells were incubated with DAPI (1:10000 in PBS) until analysis with the IN Cell Analyzer 1000. For each cell line tested, at least 60 wells from 7 independent measurements (7 ≤ n ≤ 13 for all cell lines tested) were examined to obtain statistical information unless indicated otherwise.
Immunohistochemistry
Substantia nigra tissue sections from a PD patient (Braak stage 6) and a healthy control were obtained from the Dutch brain bank. Tissue sections were deparaffinized in xylene and rehydrated in respectively 100, 90, and 70% ethanol and demineralized water. The tissue slides were pretreated with 10 mm Tris, 1 mm EDTA buffer for 20 min at 98 °C. After extensive washing with PBS, the slides were then treated with PBS containing 10% goat serum and 0.1% Triton X-100 for blocking and then incubated with primary antibody (specific antibodies against ubiquitin (rabbit polyclonal antibody, 1:250 dilution, Dako), FKBP12 (rabbit polyclonal antibody, 1:250 dilution, Affinity BioReagents), FKBP38 (mouse monoclonal antibody, 1:50 dilution, Santa Cruz Biotechnology), FKBP52 (mouse monoclonal antibody, 1:250 dilution, Enzo Life Sciences), FKBP65 (mouse monoclonal antibody, 1:250 dilution, BD Transduction Laboratories), CYPA (rabbit polyclonal antibody, 1:50 dilution, Santa Cruz Biotechnology), Pin1 (rabbit polyclonal antibody, 1:50 dilution, Santa Cruz Biotechnology), and α-SYN (in-house rabbit polyclonal antibody, 1:1000 dilution, or mouse monoclonal antibody, 1:50 dilution, Invitrogen)) overnight at 4 °C in a humidified chamber. After washing with PBS, the slides were then incubated with secondary antibody (Alexafluor 488- or 555-conjugated antibodies, Invitrogen, 1:250 dilution) for 2 h. Immunohistochemical analysis was performed with the 488 argon-ion laser and 561 diode with a laser scanning microcopy unit (LSM 710).
Statistical Analysis
GraphPad Prism 5 was used for all statistical analyses. For multiple group comparisons, the non-parametric Kruskal-Wallis test was used followed by a post test (Dunn's) to correct for multiple testing. A p value < 0.05 is indicated by a single asterisk, p < 0.01 by double asterisks, and p < 0.001 by triple asterisks. To rule out experimental variations, all data were expressed as relative values to control cells (negative control (NC)).
RESULTS
We have previously demonstrated that FKBP12 and FKBP52 stimulate the aggregation of α-SYN in vitro and/or in live cells (14, 15). To further broaden our study and to find out if this is a common property of all PPIases or in particular of (one or a few members of) the FKBP family, we expanded our search to other PPIases. Based on their high expression in the brain and possible relevance in PD, we selected FKBP38, FKBP52, and FKBP65 (three human FKBPs), Pin1, and CYPA (the prototype proteins of the human parvulins and cyclophilins, respectively).
Enzymatic Characterization of Different PPIases
To study the effect of FKBP52, FKBP65, Pin1, and CYPA on the aggregate and fibril formation of α-SYN in vitro, recombinant proteins were produced and purified (see “Experimental Procedures” and supplemental Fig. S1). FKBP38 was not included in these in vitro studies because the PPIase activity of this protein is only induced after formation of a FKBP38/calmodulin-Ca2+ complex (30). Furthermore, calmodulin can interact with the N terminus of α-SYN, reducing α-SYN aggregation (53). Because Ca2+ itself can also affect α-SYN aggregation (54), it would be ambiguous to determine whether the effect of a FKBP38/calmodulin-Ca2+ complex on the aggregation of α-SYN is solely due to the induced enzymatic activity of FKBP38. As positive controls, we included FKBP12 and FKBP52 because both proteins were shown before to enhance α-SYN aggregation in SHSY5Y cells (15). For FKBP12, but not for FKBP52, we had already characterized its effect on α-SYN aggregation in vitro (55).
First we measured the enzymatic activity of all recombinant proteins tested (Table 1). We used a common spectrophotometric assay that measures the rate of the cis-to-trans conformational change of the peptide bond preceding Pro of an N-succinyl-AFPF-p-nitroanilide substrate for FKBP12, FKBP52, FKBP65, and CYPA and a N-succinyl-AEPF-p-nitroanilide substrate for Pin1 (49). The values obtained for FKBP12, CYPA, and Pin1 were comparable with reported activities (56–58), whereas for FKBP52 and FKBP65 the measured activities were 40-fold higher than reported in literature (56, 59). The enzymatic activity of the PPIases remained stable at 37 °C for 10 days (supplemental Table S1), whereas heat inactivation (5 min at 95 °C) of the recombinant proteins abrogated their enzymatic activity (data not shown). We further confirmed that the measured PPIase activity was specific for the used substrates by testing all recombinant PPIases against less reactive substrates. The enzymatic activity against these PPIase substrates was indeed low and comparable with literature data (supplemental Table S2) (60, 61).
TABLE 1.
Enzymatic activities of different peptidyl-prolyl cis-trans isomerases
Specific enzymatic activities (kcat/Km) were determined as described under “Experimental Procedures.” Assays were performed with purified proteins by monitoring the absorbance of released 4-nitroanilide (pNA) with the use of chymotrypsin as an isomer-specific protein. All reactions were performed in 35 mm Hepes buffer, pH 7.8, at room temperature (±22 °C). S.E. (n = 4), and literature data for the same substrate are shown for each protein.
| Protein | Substrate |
kcat/Kma |
|
|---|---|---|---|
| Calculated values | Literature values | ||
| m−1/s−1 | |||
| GST-FKBP12 | Succ-AFPF-pNA | 2.8 ± 0.4 × 10⁶ | 2 × 10⁶ Ref. (56) |
| GST-FKBP52 | Succ-AFPF-pNA | 3.0 ± 0.7 × 10⁶ | 7.3 × 10⁴ Ref. (56) |
| His-FKBP65 | Succ-AFPF-pNA | 1.3 ± 0.6 × 10⁶ | 3.4 × 10⁴ Ref. (59) |
| CYPA | Succ-AFPF-pNA | 3.1 ± 0.7 × 10⁶ | 8.7 × 10⁶ Ref. (57) |
| Pin1 | Succ-AEPF-pNA | 8.4 ± 1.7 × 10⁶ | 3.4 × 10⁶ Ref. (58) |
PPIases Stimulate α-Synuclein Aggregation in Vitro
We monitored the effect of the selected PPIases on the kinetics of α-SYN fibril and overall aggregate formation by Thio T fluorescence and turbidity measurements, respectively. Thio T is a fluorescent dye that interacts preferentially with the cross β-plate structure of amyloid-like fibrils, causing a large increase in its fluorescence intensity. Simultaneously we measured the turbidity signal reflecting the presence of large aggregates that cause light absorbance or scattering. The kinetics of α-SYN fibrillation and aggregation are represented by sigmoidal curves, representing a lag phase, a growth phase, and an equilibrium phase (62, 63). Examples of such aggregation curves measured with Thio T fluorescence and turbidity are shown in Figs. 1 and 2.
FIGURE 1.

Impact of PPIases on α-SYN fibril formation. 140 μm α-SYN was incubated at 37 °C with or without PPIases under continuous shaking (3.5 mm amplitude). α-SYN samples without the addition of PPIase were used as the negative control and are indicated as Blank. Time-dependent fibril formation of α-SYN in the absence or presence of different concentrations of FKBP12 (A), FKBP52 (B), FKBP65 (C), CYPA (D), or Pin1 (E) was measured using Thio T fluorescence. Data points were fitted to Equation 3 for a sigmoidal curve. F shows magnification of blank sample used in A, B, C, D, and E.
FIGURE 2.

Impact of PPIases on α-SYN aggregation measured by turbidity. 140 μm α-SYN was incubated at 37 °C with or without PPIase under continuous shaking (3.5 mm amplitude). α-SYN samples without the addition of PPIase were used as the negative control and are indicated as Blank. Turbidity measurement of time-dependent aggregation of α-SYN in the absence or presence of different concentrations of FKBP12 (A), FKBP52 (B), FKBP65 (C), CYPA (D), or Pin1 (E). Data points were fitted to Equation 3 for a sigmoidal curve. F shows magnification of blank sample used in A, B, C, D, and E.
α-SYN samples with and without PPIases were shaken to accelerate the aggregation (64). Time-dependent changes in the Thio T fluorescence intensity during α-SYN fibrillation were followed at different concentrations (10 μm, 1 μm, 10 nm, and 100 pm) of FKBP12 (Fig. 1A), FKBP52 (Fig. 1B), FKBP65 (Fig. 1C), CYPA (Fig. 1D), and Pin1 (Fig. 1E). The aggregation curves were fitted with a sigmoidal curve with four parameters (Equation 3) to obtain the half-time and amplitude of α-SYN fibril formation (supplemental Table S3). Our data show that the three FKBPs tested (FKBP12, FKBP52, and FKBP65) all enhance the rate of α-SYN fibril formation at micromolar concentrations (Fig. 1, A–C and supplemental Table S3), although only FKBP12 accelerated aggregation at 100 pm, in agreement with our previous results (14, 55) (Fig. 1A). In the latter study we described a complex biphasic behavior of FKBP12 on α-SYN fibril formation. In accordance with these data, the stimulating effect of FKBP12 on the fibril formation rate was observed in 2 concentration ranges: 100 pm and above 1 μm (55). Micromolar concentrations of all FKBPs tested and subnanomolar concentrations of FKBP12 also enhanced the amount of fibrillar aggregates as shown by the amplitude of the curves (Fig. 1, A–C and supplemental Table S3). Micromolar concentrations of CYPA and Pin1 stimulated the fibril formation as well when taking into account the half-time of aggregation, but their effect on the total number of fibrils formed was much less pronounced than for the FKBPs (Fig. 1, D and E, and supplemental Table S3). For the different PPIases, turbidity measured in parallel largely confirmed the Thio T fluorescence data (Fig. 2 and supplemental Table S4). Micromolar concentrations of all FKBPs tested reduced the half-time of aggregation and enhanced the total number of aggregates formed compared with control conditions without the addition of FKBP. Likewise, 100 pm FKBP12 stimulated the α-SYN aggregation rate and the amount of aggregates as measured with turbidity. Pin1 had no effect on the half-time of aggregation and the total number of aggregates formed. In accord with the Thio T fluorescence results, micromolar concentrations of CYPA enhanced the aggregation rate and the total number of α-SYN aggregates. Again, the observed effect of CYPA was much smaller than the stimulatory effect of the FKBPs.
Differential Effects of PPIases on α-SYN Aggregation in Vitro
The previous data indicated that FKBP12, FKBP52, and FKBP65 all stimulate α-SYN aggregation in vitro. At micromolar concentrations, no significant quantitative difference was detected between the different FKBPs. However, the aggregation assay includes rapid shaking of the plate between the measurements to accelerate α-SYN aggregation. Because a recent paper (64) states that the hydrophobic surface of air bubbles formed by agitation accelerates α-SYN aggregation, we reasoned that without agitation, quantitative differences between FKBPs on the acceleration of α-SYN aggregation may become more pronounced. Therefore, we repeated the in vitro aggregation assay without shaking. Now indeed, differences in specificity between the different FKBPs were evidenced (Fig. 3). Thio T fluorescence measurements revealed that all three FKBPs enhanced the total number of fibrils formed and the aggregation rate but to a different extent. The acceleration was most pronounced for 10 μm FKBP12 (x0 = 26.7 ± 1.2 h) followed by FKBP52 (x0 = 64.2 ± 15.4 h) and FKBP65 (x0 = 149.7 ± 25.6 h). Half-times of the blank α-SYN samples and the samples with 10 μm CYPA and Pin1 could not be calculated, as these samples were still not aggregating after 30 days of incubation (data not shown). Again, the turbidity data were similar to the Thio T fluorescence results (data not shown).
FIGURE 3.

Thio T fluorescence measurement of α-SYN aggregation without shaking. 140 μm α-SYN was incubated at 37 °C with or without PPIase without agitation. α-SYN samples without PPIase were used as the negative control and are indicated as Blank. Time-dependent fibril formation of α-SYN in the absence or presence of 10 μm of FKBP12, FKBP52, FKBP65, CYPA, and Pin1 was measured using Thio T fluorescence.
Subcellular Co-localization of PPIases and α-SYN
To investigate the effect of the different PPIases (CYPA, Pin1, FKBP38, and FKBP65) on α-SYN aggregation in live cells, we generated stable cell lines by transduction of α-SYN-overexpressing neuroblastoma (SHSY5Y) cells with LV coding for CYPA, Pin1, FKBP12, FKBP38, or FKBP65. A Western blot confirmed the overexpression of the specific transgenes in the different cell lines (see Fig. 5C).
FIGURE 5.

Overexpression of FKBPs enhances α-SYN aggregation and apoptosis in cell culture. High content analysis of α-SYN aggregation (A) and nucleus fragmentation (B) in SHSY5Y cells overexpressing α-SYN and CYPA, Pin1, FKBP12, FKBP38, or FKBP65 after 3 days of oxidative stress is shown. Error bars show the S.E. A Western blot (C) shows stable expression of α-SYN and Pin1, CYPA, FKBP12, FKBP38, or FKBP65 after transduction with respective LV. In each lane cell extract containing 10 μg of total protein was loaded. Upper panel, Pin1, CYPA, FKBP12, FKBP38, or FKBP65 expression was visualized in SHSY5Y cells overexpressing α-SYN only (NC) (lanes 1, 3, 5, 7, and 9) or in combination with Pin1 (lane 2), CYPA (lane 4), FKBP38 (lane 6), FKBP65 (lane 8), or FKBP12 (lane 10). Middle panel, stable α-SYN overexpression is shown. Lower panel, α-tubulin is shown as the loading control. Semiquantitative estimates of CYPA, Pin1, FKBP12, FKBP38, and FKBP65 overexpression levels are shown in D. Relative density values show x-fold overexpression of different PPIases compared with endogenous levels (absorbance units (au) = 1). S.E. is shown for each condition (n = 3).
The subcellular localization of overexpressed CYPA, Pin1, FKBP12, FKBP38, and FKBP65 in the α-SYN overexpression cell lines and the co-localization with α-SYN was investigated by confocal fluorescence microscopy. To confirm specificity of the immunocytochemical stainings, α-SYN-overexpressing cells without PPIase overexpression were used as a negative control (data not shown). As expected, individual cells in the generated polyclonal cell lines displayed different expression levels of the proteins. α-SYN, CYPA (Fig. 4A), and FKBP12 (Fig. 4C) were primarily localized in the cytoplasm, whereas Pin1 (Fig. 4B) showed a strong cytoplasmic and weak nuclear staining. The heterogeneous distribution, granular staining, and perinuclear enrichment of FKBP38 (Fig. 4D) and FKBP65 (Fig. 4E) was indicative of an association with intracellular organelles, respectively, mitochondria and endoplasmic reticulum, as reported before (29, 65). Double staining of FKBP38 with Mitotracker Deep Red 633 confirmed that FKBP38 is indeed localized to the mitochondria (co-localization coefficient = 68.3 ± 1.7%) (Fig. 4F). Double staining of FKBP65 with the ER marker calnexin proved the ER localization of FKBP65 (co-localization coefficient = 67.8 ± 1.1%) (Fig. 4G). The co-localization coefficients of the different PPIases with α-SYN were also quantified and found to be equal to 63.3 ± 2.7% (CYPA), 52.0 ± 1.1% (Pin1), 72.8 ± 3.7% (FKBP12), 35 ± 1.4% (FKBP38), and 35 ± 5% (FKBP65). Among all PPIases investigated, FKBP12 displayed the highest extent of co-localization with α-SYN.
FIGURE 4.

Subcellular localization of α-SYN and CYPA, Pin1, FKBP12, FKBP38, or FKBP65. Confocal microscopy of subcellular localization of α-SYN and CYPA (A), Pin1 (B), FKBP12 (C), FKBP38 (D), or FKBP65 (E) in cell lines that stably overexpress the respective PPIases is shown. Co-localization of FKBP38 with Mitotracker Deep Red 633 in FKBP38 overexpression cell line is shown in F. Co-localization of FKBP65 with the ER marker calnexin in FKBP65 overexpression cell line is shown in G. DAPI staining (1) is shown in blue. Immunocytochemical staining for CYPA, Pin1, FKBP12, FKBP38, or FKBP65 is shown in red (2). Immunocytochemical staining for α-SYN and calnexin or Mitotracker Deep Red 633 staining is shown in green (3). Overlap image (4). The bars represent 10 μm.
Overexpression of FKBPs Enhances α-SYN Aggregation and Apoptosis in Live Cells
We previously optimized a cell culture assay in which oxidative stress produced by Fe2+ and H2O2 induces α-SYN aggregation (15). FKBP12 and FKBP52 significantly enhanced the aggregation of α-SYN in this cell culture model for synucleinopathy. To address whether other PPIases (CYPA, Pin1, FKBP38, and FKBP65) also affect the formation of α-SYN inclusions, we stressed the different α-SYN/PPIase overexpression cell lines for three days and quantified the α-SYN inclusions using Thio S staining (Fig. 5A). Neither CYPA nor Pin1 overexpression affected the number of α-SYN inclusions compared with the control parental α-SYN overexpression cell line, whereas a significant increase in the percentage of α-SYN aggregate-positive cells was observed in the cell lines overexpressing FKBP12, FKBP38, or FKBP65. Comparison between the 3 different FKBPs revealed that FKBP12 is the strongest stimulator of α-SYN aggregation (90% increase) followed by FKBP38 (48% increase) and FKBP65 (24% increase) (Fig. 5A). A semiquantitative Western blot shows that the relative overexpression levels of the different proteins are not significantly different and do not correlate with the number of α-SYN inclusions (Fig. 5D). Furthermore, in the absence of oxidative stress, no differences in α-SYN aggregation were detected between the different cell lines (data not shown).
In parallel, we determined the effect of the different PPIases on nucleus condensation and fragmentation as a measure for late apoptotic cell death. Indeed, breakdown of the nucleus, comprising collapse, condensation, and fragmentation of the chromatin is a late event in apoptosis. This can be quantified based on the presence of highly intense nuclei or nuclear fragments after DAPI staining. In analogy with the effects on α-SYN aggregation, FKBP12, FKBP38, and FKBP65 increased the number of late apoptotic cells the most, whereas CYPA and Pin1 had no effect (Fig. 5B). Thus, under these experimental conditions, we observe a positive correlation between α-SYN aggregation and apoptosis. Again, in the absence of oxidative stress, no differences in the number of apoptotic cells were observed between the different cell lines (data not shown). Stainings for other cell death markers (immunocytochemical staining for activated caspase-3 or propidium iodide staining for loss of plasma membrane integrity) showed the same effects (data not shown). Because DAPI staining is less time-consuming and proved specific and sensitive enough to detect apoptotic effects, we chose DAPI-based nucleus fragmentation as the standard parameter for cell death for all experiments.
FK506 Inhibits α-SYN Aggregation in FKBP-overexpressing Cells
Next, we tested the effect of FK506, an FKBP inhibitor, in the different FKBP overexpression cell lines after oxidative stress treatment. We incubated α-SYN-overexpressing SHSY5Y cells (NC) that overexpress FKBP12, FKBP38, or FKBP65 for 3 days with Fe2+ and H2O2 and different concentrations of FK506. The FKBPs increased α-SYN aggregation, whereas FK506 dose-dependently reduced the percentage of α-SYN aggregate-positive cells in all cell lines (Fig. 6). This effect was accompanied by a decrease in the number of late apoptotic cells (data not shown). Variations between the replicates rendered accurate IC50 calculations based on a sigmoidal fit difficult. Still, the graphs suggest an apparent IC50 between 1 and 100 nm for all cell lines (Fig. 6). This is in accordance with the IC50 values/inhibition constants of FK506 determined for inhibiting PPIase activity (Ki = 1 nm for FKBP12 (30), Ki = 48 nm for Ca2+/CaM/FKBP38 (30), and IC50 = 45 nm for FKBP65 (66)), suggesting that the effect on α-SYN aggregation seen here is dependent on the PPIase activity of the FKBPs. Fig. 6 also shows that FKBP12 overexpression has the strongest effect on aggregation among the three FKBPs tested. This is reflected in the highest percentage of α-SYN aggregate-positive cells.
FIGURE 6.

Effect of FK506 on α-SYN aggregation in different FKBP overexpression cell lines. The percentage of α-SYN aggregate-positive cells after 72 h of oxidative stress induction and FK506 treatment in α-SYN-overexpressing SHSY5Y cells (NC) co-expressing FKBP12 (A), FKBP38 (B), or FKBP65 (C) is shown. S.E. is shown for each condition (n = 8).
Neither FKBP38, FKBP52, nor FKBP65 Can Fully Reverse the Effect of FKBP12 Knockdown on α-SYN Aggregation and Cell Death
We have previously demonstrated that knockdown of FKBP12 reduces the number of α-SYN aggregates and protects against cell death, whereas overexpression has the opposite effect (15). Because overexpression of FKBP52 (15), FKBP38, or FKBP65 also enhanced α-SYN aggregation and apoptosis in our synucleinopathy model, we decided to test the effect of FKBP38, FKBP52, and FKBP65 overexpression in an FKBP12 knockdown cell line to verify whether the overexpression of either of these three FKBPs could reverse the phenotype caused by FKBP12 knockdown. As a control, we included a FKBP12 back-complementation cell line. Therefore, we generated stable cell lines by combined transduction of α-SYN-overexpressing SHSY5Y cells with LVs encoding an shRNA sequence against FKBP12 together with LV encoding either FKBP38, FKBP52, FKBP65, or FKBP12. A Western blot (Fig. 7A) and semiquantitative estimates of the relative FKBP expression levels (Fig. 7B) confirmed the knockdown of FKBP12 and the overexpression of the specific transgenes in the respective cell lines. In agreement with previous results, α-SYN aggregation was significantly inhibited in the FKBP12 knockdown cell line (shFKBP12) compared with the control α-SYN overexpression cell line (Fig. 7C). In addition, the percentage of apoptotic nuclei was significantly reduced by stable FKBP12 depletion (Fig. 7D). When FKBP52 or FKBP65 were overexpressed in the FKBP12 knockdown cell line, no significant increase in α-SYN aggregation was observed (Fig. 7C). FKBP38 overexpression in the shFKBP12 cells did significantly increase the number of α-SYN inclusions but not to the levels observed in the FKBP12 back-complementation cell line (shFKBP12-FKBP12) (Fig. 7C). On the contrary, introduction of FKBP38 or FKBP65 in the shFKBP12 cell line did increase the percentage of late apoptotic cells to the same level as the control α-SYN overexpression cell line and the shFKBP12-FKBP12 cell line (Fig. 7D). When FKBP52 was overexpressed in the shFKBP12 cell line, no significant increase in apoptosis was observed (Fig. 7D). Again, we could not detect any differences in percentage of α-SYN aggregate-positive and apoptotic cells between the cell lines in unstressed conditions (data not shown).
FIGURE 7.

Rescue of FKBP12 knockdown in cell culture. A Western blot (A) shows stable knockdown of FKBP12 and stable overexpression of α-SYN, FKBP12, FKBP38, FKBP52, or FKBP65 after transduction with respective LVs. In each lane, cell extract containing 10 μg of total protein was loaded, and α-SYN, FKBP12, FKBP38, FKBP52, or FKBP65 expression was visualized with specific antibodies. All SHSY5Y cell lines overexpress α-SYN as demonstrated by the NCs (Lane 1, 5, and 8). The FKBP12 knockdown (lanes 2, 6, and 9) was complemented by FKBP38 (lane 3), FKBP65 (lane 4), FKBP52 (lane 10), or FKBP12 (lanes 7 and 11). The upper panels show stable α-SYN, FKBP12, FKBP38, FKBP52, or FKBP65 overexpression. In the lower panel, α-tubulin is shown as the loading control. Semiquantitative estimates of relative FKBP expression levels (B) in stable FKBP12 knockdown cells overexpressing α-SYN and FKBP38, FKBP52, FKBP65, or FKBP12 are shown. Relative density values show ×-fold overexpression of different FKBPs (1, FKBP12; 2, FKBP38; 3, FKBP65; 4, FKBP52) compared with endogenous level (absorbance units (au) = 1). S.E. is shown for each condition (n = 3). High content analysis of α-SYN aggregation (C) and nucleus fragmentation (D) in stable FKBP12 knockdown cells stably overexpressing α-SYN and FKBP12, FKBP38, FKBP52, or FKBP65 is shown. Data are shown for cell lines after 3 days of oxidative stress. Error bars show the S.E.
Presence of PPIases in Human Lewy Bodies
To further corroborate the possible in vivo relevance of our findings, we decided to investigate the presence of the studied PPIases in LB of PD patients. Therefore, we performed immunofluorescent double staining on human PD brain tissue Braak stage 6 (supplemental Fig. S2). Confocal analysis revealed that 80–90% of the LB stained positive for ubiquitin, as expected (supplemental Fig. S2A). In addition, in some LB, we could detect weak staining for FKBP12 or Pin1 in the dense core and/or halo (supplemental Fig. S2, B and G, respectively). However, no co-localization between any of the other PPIases and α-SYN was detected. In sections of a healthy control, no LB could be detected with either antibody (data not shown). Of note, in aged Thy1 human A30P-α-SYN transgenic mice (67), the α-SYN inclusions co-localized with all PPIases tested: FKBP12, FKBP38, FKBP52, FKBP65, CYPA and Pin1 (data not shown).
DISCUSSION
FKBP ligands, such as FK506, are clinically approved drugs (22, 68). Because FK506 not only inhibits the enzymatic activity of FKBPs but also the protein phosphatase activity of calcineurin (20), interpretation of biological effects in cell culture and animal models is complex due to the added immunosuppressive effect. We recently demonstrated that FK506 inhibits α-SYN aggregation in cell culture induced by oxidative stress (15). Likewise, FK506-mediated inhibition of α-SYN aggregation was shown in mouse brain. Still, the identity of the FKBP representing the primary target of FK506 as an inhibitor of α-SYN aggregation remained enigmatic.
As part of the target validation process, we have now studied the effect of various PPIases from the FKBP, the cyclophilin, and the parvulin family on the aggregation of α-SYN in vitro and in cell culture. Although FK506 inhibits α-SYN aggregation dose-dependently in FKBP12-, FKBP38-, and FKBP65-overexpressing cells, we provide strong evidence that FKBP12 is the main FKBP modulating α-SYN aggregation and related cell death.
Our data provide conclusive evidence that acceleration of the aggregation of α-SYN is not a common property of all proteins with a PPIase activity. We first measured the effect of different PPIases in vitro.
For CYPA, high concentrations stimulated α-SYN aggregation and fibrillation as measured by turbidity and Thio T fluorescence under conditions of continuous shaking. However, the increase in Thio T fluorescence, a measure of amyloid fibrils, by 10 μm CYPA was merely 3% of the increase caused by 10 μm FKBP12. Therefore, we consider this effect of CYPA as negligible. Furthermore, in the absence of shaking, CYPA had absolutely no effect on α-SYN aggregation within the observed time frame (30 days). These in vitro data are consistent with results obtained in the cellular α-SYN aggregation model, where we also do not observe an effect of CYPA.
Pin1 has been shown to specifically bind motifs containing a phosphorylated serine or threonine preceding a proline residue (Ser(P)/Thr(P)-Pro) (69, 70). These motifs are absent in the α-SYN protein. On the other hand, it has also been published that Pin1 does isomerize peptide bonds in which Pro is immediately preceded by Glu or Asp, which can mimic Ser(P)/Thr(P)-Pro (58). The amino acid sequence of α-SYN contains such a peptide bond at position 138 (Glu-Pro). Our results clearly show that the presence of a Glu-Pro peptide bond is not sufficient for Pin1 to strongly modulate the α-SYN aggregation. Comparable with CYPA, the stimulating effect of 10 μm Pin1 on α-SYN aggregation was negligible in in vitro experiments with shaking. Furthermore, non-shaken α-SYN samples with Pin1 were still not aggregating after 1 month. Again, these observations were confirmed by our cell culture experiments; Pin1 did not influence α-SYN inclusion formation. These results are somewhat at odds with a report from Ryo et al. (38) as mentioned earlier, where they convincingly demonstrated that Pin1 binds synphilin-1 via its Ser(P)-211–Pro and Ser(P)-215–Pro motifs. This binding enhances the interaction between synphilin-1 and α-SYN, facilitating the formation of α-SYN inclusions. The discrepancy with our data could be due to the cellular aggregation model used. We subjected SHSY5Y neuroblastoma cells to oxidative stress conditions according to a protocol adapted from Ostrerova-Golts et al. (52) to induce α-SYN aggregation, whereas Ryo et al. (38) co-expressed α-SYN and synphilin-1 proteins, which results in the formation of cytoplasmic α-SYN inclusions in a subset of cultured 293T cells (71, 72). In addition, although α-SYN is overexpressed in our system, synphilin-1 levels are endogenous. Therefore, their proposed mechanism-of-action of Pin1 on α-SYN aggregation is indirect, involving a positive regulation of the interaction between α-SYN and synphilin-1 (38). This could explain why we do not observe a direct effect of Pin1 on α-SYN aggregation.
We provide strong evidence that FKBP12 is the main FKBP-stimulating α-SYN aggregation based on the following observations. First, only FKBP12 showed an important accelerating effect on α-SYN fibril formation in vitro at subnanomolar concentrations as demonstrated previously (55). Second, in an in vitro model of spontaneous α-SYN aggregation (without shaking), FKBP12 enhanced the fibril formation rate the most compared with FKBP52 or FKBP65. Third, of all FKBPs and PPIases tested, FKBP12 shows the best co-localization with α-SYN in cells. Fourth, FKBP12 was the strongest stimulator of α-SYN aggregation and apoptosis in the cellular synucleinopathy model. Fifth and finally, overexpression of neither FKBP38, FKBP52, nor FKBP65 could fully rescue α-SYN aggregation in a FKBP12 knockdown cell line.
There are several indications that PPIases in general and FKBP12 in particular play a physiologically relevant role in neurodegenerative diseases (for review, see Ref. 73). In an attempt to translate our findings to the human condition, we performed a pilot study on brain tissue from a PD patient, Braak stage 6. In some LB, we could detect a weak co-localization of Pin1 and α-SYN or of FKBP12 and α-SYN in the dense core or halo, as previously reported (27, 38). In contrast, no co-localization of CYPA, FKBP38, FKBP52, or FKBP65 and α-SYN was observed. Although this pilot study on human PD brain tissue is too small to formally exclude the presence of the other FKBPs in LB, our results indicate that FKBP12 can indeed be found in LB, which is in agreement with our conclusion that FKBP12 is the most physiological modulator of α-synuclein aggregation. The fact that not all LB stain positive for FKBP12 is consistent with our in vitro data that show FKBP mediates acceleration of the first steps of the aggregation of α-SYN. Therefore, FKBP12 does not necessarily interact with the amyloid fibrils. In fact, we previously failed to detect fluorescent FKBP12 in precipitated α-SYN aggregates in vitro, suggesting that the interaction with α-SYN is transient (14).
We pinpoint FKBP12 as the most important accelerator of α-SYN aggregation, but of course we cannot disregard the fact that the other tested FKBPs also have an effect, although less pronounced. Indeed, we previously reported that overexpression of both FKBP12 and FKBP52 enhances α-SYN aggregation and cell death, whereas knockdown of FKBP12 and FKBP52 reduces the number of α-SYN inclusions and protects against cell death (15). Here, we show that FKBP38 and FKBP65, which are also highly expressed in the human brain, as well enhance α-SYN aggregation and apoptosis in cell culture. The weaker effect of FKBP52 (15), FKBP38, and FKBP65 versus FKBP12 in vitro and in cell culture suggests that these FKBPs interact more weakly with α-SYN or influence its aggregation in an indirect or less efficient way. In agreement with the cellular data, in vitro FKBP52 (15) and FKBP65 only decreased the half-time of aggregation at micromolar instead of subnanomolar concentrations as seen with FKBP12. This points toward a binding effect of these FKBPs to α-SYN rather than to an enzymatic effect. Furthermore, overexpression of neither FKBP38, FKBP52, nor FKBP65 could restore α-SYN aggregation to control levels after stable FKBP12 knockdown. In contrast, cell survival was significantly decreased by FKBP38 or FKBP65 but not by FKBP52. The observed effect on apoptosis may not be directly related to α-SYN aggregation but rather to the interference of FKBP38 and FKBP65 with other cell death-related pathways. As mentioned above, earlier reports have linked FKBP38 and FKBP65 intimately with apoptosis and cell survival (30, 31, 74, 75). FKBP38 localizes to the membranes of mitochondria, where it can influence neurodegeneration (30, 74). As stated above, FKBP38 becomes enzymatically active only after association with Ca2+ and calmodulin, which allows association of the PPIase domain of FKBP38 with Bcl-2, an anti-apoptotic protein localized at the mitochondrial membrane. Consequently, Bcl-2 is released from the mitochondria, which initiates the apoptotic pathway through efflux of cytochrome c from the mitochondrial intermembrane space. Another possible reason for the effect of FKBP38 on apoptosis is its mitochondrial localization (Fig. 4F) (29). FKBP38 overexpression, in association with oxidative stress, may disturb the mitochondrial metabolism and trigger a pathological state that leads to cell death. The interaction of FKBP65 with Hsp90 and c-Raf-1 implicates this immunophilin in signal transduction processes and marks it as an important intermediate in the Raf signaling pathway, which is intimately linked to cell survival and transcriptional activation (31, 75). Moreover, FKBP65 is an ER-localized PPIase (Fig. 4G) predicted to play a role in the folding and trafficking of secretory proteins (65). Overexpression of FKBP65 may possibly lead to incorrect folding of these proteins. Accumulation of unfolded or wrongly folded proteins in the ER is a severe form of stress that will induce apoptosis if ER function cannot be restored (76, 77).
In conclusion, we have shown that (i) not all PPIases stimulate α-SYN aggregation, (ii) stable overexpression of FKBP12, FKBP38, FKBP52, or FKBP65 enhances α-SYN aggregation and cell death in cell culture, an effect that is inhibited by FK506, and (iii) FKBP12 is the strongest modulator. All data together put FKBP12 forward as the main PPIase modulating α-SYN aggregation and validate the protein as an interesting novel drug target for Parkinson disease.
To further validate our hypothesis, future studies are planned to assay overexpression or knockdown of FKBP12 in rodent PD models. If the observed effect of FKBP12 can be confirmed in vivo, specific FKBP12 inhibitors ought to be developed as a novel and rational therapeutic strategy against PD and other synucleinopathies. As a first screening assay for possible inhibitors, we propose the in vitro aggregation assay without shaking, as this assay reliably reproduces the effects that have been observed in cell culture.
Supplementary Material
Acknowledgments
We acknowledge Sebastian Munck and the Center of Human Genetics, Molecular and Developmental Genetics of the K. U. Leuven for technical assistance and the use of the IN Cell Analyzer.
This work was supported by the Institute for the Promotion of Innovation by Science and Technology in Flanders (Project IWT/SBO 80020; a doctoral fellowship (to A. D.) and a postdoctoral fellowship (to M. G.)), the Flemish Research Foundation FWO-Vlaanderen (project G.0768.10, a doctoral fellowship (to A.-S. V. R.), the Michael J. Fox Foundation (target validation 2010), European FP7 RTD project MEFOPA (Grant Agreement HEALTH-2009-241791), and the K. U. Leuven (OT/08/052A and IOF-KP/07/001).

The on-line version of this article (available at http://www.jbc.org) contains supplemental Tables S1–S4 and Figs. S1 and S2.
- PD
- Parkinson disease
- α-SYN
- α-synuclein
- FKBP
- FK506-binding protein
- PPIase
- peptidyl-prolyl cis-trans isomerase
- CYP
- cyclophilin
- LB
- Lewy bodies
- Thio
- thioflavin
- succ-
- succinyl
- LV
- lentiviral vectors
- NC
- negative control
- Bis-Tris
- 2-[bis(2-hydroxyethyl)amino]-2-(hydroxymethyl)propane-1,3-diol
- ER
- endoplasmic reticulum.
REFERENCES
- 1. Kirik D., Rosenblad C., Burger C., Lundberg C., Johansen T. E., Muzyczka N., Mandel R. J., Björklund A. (2002) J. Neurosci. 22, 2780–2791 [DOI] [PMC free article] [PubMed] [Google Scholar]
- 2. Feany M. B., Bender W. W. (2000) Nature 404, 394–398 [DOI] [PubMed] [Google Scholar]
- 3. Lakso M., Vartiainen S., Moilanen A. M., Sirviö J., Thomas J. H., Nass R., Blakely R. D., Wong G. (2003) J. Neurochem. 86, 165–172 [DOI] [PubMed] [Google Scholar]
- 4. Lauwers E., Debyser Z., Van Dorpe J., De Strooper B., Nuttin B., Baekelandt V. (2003) Brain Pathol. 13, 364–372 [DOI] [PMC free article] [PubMed] [Google Scholar]
- 5. Eslamboli A., Romero-Ramos M., Burger C., Bjorklund T., Muzyczka N., Mandel R. J., Baker H., Ridley R. M., Kirik D. (2007) Brain 130, 799–815 [DOI] [PubMed] [Google Scholar]
- 6. Kirik D., Annett L. E., Burger C., Muzyczka N., Mandel R. J., Björklund A. (2003) Proc. Natl. Acad. Sci. U.S.A. 100, 2884–2889 [DOI] [PMC free article] [PubMed] [Google Scholar]
- 7. Spillantini M. G., Schmidt M. L., Lee V. M., Trojanowski J. Q., Jakes R., Goedert M. (1997) Nature 388, 839–840 [DOI] [PubMed] [Google Scholar]
- 8. Polymeropoulos M. H., Lavedan C., Leroy E., Ide S. E., Dehejia A., Dutra A., Pike B., Root H., Rubenstein J., Boyer R., Stenroos E. S., Chandrasekharappa S., Athanassiadou A., Papapetropoulos T., Johnson W. G., Lazzarini A. M., Duvoisin R. C., Di Iorio G., Golbe L. I., Nussbaum R. L. (1997) Science 276, 2045–2047 [DOI] [PubMed] [Google Scholar]
- 9. Krüger R., Kuhn W., Müller T., Woitalla D., Graeber M., Kösel S., Przuntek H., Epplen J. T., Schöls L., Riess O. (1998) Nat. Genet. 18, 106–108 [DOI] [PubMed] [Google Scholar]
- 10. Zarranz J. J., Alegre J., Gómez-Esteban J. C., Lezcano E., Ros R., Ampuero I., Vidal L., Hoenicka J., Rodriguez O., Atarés B., Llorens V., Gomez, Tortosa E., del Ser T., Muñoz D. G., de Yebenes J. G. (2004) Ann. Neurol. 55, 164–173 [DOI] [PubMed] [Google Scholar]
- 11. Chartier-Harlin M. C., Kachergus J., Roumier C., Mouroux V., Douay X., Lincoln S., Levecque C., Larvor L., Andrieux J., Hulihan M., Waucquier N., Defebvre L., Amouyel P., Farrer M., Destée A. (2004) Lancet 364, 1167–1169 [DOI] [PubMed] [Google Scholar]
- 12. Ibáñez P., Bonnet A. M., Débarges B., Lohmann E., Tison F., Pollak P., Agid Y., Dürr A., Brice A. (2004) Lancet 364, 1169–1171 [DOI] [PubMed] [Google Scholar]
- 13. Singleton A. B., Farrer M., Johnson J., Singleton A., Hague S., Kachergus J., Hulihan M., Peuralinna T., Dutra A., Nussbaum R., Lincoln S., Crawley A., Hanson M., Maraganore D., Adler C., Cookson M. R., Muenter M., Baptista M., Miller D., Blancato J., Hardy J., Gwinn-Hardy K. (2003) Science 302, 841 [DOI] [PubMed] [Google Scholar]
- 14. Gerard M., Debyser Z., Desender L., Kahle P. J., Baert J., Baekelandt V., Engelborghs Y. (2006) FASEB J. 20, 524–526 [DOI] [PubMed] [Google Scholar]
- 15. Gerard M., Deleersnijder A., Daniëls V., Schreurs S., Munck S., Reumers V., Pottel H., Engelborghs Y., Van den Haute C., Taymans J. M., Debyser Z., Baekelandt V. (2010) J. Neurosci. 30, 2454–2463 [DOI] [PMC free article] [PubMed] [Google Scholar]
- 16. Göthel S. F., Marahiel M. A. (1999) Cell. Mol. Life Sci. 55, 423–436 [DOI] [PMC free article] [PubMed] [Google Scholar]
- 17. Lang K., Schmid F. X., Fischer G. (1987) Nature 329, 268–270 [DOI] [PubMed] [Google Scholar]
- 18. Shin D. W., Pan Z., Bandyopadhyay A., Bhat M. B., Kim D. H., Ma J. (2002) Biophys. J. 83, 2539–2549 [DOI] [PMC free article] [PubMed] [Google Scholar]
- 19. Marx S. O., Reiken S., Hisamatsu Y., Jayaraman T., Burkhoff D., Rosemblit N., Marks A. R. (2000) Cell 101, 365–376 [DOI] [PubMed] [Google Scholar]
- 20. Liu J., Albers M. W., Wandless T. J., Luan S., Alberg D. G., Belshaw P. J., Cohen P., MacKintosh C., Klee C. B., Schreiber S. L. (1992) Biochemistry 31, 3896–3901 [DOI] [PubMed] [Google Scholar]
- 21. Shim S., Yuan J. P., Kim J. Y., Zeng W., Huang G., Milshteyn A., Kern D., Muallem S., Ming G. L., Worley P. F. (2009) Neuron 64, 471–483 [DOI] [PMC free article] [PubMed] [Google Scholar]
- 22. Poulter M. O., Payne K. B., Steiner J. P. (2004) Neuroscience 128, 1–6 [DOI] [PubMed] [Google Scholar]
- 23. Guo X., Dawson V. L., Dawson T. M. (2001) Eur. J. Neurosci. 13, 1683–1693 [DOI] [PubMed] [Google Scholar]
- 24. Avramut M., Zeevi A., Achim C. L. (2001) Brain Res. Dev. Brain Res. 132, 151–157 [DOI] [PubMed] [Google Scholar]
- 25. Gold B. G., Densmore V., Shou W., Matzuk M. M., Gordon H. S. (1999) J. Pharmacol. Exp. Ther. 289, 1202–1210 [PubMed] [Google Scholar]
- 26. Steiner J. P., Hamilton G. S., Ross D. T., Valentine H. L., Guo H., Connolly M. A., Liang S., Ramsey C., Li J. H., Huang W., Howorth P., Soni R., Fuller M., Sauer H., Nowotnik A. C., Suzdak P. D. (1997) Proc. Natl. Acad. Sci. U.S.A. 94, 2019–2024 [DOI] [PMC free article] [PubMed] [Google Scholar]
- 27. Avramut M., Achim C. L. (2002) Physiol. Behav. 77, 463–468 [DOI] [PubMed] [Google Scholar]
- 28. Gold B. G., Udina E., Bourdette D., Navarro X. (2004) Neurol. Res. 26, 371–380 [DOI] [PubMed] [Google Scholar]
- 29. Shirane M., Nakayama K. I. (2003) Nat. Cell Biol. 5, 28–37 [DOI] [PubMed] [Google Scholar]
- 30. Edlich F., Weiwad M., Erdmann F., Fanghänel J., Jarczowski F., Rahfeld J. U., Fischer G. (2005) EMBO J. 24, 2688–2699 [DOI] [PMC free article] [PubMed] [Google Scholar]
- 31. Coss M. C., Stephens R. M., Morrison D. K., Winterstein D., Smith L. M., Simek S. L. (1998) Cell Growth Differ. 9, 41–48 [PubMed] [Google Scholar]
- 32. Galat A. (2003) Curr. Top. Med. Chem. 3, 1315–1347 [DOI] [PubMed] [Google Scholar]
- 33. Lu P. J., Wulf G., Zhou X. Z., Davies P., Lu K. P. (1999) Nature 399, 784–788 [DOI] [PubMed] [Google Scholar]
- 34. Zhou X. Z., Kops O., Werner A., Lu P. J., Shen M., Stoller G., Küllertz G., Stark M., Fischer G., Lu K. P. (2000) Mol. Cell 6, 873–883 [DOI] [PubMed] [Google Scholar]
- 35. Akiyama H., Shin R. W., Uchida C., Kitamoto T., Uchida T. (2005) Biochem. Biophys. Res. Commun. 336, 521–529 [DOI] [PubMed] [Google Scholar]
- 36. Pastorino L., Sun A., Lu P. J., Zhou X. Z., Balastik M., Finn G., Wulf G., Lim J., Li S. H., Li X., Xia W., Nicholson L. K., Lu K. P. (2006) Nature 440, 528–534 [DOI] [PubMed] [Google Scholar]
- 37. Chambraud B., Sardin E., Giustiniani J., Dounane O., Schumacher M., Goedert M., Baulieu E. E. (2010) Proc. Natl. Acad. Sci. U.S.A. 107, 2658–2663 [DOI] [PMC free article] [PubMed] [Google Scholar]
- 38. Ryo A., Togo T., Nakai T., Hirai A., Nishi M., Yamaguchi A., Suzuki K., Hirayasu Y., Kobayashi H., Perrem K., Liou Y. C., Aoki I. (2006) J. Biol. Chem. 281, 4117–4125 [DOI] [PubMed] [Google Scholar]
- 39. Liu D., McIlvain H. B., Fennell M., Dunlop J., Wood A., Zaleska M. M., Graziani E. I., Pong K. (2007) J. Neurosci. Methods 163, 310–320 [DOI] [PubMed] [Google Scholar]
- 40. Pong K., Zaleska M. M. (2003) Curr. Drug Targets CNS Neurol. Disord. 2, 349–356 [DOI] [PubMed] [Google Scholar]
- 41. Sheehan J., Eischeid A., Saunders R., Pouratian N. (2006) Neurosurg. Focus 20, E9 [DOI] [PubMed] [Google Scholar]
- 42. Sinigaglia-Coimbra R., Cavalheiro E. A., Coimbra C. (2002) J. Neurol. Sci. 203–204, 273–276 [DOI] [PubMed] [Google Scholar]
- 43. Li P. A., Kristián T., He Q. P., Siesjö B. K. (2000) Exp. Neurol. 165, 153–163 [DOI] [PubMed] [Google Scholar]
- 44. Domañska-Janik K., Buzañska L., Dłuzniewska J., Kozłowska H., Sarnowska A., Zabłocka B. (2004) Brain Res. Mol. Brain Res. 121, 50–59 [DOI] [PubMed] [Google Scholar]
- 45. Friberg H., Wieloch T. (2002) Biochimie 84, 241–250 [DOI] [PubMed] [Google Scholar]
- 46. Boulos S., Meloni B. P., Arthur P. G., Majda B., Bojarski C., Knuckey N. W. (2007) Neurobiol. Dis. 25, 54–64 [DOI] [PubMed] [Google Scholar]
- 47. Redell J. B., Zhao J., Dash P. K. (2007) J. Neurosci. Res. 85, 1980–1988 [DOI] [PubMed] [Google Scholar]
- 48. Hamdane M., Smet C., Sambo A. V., Leroy A., Wieruszeski J. M., Delobel P., Maurage C. A., Ghestem A., Wintjens R., Bégard S., Sergeant N., Delacourte A., Horvath D., Landrieu I., Lippens G., Buée L. (2002) J. Mol. Neurosci. 19, 275–287 [DOI] [PubMed] [Google Scholar]
- 49. Küllertz G., Lüthe S., Fischer G. (1998) Clin. Chem. 44, 502–508 [PubMed] [Google Scholar]
- 50. Cohlberg J. A., Li J., Uversky V. N., Fink A. L. (2002) Biochemistry 41, 1502–1511 [DOI] [PubMed] [Google Scholar]
- 51. Geraerts M., Michiels M., Baekelandt V., Debyser Z., Gijsbers R. (2005) J. Gene Med. 7, 1299–1310 [DOI] [PubMed] [Google Scholar]
- 52. Ostrerova-Golts N., Petrucelli L., Hardy J., Lee J. M., Farer M., Wolozin B. (2000) J. Neurosci. 20, 6048–6054 [DOI] [PMC free article] [PubMed] [Google Scholar]
- 53. Lee D., Lee S. Y., Lee E. N., Chang C. S., Paik S. R. (2002) J. Neurochem. 82, 1007–1017 [DOI] [PubMed] [Google Scholar]
- 54. Nielsen M. S., Vorum H., Lindersson E., Jensen P. H. (2001) J. Biol. Chem. 276, 22680–22684 [DOI] [PubMed] [Google Scholar]
- 55. Gerard M., Debyser Z., Desender L., Baert J., Brandt I., Baekelandt V., Engelborghs Y. (2008) J. Neurochem. 106, 121–133 [DOI] [PubMed] [Google Scholar]
- 56. Peattie D. A., Harding M. W., Fleming M. A., DeCenzo M. T., Lippke J. A., Livingston D. J., Benasutti M. (1992) Proc. Natl. Acad. Sci. U.S.A. 89, 10974–10978 [DOI] [PMC free article] [PubMed] [Google Scholar]
- 57. Bergsma D. J., Eder C., Gross M., Kersten H., Sylvester D., Appelbaum E., Cusimano D., Livi G. P., McLaughlin M. M., Kasyan K. (1991) J. Biol. Chem. 266, 23204–23214 [PubMed] [Google Scholar]
- 58. Yaffe M. B., Schutkowski M., Shen M., Zhou X. Z., Stukenberg P. T., Rahfeld J. U., Xu J., Kuang J., Kirschner M. W., Fischer G., Cantley L. C., Lu K. P. (1997) Science 278, 1957–1960 [DOI] [PubMed] [Google Scholar]
- 59. Zeng B., MacDonald J. R., Bann J. G., Beck K., Gambee J. E., Boswell B. A., Bächinger H. P. (1998) Biochem. J. 330, 109–114 [DOI] [PMC free article] [PubMed] [Google Scholar]
- 60. Harrison R. K., Stein R. L. (1990) Biochemistry 29, 3813–3816 [DOI] [PubMed] [Google Scholar]
- 61. Ranganathan R., Lu K. P., Hunter T., Noel J. P. (1997) Cell 89, 875–886 [DOI] [PubMed] [Google Scholar]
- 62. Wood S. J., Wypych J., Steavenson S., Louis J. C., Citron M., Biere A. L. (1999) J. Biol. Chem. 274, 19509–19512 [DOI] [PubMed] [Google Scholar]
- 63. Han H., Weinreb P. H., Lansbury P. T., Jr. (1995) Chem. Biol. 2, 163–169 [DOI] [PubMed] [Google Scholar]
- 64. Pronchik J., He X., Giurleo J. T., Talaga D. S. (2010) J. Am. Chem. Soc. 132, 9797–9803 [DOI] [PubMed] [Google Scholar]
- 65. Patterson C. E., Schaub T., Coleman E. J., Davis E. C. (2000) Mol. Biol. Cell 11, 3925–3935 [DOI] [PMC free article] [PubMed] [Google Scholar]
- 66. Coss M. C., Winterstein D., Sowder R. C., 2nd, Simek S. L. (1995) J. Biol. Chem. 270, 29336–29341 [DOI] [PubMed] [Google Scholar]
- 67. Freichel C., Neumann M., Ballard T., Müller V., Woolley M., Ozmen L., Borroni E., Kretzschmar H. A., Haass C., Spooren W., Kahle P. J. (2007) Neurobiol. Aging 28, 1421–1435 [DOI] [PubMed] [Google Scholar]
- 68. Wang X. J., Etzkorn F. A. (2006) Biopolymers 84, 125–146 [DOI] [PubMed] [Google Scholar]
- 69. Joseph J. D., Yeh E. S., Swenson K. I., Means A. R., Winkler (2003) Prog. Cell Cycle Res. 5, 477–487 [PubMed] [Google Scholar]
- 70. Lu K. P. (2004) Trends Biochem. Sci. 29, 200–209 [DOI] [PubMed] [Google Scholar]
- 71. Engelender S., Kaminsky Z., Guo X., Sharp A. H., Amaravi R. K., Kleiderlein J. J., Margolis R. L., Troncoso J. C., Lanahan A. A., Worley P. F., Dawson V. L., Dawson T. M., Ross C. A. (1999) Nat. Genet. 22, 110–114 [DOI] [PubMed] [Google Scholar]
- 72. O'Farrell C., Murphy D. D., Petrucelli L., Singleton A. B., Hussey J., Farrer M., Hardy J., Dickson D. W., Cookson M. R. (2001) Brain Res. Mol. Brain Res. 97, 94–102 [DOI] [PubMed] [Google Scholar]
- 73. Gerard M., Deleersnijder A., Demeulemeester J., Debyser Z., Baekelandt V. (2011) Mol. Neurobiol., in press [DOI] [PubMed] [Google Scholar]
- 74. Edlich F., Weiwad M., Wildemann D., Jarczowski F., Kilka S., Moutty M. C., Jahreis G., Lücke C., Schmidt W., Striggow F., Fischer G. (2006) J. Biol. Chem. 281, 14961–14970 [DOI] [PubMed] [Google Scholar]
- 75. Cox A. D., Der C. J. (2003) Oncogene 22, 8999–9006 [DOI] [PubMed] [Google Scholar]
- 76. Mori K. (2000) Cell 101, 451–454 [DOI] [PubMed] [Google Scholar]
- 77. Bertolotti A., Zhang Y., Hendershot L. M., Harding H. P., Ron D. (2000) Nat. Cell Biol. 2, 326–332 [DOI] [PubMed] [Google Scholar]
Associated Data
This section collects any data citations, data availability statements, or supplementary materials included in this article.