Abstract
Cysteine (C)-X-C motif chemokine receptor 4 (CXCR4), the primary receptor for stromal cell-derived factor-1 (SDF-1), is involved in bone morphogenic protein 2 (BMP2)-induced osteogenic differentiation of mesenchymal progenitors. To target the in vivo function of CXCR4 in bone and explore the underlying mechanisms, we conditionally inactivated CXCR4 in osteoprecursors by crossing osterix (Osx)-Cre mice with floxed CXCR4 (CXCR4fl/fl) mice to generate knock-outs with CXCR4 deletion driven by the Osx promoter (Osx::CXCR4fl/fl). The Cre-mediated excision of CXCR4 occurred exclusively in bone of Osx::CXCR4fl/fl mice. When compared with littermate controls, Osx::CXCR4fl/fl mice developed smaller osteopenic skeletons as evidenced by reduced trabecular and cortical bone mass, lower bone mineral density, and a slower mineral apposition rate. In addition, Osx::CXCR4fl/fl mice displayed chondrocyte disorganization in the epiphyseal growth plate associated with decreased proliferation and collagen matrix syntheses. Moreover, mature osteoblast-related expression of type I collagen α1 and osteocalcin was reduced in bone of Osx::CXCR4fl/fl mice versus controls, suggesting that CXCR4 deficiency results in arrested osteoblast progression. Primary cultures for osteoblastic cells derived from Osx::CXCR4fl/fl mice also showed decreased proliferation and impaired osteoblast differentiation in response to BMP2 or BMP6 stimulation, and suppressed activation of intracellular BMP receptor-regulated Smads (R-Smads) and Erk1/2 was identified in CXCR4-deficient cells and bone tissues. These findings provide the first in vivo evidence that CXCR4 functions in postnatal bone development by regulating osteoblast development in cooperation with BMP signaling. Thus, CXCR4 acts as an endogenous signaling component necessary for bone formation.
Keywords: Bone, Bone Morphogenetic Protein (BMP), Cell Differentiation, Chemokines, Development, CXC Chemokine Receptor 4, Growth Plate, Osteoblast Differentiation, Stromal Cell-derived Factor-1
Introduction
Cysteine (C)-X-C motif chemokine receptor 4 (CXCR4)2 is the primary transmembrane receptor for signaling chemokine stromal cell-derived factor-1 (SDF-1; also named CXCL12 or pre-B cell stimulating factor) (1–4). Both CXCR4 and SDF-1 are highly conserved in various mammalian cell types and have broad functions in cell proliferation, morphogenesis, and migration. The CXCR4−/− and SDF-1−/− mice die in utero or perinatally due to multiple defects in developing brain, heart, vasculature, intestine, and hematopoietic tissues (5–7). Mutations at the carboxyl terminus of CXCR4 gene also lead to the warts, hypogammaglobulinemia, infections, and myelokathexis syndrome in humans, a complex immunodeficiency disease associated with neutropenia and defective B cell development (8). The binding of SDF-1 to CXCR4 induces cytoskeleton rearrangement and integrin activation and eventually results in the migration of CXCR4-expressing cells toward high gradients of SDF-1 (9–16). This SDF-1/CXCR4-mediated chemotaxis is involved in a variety of physiological and pathological events including blood homeostasis (9), cellular inflammatory and immune response (10), bone remodeling (11), homing of stem/progenitor cells to bone marrow reservoir (17), tumor metastasis to bone or other organs containing high levels of SDF-1 (18), and cell recruitment in injured tissues (15, 19–24).
Previous studies suggested the expression of CXCR4 and SDF-1 in bone; however, their direct function as well as underlying mechanisms remained poorly defined. This is probably due to the absence of demonstrable reports about skeletal abnormalities in patients with CXCR4 mutations or mice lacking CXCR4 or SDF-1. In fact, accumulating evidence has suggested the intimate association of the SDF-1/CXCR4 pathway with progenitor cells that have potentials to become bone-producing osteoblasts or form bone. Expression of SDF-1 and CXCR4 is found in both mesenchymal cell cultures (15, 21, 25, 27) and bone sections (28–32) with greater levels in less differentiated cells or immature osteoblasts relative to mature osteoblasts and osteocytes. High levels of SDF-1 are also present in regions of perichondrium of embryonic bones and periosteum of injured bones where osteoprogenitors arise and differentiate (15, 28–32). In addition, retrovirus-mediated overexpression of SDF-1 in human mesenchymal stem cells was found to enhance mesenchymal stem cell induction of ectopic bone formation in nude mice (27). In mesenchymal cultures, such as human and mouse bone marrow-derived stromal cells (33) and C2C12 and ST2 cells (25), we demonstrated that blocking the SDF-1/CXCR4 signal axis inhibits the differentiation of these cells toward the osteoblastic lineage in response to bone morphogenic protein 2 (BMP2) stimulation. This reveals the direct involvement of the SDF-1/CXCR4 pathway in osteogenic differentiation in vitro. Moreover, recent evidence showing the effect of CXCR4 and SDF-1 on enhancing chondrocyte hypertrophy at the chondro-osseous junction of long bone further implicates the involvement of SDF-1 signaling in endochondral ossification (34). In light of these findings, we hypothesized that SDF-1 signaling functions in bone formation by affecting osteoblast development.
To address the direct role of SDF-1 signaling in bone formation in vivo, in this study, we used the Cre/loxP genetic approach to conditionally remove CXCR4 from osteoblastic lineage precursors under the control of an osterix (Osx) promoter. Osx (35) is a zinc-finger domain-containing transcription factor, downstream of Runx2, mainly expressed by osteoprecursors during early phases of osteogenic differentiation. Osx is considered one of the “master” regulators for bone formation, because Osx−/− mice (35), like Runx2−/− mice (36, 37), develop no bone in their skeletons. Using this Osx-controlled conditional deletion of CXCR4, we demonstrated the requirement for CXCR4 in bone formation of the mouse skeleton. Moreover, we identified the function of CXCR4 in regulating osteoblast activities and the interaction of CXCR4 with BMP signaling in this process.
EXPERIMENTAL PROCEDURES
Antibodies and Reagents
Anti-CXCR4 and anti-Osx antibodies were purchased from eBioscience (San Diego, CA) and Abcam (Cambridge, MA), respectively. Antibodies for type X collagen α1 (Col10α1), ProCol1α1, and proliferating cell nuclear antigen (PCNA) were purchased from the Developmental Studies Hybridoma Bank (University of Iowa, Iowa City, IA). Anti-osteocalcin (OCN) was purchased from Millipore (Billerica, MA). Antibodies for Smad1/5/8, phosphorylated Smad1/5, total Erk, phosphorylated Erk1/2, and β-tubulin were obtained from Cell Signaling Technology (Danvers, MA). Anti-phosphorylated Smad2 was purchased from Rockland Immunochemicals (Gilbertsville, PA). Antibodies for SDF-1, Col2α1, isotype-matched control antibodies, and secondary goat, sheep, or rabbit IgGs were from Santa Cruz Biotechnology (Santa Cruz, CA). Recombinant human (rh) BMP2 and BMP6 proteins were purchased from R&D Systems (Minneapolis, MN). General chemicals were from Sigma. All cell culture media and supplements were from Invitrogen.
Animals and Genotyping
All animal experiments were carried out following review and approval by the Institutional Animal Care and Use Committee at The Hospital for Special Surgery. CXCR4fl/fl mice (38–40), in which CXCR4 gene is flanked by loxP sequences, were provided by Dr. Yong-Rui Zou (Columbia University, New York, NY). Osx-Cre mice (41, 42), in which the expression of a tetracycline (Tet)-Off regulatable GFP-Cre fusion protein is transcriptionally controlled by an Osx promoter, were purchased from The Jackson Laboratory (Bar Harbor, ME). These two strains were crossed and maintained on a C57BL/6J background. We first generated double heterozygous mice for Cre and floxed CXCR4 (Osx-Cre;CXCR4fl/+) that were then bred to CXCR4fl/fl mice via a back-mating strategy to generate excised floxed CXCR4 homozygous (Osx::CXCR4fl/fl; used as conditional knock-outs), heterozygous for floxed CXCR4 (Osx-Cre;CXCR4fl/+), and Cre-null mice (CXCR4fl/+ and CXCR4fl/fl; used as littermate controls throughout the study). These mice were born at the expected Mendelian frequency. As additional controls, Osx::CXCR4fl/fl mice were fed with 200 μg/ml doxycycline (tetracycline analog; Sigma) in drinking water, which prevents the Osx promoter from driving Cre expression, as suggested by the manufacturer.
For genotyping, genomic DNA was isolated from tail tips using the DNeasy Blood and Tissue kit (Qiagen, Valencia, CA). PCRs were performed using PCR Master Mix (Fermentas, Glen Burnie, MD) with primer sequences for Cre transgene and floxed Cxcr4 gene relative to wild type Cxcr4 as shown in Table 1.
TABLE 1.
Primer sequences used in RT-PCR and qPCR
| Target gene | GenBank accession no. | Sequences (5′–3′) | Product size |
|---|---|---|---|
| bp | |||
| Cre recombinase | HQ335171 | Forward, GCGGTCTGGCAGTAAAAACTATC; reverse, GTGAAACAGCATTGCTGTCACTT | 102 |
| Floxed Cxcr4 vs. Cxcr4 | U65580 | Forward, CACTACGCATGACTCGAAATG; reverse, GTGTGCGGTGGTATCCAGC | 434 vs. 334 |
| Cxcr4 | NM_009911 | Forward, GATAGCCTGTGGATGGTGGT; reverse, GCAGGCAAAGAAAGCTAGGA | 180 |
| Osx | NM_130458 | Forward, CCCTTCTCAAGCACCAATGG; reverse, AGGGTGGGTAGTCATTTGCATAG | 85 |
| Alp | NM_007431 | Forward, CTTGACTGTGGTTACTGCTG; reverse, GAGCGTAATCTACCATGGAG | 200 |
| Col1α1 | NM_007742 | Forward, GGCAAGAATGGAGATGATGG; reverse, CTTAGGACCAGCAGGACCAG | 180 |
| Ocn | NM_007541 | Forward, CCGGGAGCAGTGTGAGCTTA; reverse, AGGCGGTCTTCAAGCCATACT | 69 |
| Gapdh | NM_008084 | Forward, GGGTGTGAACCACGAGAAAT; reverse, CCTTCCACAATGCCAAAGTT | 120 |
X-ray and Microcomputed Tomography (μCT) Analyses
For skeletal analysis, mice were sacrificed by CO2 inhalation, and x-rays (40 kV, 4 mA·s, source to image receptor distance of 130 cm; Faxitron, Lincolnshire, IL) were obtained in both lateral and anterior-posterior views to assess the spinal length and the femoral/tibial length, respectively, in the mouse skeleton.
μCT (Scanco Medical MicroCT 35) was performed on both calvariae and tibiae of mice. Entire calvariae and tibiae were scanned (isotropic resolution of 15–20 μm) to obtain grayscale images, which were Gaussian-filtered and globally thresholded (15.2% of maximum gray value) to form binarized images for morphological analyses. Quantitative volumetric analyses of cortical and trabecular microstructures were performed on entire parietal calvariae and on a region of 200 microtomographic slices (2.1 mm) at the proximal tibia with an isotropic resolution of 6 μm. These analyses measured the cortical and trabecular bone volume fraction, thickness, and bone mineral density as well as trabecular number, separation, and connectivity density.
Double Fluorochrome Labeling and Mineral Apposition Rate (MAR)
To measure bone mineralization in vivo, mice were subcutaneously and sequentially injected with xylenol orange (orange-red) and tetracycline (green) at 20 μg/g (body weight) each in a 4-day time interval. One day after the second injection, tibiae were collected, fixed in 80% ethanol, then subjected to poly(methyl methacrylate) embedding, and sectioned to 8–10 μm.
Histomorphometry analysis using OsteoII software (Bioquant, Nashville, TN) was performed on tibia sections to measure the distance between two fluorochrome-labeled mineralization fronts at the midshaft of tibia. Periosteal MAR was calculated by dividing the measured distance by the time interval.
Histology, Immunohistochemistry, and Histomorphometry
For phenotypic analysis, tibiae including knee joints or calvariae were fixed in sodium phosphate-buffered 4% paraformaldehyde at 4 °C for 2–4 days, decalcified in 5% EDTA, and transferred to 70% ethanol until paraffin wax embedding. These tissues were sectioned to 4–5 μm and subjected to Alcian blue staining; and poly(methyl methacrylate) sections were subjected to von Kossa staining following standard histology protocols.
To reveal patterning changes in cartilage and bone of the entire skeleton, E18.5 whole embryos of mice were sequentially stained with Alcian blue (for cartilage) and Alizarin red (for bone) as described in previous studies (43). In short, after fixation with 95% ethanol for 48–72 h, embryos were stained with 0.03% (w/v) Alcian blue in 80% ethanol and 20% acetic acid solution for 1–3 days, followed by 0.03% (w/v) Alizarin red in 1% KOH solution for another 12–24 h, and then maintained in a solution of 2% KOH, glycerol (20:80) until analysis.
For immunohistochemistry, deparaffinized sections were antigen-retrived in heated 10 mm citrate buffer (pH 6.0) and then incubated with the primary antibody at 4 °C overnight. On the second day, sections were incubated with appropriate secondary antibodies for 30–60 min at room temperature and developed with 3,3′-diaminobenzidine or 3,3′,5,5′-tetramethylbenzidine as the chromogen following the manufacturer's instructions (Vector Laboratories, Burlingame, CA). After histology or immunohistochemistry, histomorphometric analysis (Bioquant) was performed on tissue sections to quantify the number of positively stained cells per region of interest or per bone surface and the fraction of mineralized bone following the manufacturer's protocols.
RT-PCR, Real Time PCR, and Western Blotting
Total RNA of mouse tissues was extracted using the RNeasy extraction kit (Qiagen), and an equal amount of 1 μg of total RNA per sample was reverse transcribed (first strand RT kit, Fermentas). Regular PCR or quantitative real time PCR (qPCR) was performed using PCR Master Mix (Fermentas) or SYBR Green Supermix (Bio-Rad) with primer sequences listed in Table 1. The level of target gene expression was normalized to the level of the housekeeping gene Gapdh (25, 33).
Western blotting was performed as described previously (25, 33). In short, whole cell lysates were assayed for the amount of total cellular protein (Pierce bicinchoninic acid assay, Thermo Scientific, Rockford, IL). Equal loadings of 20-μg aliquots of total protein from each sample were fractionated on 12% Bis-Tris gels following the manufacturer's protocol (Invitrogen). After incubating with appropriate antibodies, immunoreactive bands were visualized with enhanced chemiluminescence (ECL) detection reagents (Amersham Biosciences). The intensities of bands were measured using gel image analysis software (NIH ImageJ_1.32).
Primary Calvaria Culture, Proliferation, and Differentiation Assay
Calvariae were dissected from newborn mice (1–3 days after birth), rinsed with PBS, and digested in freshly made 1 mg/ml collagenase/dispase mixture (Roche Applied Science) in α-Minimal Essential Eagle's Medium at 37 °C for 20 min; the digestion was repeated three times. After digestion, supernatants were combined and centrifuged to pellet cells. Cells were then cultured in α-Minimal Essential Eagle's Medium supplemented with 10% FBS and 1% penicillin/streptomycin (all from Invitrogen). Medium was replaced every 2–3 days. Proliferation of calvaria cells was measured by evaluating cell cycle progression using bromodeoxyuridine (BrdU) incorporation assays (Chemicon, Billerica, MA) according to the manufacturer's instructions.
To induce osteoblast differentiation, calvaria cells were stimulated with rhBMP2 or rhBMP6 at 100 ng/ml for 4 and 7 days. ALP activity and OCN synthesis were evaluated in these cells as markers for immature and mature osteoblasts, respectively. As described previously (25, 33), ALP activity was measured in cell lysates using a colorimetric assay (Sigma) and was normalized to the level of total cellular protein. OCN synthesis was measured in culture medium using a commercially available ELISA kit (Biomedical Technologies, Stoughton, MA).
Serum OCN and Tartrate-resistant Acid Phosphatase Assays
OCN levels in mouse serum were also measured using ELISA kits from Biomedical Technologies. Serum tartrate-resistant acid phosphatase, a marker of bone resorption, was measured using the ELISA-based mouse tartrate-resistant acid phosphatase assay kit from Immunodiagnostic Systems (Fountain Hills, AZ).
Statistical Analysis
Experiments were repeated two to three times independently with five to six samples included in each experimental group. All quantitative measurements are reported as the mean ± S.D. calculated using SigmaPlot8 or Instat statistical software. Differences between two experimental groups were compared by one-way analysis of variance or Student's t test with significance accepted at p < 0.05.
RESULTS
Bone-specific Deletion of CXCR4 in Osx::CXCR4fl/fl Mice
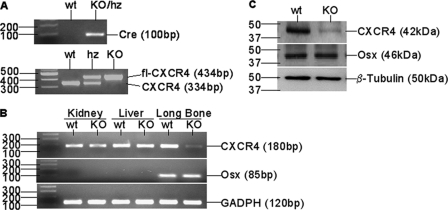
Osx::CXCR4fl/fl mice and littermates were genotyped for the presence of Cre transgene and floxed Cxcr4 gene relative to wild type Cxcr4 (Fig. 1A). To validate the Osx-controlled Cxcr4 deletion, we performed RT-PCR to examine Cxcr4 expression in several tissues derived from newborn Osx::CXCR4fl/fl mice and Cre-null littermate controls (equivalent to the use of wild type). When compared with control mice, loss of Cxcr4 gene was restricted to long bones of Osx::CXCR4fl/fl mice that expressed Osx, whereas no Cxcr4 deletion relative to the housekeeping gene Gapdh was observed in soft organs (kidneys and livers) of Osx::CXCR4fl/fl mice that did not express Osx (Fig. 1B).
FIGURE 1.
Bone specific-deletion of CXCR4 in Osx::CXCR4fl/fl mice. A, representative genotyping PCR for Cre transgene and floxed (fl) Cxcr4 relative to wild type Cxcr4 in Osx::CXCR4fl/fl mice (KO), littermates heterozygous (hz) for Cre and floxed Cxcr4 (Osx-Cre;CXCR4fl/+), and Cre-null littermates (CXCR4fl/+ and CXCR4fl/fl), which were equivalent to wild type (WT) controls. B, RT-PCR detection of Cxcr4, Osx, and Gapdh control in kidneys, livers, and long bones (femora and tibiae) derived from newborn (days 1–3 after birth) KO and WT mice. C, Western blotting for basal expression of CXCR4, Osx, and β-tubulin control in calvaria cells derived from newborn KO or WT mice. Cells were pooled from n = 3 WT or KO mice; experiments were repeated twice using mice from different litters.
We also performed Western blotting to compare the protein level of CXCR4 in osteoblastic cells derived from calvariae of newborn Osx::CXCR4fl/fl mice with that of littermate controls. Osx expression detected in calvaria cells of Osx::CXCR4fl/fl mice was similar to that of controls; however, reduced CXCR4 expression relative to the β-tubulin control was observed in calvaria osteoblasts of Osx::CXCR4fl/fl mice versus cells of control mice (Fig. 1C). Collectively, these data suggest the bone-specific deletion of CXCR4 in Osx::CXCR4fl/fl mice.
Skeletal Alterations in Osx::CXCR4fl/fl Mice
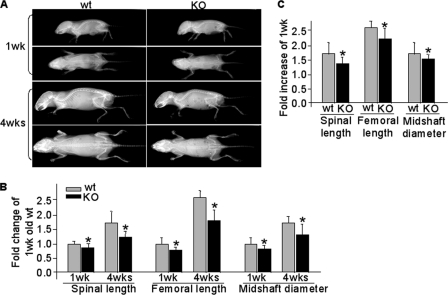
To evaluate the effect of CXCR4 deficiency on the development of mouse skeleton, we compared Osx::CXCR4fl/fl mice with their sex-matched littermate controls by high resolution x-ray and quantitative μCT. A gross assessment for reduced skeletal size in growing Osx::CXCR4fl/fl mice versus controls was obtained by lateral and anterior-posterior view x-ray radiographs (Fig. 2A). When compared with control mice at the same ages, the spinal length of Osx::CXCR4fl/fl mice was reduced 13% at 1 week and 28% at 4 weeks (Fig. 2B). Reduced femoral length (20% at 1 week and 30% at 4 weeks) and femoral midshaft diameter (13% at 1 week and 22% at 4 weeks) were also observed in Osx::CXCR4fl/fl mice versus controls (Fig. 2B). Moreover, comparisons between Osx::CXCR4fl/fl mice and control mice for skeletal growth from 1 to 4 weeks old suggested growth retardation in Osx::CXCR4fl/fl mice because the increases in spinal length, femoral length, and midshaft diameter were 19, 15, and 14% less, respectively, in Osx::CXCR4fl/fl mice versus controls (Fig. 2C).
FIGURE 2.
Reduced skeletal size in Osx::CXCR4fl/fl mice. A, representative x-ray lateral and anterior-posterior view radiographs of Osx::CXCR4fl/fl (KO) mice and Cre-null littermate controls equivalent to WT at 1 and 4 weeks old; all were females. B, -fold changes of skeletal size parameters when compared with WT control at 1 week old, which was set as 1. C, -fold increases in skeletal size parameters at 4 weeks versus those of 1 week in WT or KO mice. n = 5 female WT or KO mice at 1 or 4 weeks old. Measurements are presented as mean ± S.D. *, p < 0.05 versus 1-week-old WT (B) or versus respective 1-week-old mice (C).
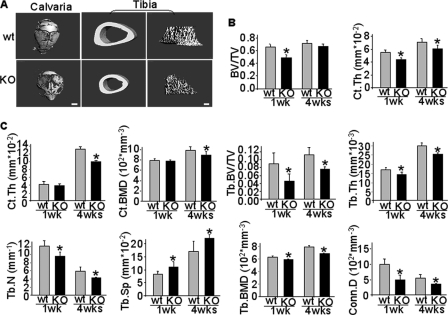
μCT analysis (Fig. 3, A–C) further revealed microstructural changes in calvariae and tibiae of Osx::CXCR4fl/fl mice where bone forms via intramembraneous and endochondral ossification, respectively. When compared with littermate controls at the same ages, a 22% decrease in bone volume fraction (BV/TV) was detected in calvariae of Osx::CXCR4fl/fl mice at 1 week old, and a slight decrease was observed at 4 weeks (Fig. 3B). Cortical thickness (Ct.Th) in calvariae of Osx::CXCR4fl/fl mice was also reduced at both ages (21% at 1 week and 14% at 4 weeks), suggesting that CXCR4 deficiency results in lower bone mass in calvariae of Osx::CXCR4fl/fl mice than that of controls (Fig. 3B). No significant decrease in bone mineral density (BMD) was detected in calvariae of Osx::CXCR4fl/fl mice versus those of controls at either age (data not shown).
FIGURE 3.
Structural alterations in Osx::CXCR4fl/fl mice. A, representative μCT images of entire parietal calvariae (1-week-old females) and tibia cortical and trabecular bone (4-week-old females) in Osx::CXCR4fl/fl mice (KO) and Cre-null littermate controls (WT). The scale bar equals 1 mm in calvariae or 100 μm in tibiae. B, quantitative μCT analysis of calvaria cortical BV/TV and Ct.Th. C, quantitative μCT analysis of cortical and trabecular structure on 200 microtomographic slices (2.1 mm) at the proximal tibia. Measurements were Ct.Th, cortical (Ct.) BMD, trabecular (Tb.) BV/TV, trabecular thickness (Tb.Th), trabecular number (Tb.N), trabecular separation (Tb.Sp), trabecular BMD, and connective tissue density (Conn.D). n = 5 female WT or KO mice at 1 or 4 weeks old. Measurements are presented as mean ± S.D. *, p < 0.05 versus respective WT control.
In the proximal tibia, when compared with littermate controls at the same ages, a slightly decreased Ct.Th was observed in 1-week-old Osx::CXCR4fl/fl mice, and a 24% decrease in Ct.Th was detected in Osx::CXCR4fl/fl mice at 4 weeks old (Fig. 3C). Cortical BMD was also reduced by 11% in tibiae of 4-week-old Osx::CXCR4fl/fl mice versus that of controls (Fig. 3C). Cortical porosities (1 − BV/TV) similar to those of littermate controls at both ages were found in tibiae of Osx::CXCR4fl/fl mice (data not shown).
Markedly decreased trabeculation was detected in the proximal tibia in Osx::CXCR4fl/fl mice. When compared with littermate controls at both ages, lower BV/TV (44% decrease at 1 week and 32% decrease at 4 weeks), decreased trabecular thickness (18% decrease at 1 week and 17% decrease at 4 weeks), lower numbers of trabeculae (21% decrease at 1 week and 25% decrease at 4 weeks) accompanied by higher trabecular separations (37% increase at 1 week and 30% increase at 4 weeks) were found in tibiae of Osx::CXCR4fl/fl mice (Fig. 3C). Moreover, the trabecular BMD was lower in tibiae of Osx::CXCR4fl/fl mice at both ages (9% decrease at 1 week and 13% decrease at 4 weeks) as was the connective tissue density of trabeculae (49% decrease at 1 week and 33% decrease at 4 weeks) (Fig. 3C). Collectively, these μCT quantitative results were in agreement with qualitative images, suggesting reduced cortical and trabecular bone mass and BMD in endochondral bones of Osx::CXCR4fl/fl mice.
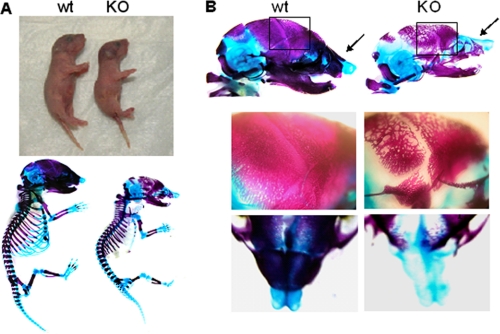
To determine whether the postnatal skeletal changes originated prenatally, we examined the developing skeletons of E18.5 embryos by sequential Alcian blue and Alizarin red staining. Our data confirmed a smaller size of newborn and E18.5 embryos of Osx::CXCR4fl/fl mice than that of littermate controls, whereas no significant patterning changes were seen in cartilage or bone in E18.5 embryos of Osx::CXCR4fl/fl mice (Fig. 4A). In addition, we observed less well developed calvariae in E18.5 embryos of Osx::CXCR4fl/fl mice compared with those of littermate controls as evidenced by a loose mineralized bone structure along with delayed suture closure (Fig. 4B). Moreover, when compared with controls, Osx::CXCR4fl/fl embryos lacked sufficient development of nasal bone around the nasal capsule (Fig. 4B). This prenatal calvaria defect correlates to our μCT detections of decreased BV/TV and Ct.Th in postnatal calvariae of Osx::CXCR4fl/fl mice.
FIGURE 4.
Prenatal skeletal changes in Osx::CXCR4fl/fl mice. A, representative images of newborn (day 1) Osx::CXCR4fl/fl mice (KO) and Cre-null littermates used as WT controls (upper panel) and Alcian blue/Alizarin red staining of E18.5 embryos (lower panel). B, Alcian blue/Alizarin red staining of entire heads (upper panel) and amplified regions of calvaria (framed areas) and nose (indicated by arrows) of E18.5 embryos (lower panels). WT and KO from two different litters were observed.
Decreased Bone Mineralization Rate in Osx::CXCR4fl/fl Mice
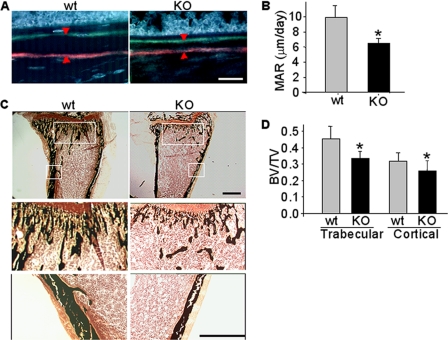
To further understand the effect of CXCR4 deficiency on reducing bone mass and BMD, we compared in vivo mineral apposition in Osx::CXCR4fl/fl mice with their sex-matched littermate controls via double fluorochrome labeling. A smaller distance between xylenol orange- and tetracycline-labeled mineralization fronts at the midshaft of tibia was observed in Osx::CXCR4fl/fl mice versus controls (Fig. 5A), suggesting a lesser amount of new bone formed in Osx::CXCR4fl/fl mice. Histomorphometric measurements showed that the periosteal MAR of Osx::CXCR4fl/fl mice was 33% lower than that of littermate controls (Fig. 5B).
FIGURE 5.
Decreased MAR in Osx::CXCR4fl/fl mice. A, double fluorochrome-labeling in tibiae of Osx::CXCR4fl/fl mice (KO) and Cre-null littermate controls (WT) by xylenol orange (orange-red) and tetracycline (green) in a 4-day time interval. The scale bar equals 100 μm. B, the distance between two fluorochrome-labeled mineralization fronts (indicated by arrowheads in A) at the midshaft of tibia was quantified using OsteoII software (Bioquant). The MAR was calculated by dividing the measured distance by the time interval. C, von Kossa staining of the fluorochrome-labeled tibiae (upper panel; scale bar equals 500 μm). Mineralized trabecular or cortical bone (amplification of framed areas) is stained black (lower panels; scale bar equals 500 μm). D, histomorphometric analysis for mineralized bone in von Kossa-stained tibiae. The trabecular BV/TV was determined by dividing the area of mineralized trabecular bone by the total area from the epiphyseal growth plate to the midshaft of tibia. The cortical BV/TV was determined at the midshaft of tibia by dividing the cortical thickness by the total width of tibia. Five measurements per section for three consecutive sections were taken to average each sample. n = 5 (females; 2 weeks old) WT or KO mice. Measurements are presented as mean ± S.D. *, p < 0.05 versus WT control.
Decreased mineralization in Osx::CXCR4fl/fl mice was also suggested by von Kossa staining on the above described fluorochrome-labeled tibiae (Fig. 5C). When compared with control mice, we detected a 22% decrease in BV/TV of trabecular bone and a 14% decrease in BV/TV of cortical bone in Osx::CXCR4fl/fl mice (Fig. 5D). These results in combination with our μCT measurements of decreased trabeculation and cortical thickening in tibiae of Osx::CXCR4fl/fl mice suggest that a lower bone mineralization rate contributes, at least in part, to lower bone mass in these mice.
Growth Plate Disorganization and Abnormal Osteoblast Development in Osx::CXCR4fl/fl Mice
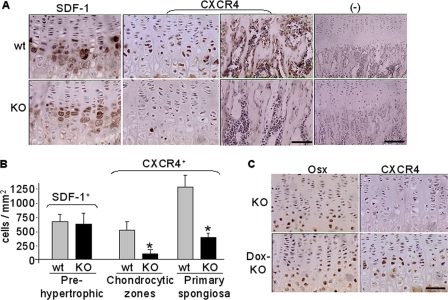
To understand molecular and cellular changes associated with bone defects in Osx::CXCR4fl/fl mice, we examined the epiphyseal growth plate where bone formation occurs on a cartilaginous template (44, 45). In both Osx::CXCR4fl/fl mice and littermate controls, SDF-1 expression was detected mainly in prehypertrophic and hypertrophic chondrocytes and sporadically in bone marrow cells (Fig. 6A), and similar numbers of SDF-1-positive cells were found between Osx::CXCR4fl/fl mice and controls (Fig. 6B). In littermate control mice, CXCR4 expression was detected in chondrocytic cells across the proliferative and hypertrophic zones and also continued in the adjacent primary spongiosa by osteoblastic cells and marrow cells (Fig. 6A). However, in both regions of Osx::CXCR4fl/fl mice, CXCR4 expression was markedly reduced (Fig. 6A). Histomorphometric analysis showed that, when compared with controls, the number of cells positive for CXCR4 staining was 82% less in a chondrocytic region and 70% less in a region of primary spongiosa in Osx::CXCR4fl/fl mice (Fig. 6B). This pattern of CXCR4 deletion indicated that Osx promoter-driven Cre activities occurred not only in osteoblastic cells as expected but also in chondrocytes of Osx::CXCR4fl/fl mice. In support of this notion, our immunohistochemistry results showed the expression of Osx itself in some chondrocytic cells in the growth plate (Fig. 6C). Moreover, in Osx::CXCR4fl/fl mice that were treated with doxycycline to inactivate the Osx-controlled Cre transcription and recombination (41, 42), we found that CXCR4 loss in chondrocytes was rescued (Fig. 6C). No positive staining for SDF-1 or CXCR4 was observed when using isotype-matched control antibodies (Fig. 6A). This expression pattern of CXCR4 and SDF-1 implicates a role of SDF-1/CXCR4 signaling in regulating the transition of cartilage to bone.
FIGURE 6.
Decreased CXCR4 expression in epiphyseal growth plate of Osx::CXCR4fl/fl mice (KO) versus Cre-null littermate controls (WT). A, immunohistochemistry for SDF-1 expression in pre- and hypertrophic chondrocytes and CXCR4 expression in chondrocytic cells and in primary spongiosa (scale bar equals 50 μm). Negative (−) controls used isotype-matched control antibodies (scale bar equals 100 μm). B, histomorphometric analysis (OsteoII software, Bioquant) for the number of cells positive for SDF-1 or CXCR4 expression. The number of cells positive for SDF-1 immunostaining was measured from the pre- to hypertrophic zones. The number of cells positive for CXCR4 was measured in three regions (each at 185 × 250 μm2) in the middle of the growth plate or the primary spongiosa. Five measurements per section for three consecutive sections were taken to average each sample. C, immunohistochemistry for Osx and CXCR4 expression in growth plate of KO mice and control KO mice that were treated with doxycycline (200 μg/ml in drinking water) after birth (Dox-KO). n = 5 (three females and two males; 4 weeks old) WT or KO mice. Measurements are presented as mean ± S.D. *, p < 0.05 versus respective WT control.
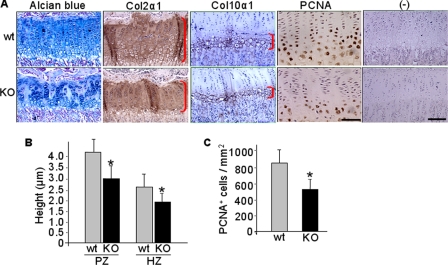
Next, we examined chondrocyte and osteoblast activities in the growth plate under the influence of CXCR4 deficiency. When compared with littermate controls, as shown by Alcian blue staining, columnar chondrocytes in the proliferative zone of Osx::CXCR4fl/fl mice appeared to be disorganized with mixed cell size and shape, and no smooth progression in cell size occurred when moving from proliferative to prehypertrophic and hypertrophic zones (Fig. 7A). Immunostaining for Col2α1 and Col10α1, specific collagens produced by proliferative and hypertrophic chondrocytes, respectively, further suggested reduced cartilaginous matrix syntheses in Osx::CXCR4fl/fl mice versus controls (Fig. 7A). The height of the Col2α1-stained proliferative zone and Col10α1-stained hypertrophic zone was 27 and 23% shorter, respectively, in Osx::CXCR4fl/fl mice than those of controls (Fig. 7B). Moreover, PCNA immunohistochemistry (Fig. 7A) indicated reduced proliferation in growth plate chondrocytes as there were 36% fewer cells positive for PCNA staining in Osx::CXCR4fl/fl mice compared with controls (Fig. 7C). These observations suggest that reduced proliferation and size of a cartilaginous template in Osx::CXCR4fl/fl mice correlate to the reduced long bone size in these mice.
FIGURE 7.
Epiphyseal growth plate disorganization in tibiae of Osx::CXCR4fl/fl mice. A, representative Alcian blue staining; immunohistochemistry for Col2α1, Col10α1, and PCNA; and negative (−) controls using isotype-matched control antibody. The scale bar equals 50 μm in PCNA-stained sections or 100 μm in the rest of the sections. B, histomorphometric analysis (OsteoII, Bioquant) for the height of the proliferative (PZ) and hypertrophic zones (HZ) in the middle of the growth plate (indicated by right brackets in A). C, histomorphometric measurements for the number of PCNA-stained cells from the proliferative to hypertrophic zones. Five measurements per section for three consecutive sections were taken to average each sample. n = 5 (three females and two males; 4 weeks old) WT or KO mice. Measurements are presented as mean ± S.D. *, p < 0.05 versus WT control.
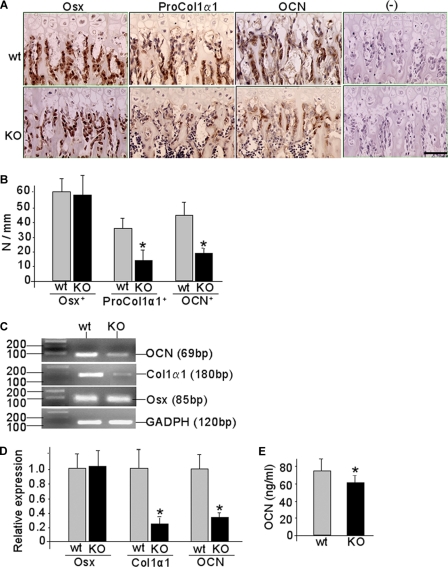
CXCR4 deficiency also affected osteoblast activities in the primary spongiosa where osteoblasts differentiate and lay down new bone matrix on the hypertrophic chondrocyte residues (44, 45). Our immunohistochemistry showed strong Osx expression in osteoblastic cells of the primary spongiosa in both Osx::CXCR4fl/fl and control mice (Fig. 8A), and no significant difference in the number of Osx-expressing cells was observed between Osx::CXCR4fl/fl mice and controls (Fig. 8B). We further detected the expression of ProCol1α1, a marker of initial collagen synthesis in relatively mature osteoblastic cells, along with OCN, a protein typically synthesized by mature osteoblasts, in the primary spongiosa by osteoblastic cells lining the trabecular bone surfaces (Fig. 8A). However, histomorphometric analysis showed that the number of cells positively stained for ProCol1α1 and OCN per bone surface was 62 and 56% less, respectively, in Osx::CXCR4fl/fl mice than that of controls (Fig. 8B). This suggests an arrested osteoblast progression toward mature osteoblasts in the growth plate of Osx::CXCR4fl/fl mice.
FIGURE 8.
Arrested osteoblast progression in Osx::CXCR4fl/fl mice. A, representative immunohistochemistry for Osx, ProCol1α1, and OCN in the primary spongiosa of Osx::CXCR4fl/fl (KO) mice and Cre-null littermate controls (WT). Isotype-matched control IgGs were used in negative (−) controls. The scale bar equals 50 μm. B, histomorphometric analysis (OsteoII, Bioquant) for the number of positively stained cells per bone surface in three regions (each at 185 × 250 μm2) in the middle of the primary spongiosa. Five measurements per section for three consecutive sections were taken to average each sample. n = 5 (three females and two males; 4 weeks old) WT or KO mice. C, representative RT-PCR detection for Osx, Col1α1, Ocn, and Gapdh control in long bones derived from newborn (days 1–3 after birth) KO or WT mice. D, qPCR quantification of the expression level of Osx, Col1α1, and Ocn relative to Gapdh control in long bones derived from newborn KO or WT mice. n = 5 WT or KO. E, serum OCN level in KO mouse versus WT controls. n = 5 (three females and two males; 12 weeks old). All measurements are presented as mean ± S.D. *, p < 0.05 versus WT control.
Additional evidence for impaired osteoblast development was obtained in long bones derived from newborn Osx::CXCR4fl/fl mice that showed reduced Cxcr4 expression compared with that of littermate controls (Fig. 1B). Our RT-PCR results revealed similar Osx expression but reduced Col1α1 and Ocn expression in bones of Osx::CXCR4fl/fl mice versus those of controls (Fig. 8C). Moreover, qPCR analysis showed that the level of Col1α1 and Ocn expression relative to Gapdh control was reduced by 74 and 68%, respectively, in bone of Osx::CXCR4fl/fl mice compared with control mice, whereas no significant decrease was detected in the level of Osx expression in Osx::CXCR4fl/fl bones (Fig. 8D). Consistent with decreased gene expression of Ocn in bone, a 17% reduction in the serum level of OCN was further detected in adult Osx::CXCR4fl/fl mice when compared with control mice (Fig. 8E), whereas no significant increase in the serum level of tartrate-resistant acid phosphatase was found in Osx::CXCR4fl/fl mice (data not shown). Taken together, these findings suggest that lower bone mass in Osx::CXCR4fl/fl mice was associated with decreased bone formation via impaired osteoblast development.
CXCR4 Deficiency Inhibited Cell Proliferation and Impaired BMP-induced Osteoblast Differentiation
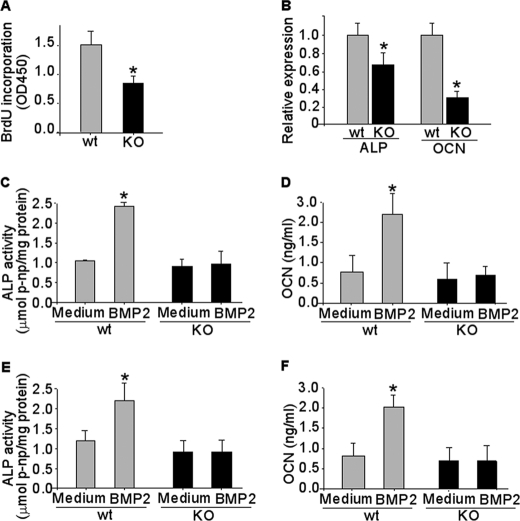
To gain further insights into the function of CXCR4 in osteoblast activities, we examined calvaria cells derived from newborn Osx::CXCR4fl/fl mice (proved to be CXCR4-deficient; Fig. 1C) and littermate controls for cell proliferation and differentiation in response to BMP stimulation. A 43% lower BrdU incorporation was detected in cells of Osx::CXCR4fl/fl mice versus cells of control mice, suggesting a lower proliferation rate in CXCR4-deficient osteoblasts (Fig. 9A). Moreover, similar to our detection of arrested osteoblast progression in long bones, a 32% lower level of Alp expression and a 70% lower level of Ocn expression relative to Gapdh control were detected in calvaria cells of Osx::CXCR4fl/fl mice versus cells of control mice (Fig. 9B). After stimulation with BMP2, a member of the BMP family, in calvaria cells of control mice, both levels of ALP activity (Fig. 9C) and OCN synthesis (Fig. 9D) were significantly increased (2.4-fold for ALP at day 4 and 4-fold for OCN at day 7) over base-line levels in cultures maintained in medium only. In contrast, there was no increase in either ALP (Fig. 9C) or OCN (Fig. 9D) in BMP2-stimulated calvaria cells of Osx::CXCR4fl/fl mice versus medium-only controls. Similarly, stimulation with BMP6, another member of the BMP family, significantly increased the level of ALP (1.8-fold at day 4) and OCN (2.5-fold at day 7) in calvaria cells of control mice, whereas no response to BMP6 stimulation was detected in calvaria cells of Osx::CXCR4fl/fl mice (Fig. 9, E and F). These data suggest that CXCR4 deficiency inhibits osteoblastic differentiation of calvaria cells induced by two members of the BMP family.
FIGURE 9.
CXCR4 deficiency inhibits cell proliferation and osteoblast differentiation induced by BMP. Primary osteoblastic cells were derived from newborn (days 1–3 after birth) calvariae of Osx::CXCR4fl/fl (KO) mice and Cre-null littermate controls (WT). A, BrdU incorporation for 6 h in WT or KO calvaria cells. B, qPCR measurements of base-line mRNA levels of Alp and Ocn relative to Gapdh control in calvaria cells of WT or KO mice. C–F, calvaria cells were stimulated with rhBMP2 (C and D) or rhBMP6 (E and F) protein at 100 ng/ml for 4 or 7 days or were maintained in culture medium without any stimulation as controls. ALP activities were measured in cell lysates and normalized to the level of total cellular protein. OCN levels were measured in cell medium using ELISA. Cultures were pooled from calvariae of n = 3 WT or KO mice, and triplicate wells of cells were used for each sample. Experiments were repeated twice using mice from two different litters. Measurements are expressed as mean ± S.D. *, p < 0.05 versus respective medium-only control.
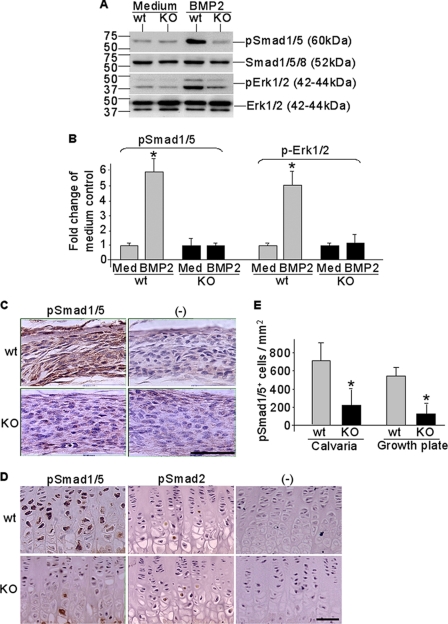
Our Western blotting results further showed impaired BMP signaling cascades in CXCR4-deficient calvaria cells (Fig. 10, A and B). Although BMP2 stimulation rapidly induced phosphorylation of intracellular R-Smads (Smad1/5/8) and Erk1/2, the key downstream targets of BMP signal transduction, in calvaria cells derived from control mice, no BMP2-stimulated phosphorylations of R-Smads and Erk were observed in CXCR4-deficient calvaria cells derived from Osx::CXCR4fl/fl mice (Fig. 10A). Gel image analysis showed that, when compared with medium-only control cells, the intensities of immunoreactive bands for phosphorylated (p) Smad1/5 and pErk1/2 were increased 5- and 4-fold, respectively, in BMP2-stimulated calvaria cells derived from control mice; in contrast, no significant increases in band intensities of pSmad1/5 and pErk1/2 after BMP2 stimulation were detected in calvaria cells of Osx::CXCR4fl/fl mice (Fig. 10B).
FIGURE 10.
Impaired BMP signaling in CXCR4-deficient cells and bone tissues. Calvaria osteoblasts were derived from newborn (days 1–3 after birth) Osx::CXCR4fl/fl (KO) mice or Cre-null littermate controls (WT). Cells were stimulated with rhBMP2 at 100 ng/ml for 15 min or were maintained in culture medium (Med) only as controls. A and B, Western detection of Smad1/5 and Erk1/2 phosphorylation relative to unphosphorylated total Smads and Erk (A) and gel image analysis for band intensities of pSmad1/5 and pErk1/2 compared with that of medium-only control cells (B). Cultures were pooled from calvariae of n = 3 WT or KO mice, and triplicate wells of cells were used for each sample. Experiments were repeated twice using mice from two different litters. Measurements are expressed as mean ± S.D. *, p < 0.05 versus respective medium-only control. C–E, immunohistochemistry detection of pSmad1/5 expression in calvaria (C) and pSmad1/5 and pSmad2 expression in tibia growth plate (D) followed by histomorphometric analysis (OsteoII, Bioquant) for the number of positively stained cells in three regions of calvaria (each at 185 × 250 μm2) and from the pre- to hypertrophic zones in the growth plate of tibia (E). Isotype-matched control IgGs were used in negative (−) controls. The scale bar equals 50 μm in calvaria or growth plate sections. Five measurements per section for three consecutive sections were taken to average each sample. n = 5 (three females and two males; 4 weeks old) WT or KO. All measurements are expressed as mean ± S.D. *, p < 0.05 versus respective WT control.
Moreover, we compared Osx::CXCR4fl/fl mice with control mice for Smad1/5 phosphorylation in both calvaria (Fig. 10C) and the epiphyseal growth plate (Fig. 10D) by immunohistochemistry. In calvariae, the number of cells positive for pSmad1/5 staining was reduced by 72% in Osx::CXCR4fl/fl mice versus controls (Fig. 10E). In tibiae, pSmad1/5 expression was detected in pre- and hypertrophic chondrocytes in the growth plate (Fig. 10D), where the number of cells expressing pSmad1/5 was reduced by 76% in Osx::CXCR4fl/fl mice when compared with that of control mice (Fig. 10E). Other than BMP-regulated Smads, we also examined Smad2, a key intracellular transducer for TGFβ1/2/3 signaling, in the growth plate. Our data showed weak pSmad2 expression in Osx::CXCR4fl/fl mice similar to that in control mice (Fig. 10D), confirming the specific involvement of BMP signaling rather than other members of the TGFβ superfamily in this case. Collectively, these data showed impaired BMP signaling in CXCR4-deficient cells and bone tissues, and thus suggest that CXCR4 functions in regulating osteoblast activities in cooperation with BMP signaling.
DISCUSSION
The current literature illustrates multiple functions of CXCR4 in embryonic organ development, HIV and tumor invasion, and various tissue homeostasis and repair processes that require the chemotactic interaction of CXCR4 with its ligand, SDF-1 (1–7, 9–16). However, it remains unknown whether CXCR4 has a direct functional role in bone formation. In this study, we addressed this question by demonstrating the effect of bone-specific deletion of CXCR4 on postnatal skeletal development of the mouse and identified the function of CXCR4 in regulating osteoblast development. This finding enhances the current understanding of CXCR4 with a novel concept that CXCR4, the essential signaling component for SDF-1, is required for proper bone formation.
Via the transcriptional control of Osx, we were able to target CXCR4 deletion in osteoprecursor cells and thus focused on analyzing the role of CXCR4 during bone formation. However, we noticed that CXCR4 was not completely removed with this approach as evidenced by trace CXCR4 expression remaining in the Osx-expressing cells and bones (Fig. 1, B and C). This might have lessened the severity of bone defects in Osx::CXCR4fl/fl mice resulting from CXCR4 deficiency. Although Osx is considered as one of the osteoblastic lineage-specific transcription factors, we observed CXCR4 deletion in both osteoblasts and growth plate chondrocytes of Osx::CXCR4fl/fl mice (Fig. 6, A–C), suggesting that broader Cre activities occurred in both osteoblastic and chondrocytic cells. We further verified this point by shutting down the Osx-driven Cre activity with doxycycline administration, which restored CXCR4 expression in chondrocytes of Osx::CXCR4fl/fl mice (Fig. 6C). In agreement with our findings, several previous studies also reported Osx expression in chondrocytes (35, 46). Moreover, when using R26LacZ reporter mice, the Osx-controlled Cre activity was originally noticed in chondrocytic cells in the Osx-Cre strain (41, 42). Similar to previous findings of CXCR4 and SDF-1 expression in the growth plate of a long bone (26, 28, 47), we also detected their expression in the growth plate of Cre-null littermate controls for Osx::CXCR4fl/fl mice. The pattern of CXCR4 expression in the growth plate and adjacent primary spongiosa and SDF-1 expression in pre- and hypertrophic chondrocytes at the chondro-osseous junction indicates that SDF-1 may function in both chondrocytes and osteoblasts via signaling through CXCR4. Moreover, this pattern of SDF-1 expression may serve to recruit CXCR4-expressing progenitor cells at blood vessel invasion to lay down new bone on the hypertrophic chondrocyte residues. Our detection of SDF-1 expression pattern in 4-week-old mice is different from that reported by Wei et al. (34) in newborn (day 1) mice in which SDF-1 was predominantly expressed in bone marrow next to hypertrophic chondrocytes, suggesting an age-related change in cellular distribution of SDF-1 that may be associated with SDF-1 function at different stages of bone development. This hypothesis remains to be tested.
A growth plate controls the size and shape of a long bone; therefore, a shorter cartilaginous template with decreased chondrocyte proliferation and collagen matrix synthesis in the growth plate of Osx::CXCR4fl/fl mice correlates to the reduced long bone size in these mice. Lower BMD and reduced cortical thickness and trabecular bone volume in tibiae of Osx::CXCR4fl/fl mice (Fig. 3, A–C) suggest that CXCR4 is required as an endogenous regulator for skeletal size and bone architecture. Moreover, a slower bone mineralization rate (Fig. 5, A–B) further correlates to growth retardation in the skeletal development of Osx::CXCR4fl/fl mice (Fig. 2C). Although we also detected decreased bone mass in calvariae of Osx::CXCR4fl/fl mice, their BMD was not significantly reduced as we found in tibiae. This suggests differential roles of CXCR4 in intramembranous and endochondral ossification alone or via interacting with other signaling pathways that participate in these processes. When looking into mechanisms underlying bone defects in Osx::CXCR4fl/fl mice, we identified reduced Col1α1 and OCN expression relative to unreduced Osx expression in osteoblastic cells adjacent to growth plate (Fig. 8, A and B), suggesting an arrested osteoblast progression toward mature osteoblasts in these mice. Concomitantly, a lesser expression of mature osteoblast markers was found in long bones of newborn mice and serum of adult mice (Fig. 8, C–E). Taken together, these findings suggest that arrested osteoblast development contributes, at least in part, to the reduced bone formation in Osx::CXCR4fl/fl mice.
Decreased proliferation and a blunted response to BMP2 or BMP6 osteoblast differentiation in primary calvaria cells of Osx::CXCR4fl/fl mice add additional evidence to CXCR4 function in osteoblast activities. The findings that CXCR4-deficienct cells did not express sufficient levels of ALP activities and did not adequately synthesize OCN protein after BMP stimulation (Fig. 9, C–F) are consistent with our previous detections in cultures for bone marrow stromal cells and C2C12 and ST2 cells, where blocking SDF-1/CXCR4 by siRNA, antibody, or antagonist against SDF-1 or CXCR4 inhibits the BMP2-induced cell differentiation toward the osteoblast lineage (25, 33). Moreover, suppressed BMP signaling cascades were detected in calvaria-derived cells as well as in CXCR4-deficient long bones and calvariae of Osx::CXCR4fl/fl mice (Fig. 10, A–E). Furthermore, no suppression of pSmad2 in CXCR4-deficient tibiae excluded the involvement of other members of the TGFβ superfamily. These findings demonstrated an in vivo interaction between CXCR4 and BMP in bone and suggest that CXCR4 regulates osteoblast development in postnatal bone formation involving its cooperation with BMP signaling. Future studies are required to determine the roles of different members of the BMP family in CXCR4-regulated bone formation.
In conclusion, our data suggest that loss of Cxcr4 gene in the Osx-expressing osteoprecursors results in impaired bone development and growth in the mouse skeleton, and this is associated with the regulation of CXCR4 in osteoblast development. These findings established a direct functional role of CXCR4 in bone formation in vivo. Targeting the SDF-1/CXCR4 pathway will deepen our understanding of the molecular regulation of osteogenesis and will help to develop new therapeutic targets to treat defective bone formation and regeneration ranging from metabolic bone diseases to fracture non-unions.
Acknowledgment
We thank Dr. Yong-Rui Zou at Columbia University for kindly providing CXCR4fl/fl mice.
This work was supported, in whole or in part, by National Institutes of Health Grant AR046121 from the NIAMS-funded Musculoskeletal Repair and Regeneration Core Centers. This work was also supported by grants from the Arthritis Foundation and Beatrice and Samuel A. Seaver Foundation.
- CXCR4
- cysteine (C)-X-C motif chemokine receptor 4
- SDF-1
- stromal cell-derived factor-1
- BMP
- bone morphogenic protein
- R-Smads
- BMP receptor-regulated Smads
- Osx
- osterix
- ProCol1α1
- proform of type I collagen α1
- Col2α1
- type II collagen α1
- Col10α1
- type X collagen α1
- PCNA
- proliferating cell nuclear antigen
- ALP
- alkaline phosphatase
- OCN
- osteocalcin
- CXCR4fl/fl
- floxed CXCR4
- rh
- recombinant human
- μCT
- microcomputed tomography
- MAR
- mineral apposition rate
- qPCR
- quantitative real time PCR
- Bis-Tris
- 2-[bis(2-hydroxyethyl)amino]-2-(hydroxymethyl)propane-1,3-diol
- BV/TV
- bone volume fraction (bone volume/tissue volume)
- Ct.Th
- cortical thickness
- BMD
- bone mineral density
- p
- phosphorylated
- fl
- floxed.
REFERENCES
- 1. Shirozu M., Nakano T., Inazawa J., Tashiro K., Tada H., Shinohara T., Honjo T. (1995) Genomics 28, 495–500 [DOI] [PubMed] [Google Scholar]
- 2. D'Apuzzo M., Rolink A., Loetscher M., Hoxie J. A., Clark-Lewis I., Melchers F., Baggiolini M., Moser B. (1997) Eur. J. Immunol. 27, 1788–1793 [DOI] [PubMed] [Google Scholar]
- 3. Yu L., Cecil J., Peng S. B., Schrementi J., Kovacevic S., Paul D., Su E. W., Wang J. (2006) Gene 374, 174–179 [DOI] [PubMed] [Google Scholar]
- 4. Zlotnik A., Yoshie O. (2000) Immunity 12, 121–127 [DOI] [PubMed] [Google Scholar]
- 5. Nagasawa T., Hirota S., Tachibana K., Takakura N., Nishikawa S., Kitamura Y., Yoshida N., Kikutani H., Kishimoto T. (1996) Nature 382, 635–638 [DOI] [PubMed] [Google Scholar]
- 6. Ma Q., Jones D., Borghesani P. R., Segal R. A., Nagasawa T., Kishimoto T., Bronson R. T., Springer T. A. (1998) Proc. Natl. Acad. Sci. U.S.A. 95, 9448–9453 [DOI] [PMC free article] [PubMed] [Google Scholar]
- 7. Zou Y. R., Kottmann A. H., Kuroda M., Taniuchi I., Littman D. R. (1998) Nature 393, 595–599 [DOI] [PubMed] [Google Scholar]
- 8. Diaz G. A. (2005) Immunol. Rev. 203, 235–243 [DOI] [PubMed] [Google Scholar]
- 9. Baggiolini M. (1998) Nature 392, 565–568 [DOI] [PubMed] [Google Scholar]
- 10. Aiuti A., Tavian M., Cipponi A., Ficara F., Zappone E., Hoxie J., Peault B., Bordignon C. (1999) Eur. J. Immunol. 29, 1823–1831 [DOI] [PubMed] [Google Scholar]
- 11. Yu X., Huang Y., Collin-Osdoby P., Osdoby P. (2003) J. Bone Miner. Res. 18, 1404–1418 [DOI] [PubMed] [Google Scholar]
- 12. Dar A., Kollet O., Lapidot T. (2006) Exp. Hematol. 34, 967–975 [DOI] [PubMed] [Google Scholar]
- 13. Gronthos S., Simmons P. J., Graves S. E., Robey P. G. (2001) Bone 28, 174–181 [DOI] [PubMed] [Google Scholar]
- 14. Peled A., Kollet O., Ponomaryov T., Petit I., Franitza S., Grabovsky V., Slav M. M., Nagler A., Lider O., Alon R., Zipori D., Lapidot T. (2000) Blood 95, 3289–3296 [PubMed] [Google Scholar]
- 15. Kitaori T., Ito H., Schwarz E. M., Tsutsumi R., Yoshitomi H., Oishi S., Nakano M., Fujii N., Nagasawa T., Nakamura T. (2009) Arthritis Rheum. 60, 813–823 [DOI] [PubMed] [Google Scholar]
- 16. Otsuru S., Tamai K., Yamazaki T., Yoshikawa H., Kaneda Y. (2008) Stem Cells 26, 223–234 [DOI] [PubMed] [Google Scholar]
- 17. Lataillade J. J., Clay D., Dupuy C., Rigal S., Jasmin C., Bourin P., Le Bousse-Kerdilès M. C. (2000) Blood 95, 756–768 [PubMed] [Google Scholar]
- 18. Majka M., Ratajczak J., Lee B., Honczarenko M., Douglas R., Kowalska M. A., Silberstein L., Gewirtz A. M., Ratajczak M. Z. (2000) Stem Cells 18, 128–138 [DOI] [PubMed] [Google Scholar]
- 19. Ji J. F., He B. P., Dheen S. T., Tay S. S. (2004) Stem Cells 22, 415–427 [DOI] [PubMed] [Google Scholar]
- 20. Hill W. D., Hess D. C., Martin-Studdard A., Carothers J. J., Zheng J., Hale D., Maeda M., Fagan S. C., Carroll J. E., Conway S. J. (2004) J. Neuropathol. Exp. Neurol. 63, 84–96 [DOI] [PubMed] [Google Scholar]
- 21. Ratajczak M. Z., Majka M., Kucia M., Drukala J., Pietrzkowski Z., Peiper S., Janowska-Wieczorek A. (2003) Stem Cells 21, 363–371 [DOI] [PubMed] [Google Scholar]
- 22. Hatch H. M., Zheng D., Jorgensen M. L., Petersen B. E. (2002) Cloning Stem Cells 4, 339–351 [DOI] [PubMed] [Google Scholar]
- 23. Tögel F., Isaac J., Hu Z., Weiss K., Westenfelder C. (2005) Kidney Int. 67, 1772–1784 [DOI] [PubMed] [Google Scholar]
- 24. Ceradini D. J., Kulkarni A. R., Callaghan M. J., Tepper O. M., Bastidas N., Kleinman M. E., Capla J. M., Galiano R. D., Levine J. P., Gurtner G. C. (2004) Nat. Med. 10, 858–864 [DOI] [PubMed] [Google Scholar]
- 25. Zhu W., Boachie-Adjei O., Rawlins B. A., Frenkel B., Boskey A. L., Ivashkiv L. B., Blobel C. P. (2007) J. Biol. Chem. 282, 18676–18685 [DOI] [PubMed] [Google Scholar]
- 26. Sun Y. X., Schneider A., Jung Y., Wang J., Dai J., Wang J., Cook K., Osman N. I., Koh-Paige A. J., Shim H., Pienta K. J., Keller E. T., McCauley L. K., Taichman R. S. (2005) J. Bone Miner. Res. 20, 318–329 [DOI] [PubMed] [Google Scholar]
- 27. Kortesidis A., Zannettino A., Isenmann S., Shi S., Lapidot T., Gronthos S. (2005) Blood 105, 3793–3801 [DOI] [PubMed] [Google Scholar]
- 28. Jung Y., Wang J., Schneider A., Sun Y. X., Koh-Paige A. J., Osman N. I., McCauley L. K., Taichman R. S. (2006) Bone 38, 497–508 [DOI] [PubMed] [Google Scholar]
- 29. Salvucci O., Yao L., Villalba S., Sajewicz A., Pittaluga S., Tosato G. (2002) Blood 99, 2703–2711 [DOI] [PubMed] [Google Scholar]
- 30. Petit I., Szyper-Kravitz M., Nagler A., Lahav M., Peled A., Habler L., Ponomaryov T., Taichman R. S., Arenzana-Seisdedos F., Fujii N., Sandbank J., Zipori D., Lapidot T. (2002) Nat. Immunol. 3, 687–694 [DOI] [PubMed] [Google Scholar]
- 31. Ponomaryov T., Peled A., Petit I., Taichman R. S., Habler L., Sandbank J., Arenzana-Seisdedos F., Magerus A., Caruz A., Fujii N., Nagler A., Lahav M., Szyper-Kravitz M., Zipori D., Lapidot T. (2000) J. Clin. Investig. 106, 1331–1339 [DOI] [PMC free article] [PubMed] [Google Scholar]
- 32. Wynn R. F., Hart C. A., Corradi-Perini C., O'Neill L., Evans C. A., Wraith J. E., Fairbairn L. J., Bellantuono I. (2004) Blood 104, 2643–2645 [DOI] [PubMed] [Google Scholar]
- 33. Hosogane N., Huang Z., Rawlins B. A., Liu X., Boachie-Adjei O., Boskey A. L., Zhu W. (2010) Int. J. Biochem. Cell Biol. 42, 1132–1141 [DOI] [PMC free article] [PubMed] [Google Scholar]
- 34. Wei L., Kanbe K., Lee M., Wei X., Pei M., Sun X., Terek R., Chen Q. (2010) Dev. Biol. 341, 236–245 [DOI] [PMC free article] [PubMed] [Google Scholar]
- 35. Nakashima K., Zhou X., Kunkel G., Zhang Z., Deng J. M., Behringer R. R., de Crombrugghe B. (2002) Cell 108, 17–29 [DOI] [PubMed] [Google Scholar]
- 36. Ducy P., Zhang R., Geoffroy V., Ridall A. L., Karsenty G. (1997) Cell 89, 747–754 [DOI] [PubMed] [Google Scholar]
- 37. Otto F., Thornell A. P., Crompton T., Denzel A., Gilmour K. C., Rosewell I. R., Stamp G. W., Beddington R. S., Mundlos S., Olsen B. R., Selby P. B., Owen M. J. (1997) Cell 89, 765–771 [DOI] [PubMed] [Google Scholar]
- 38. Nie Y., Waite J., Brewer F., Sunshine M. J., Littman D. R., Zou Y. R. (2004) J. Exp. Med. 200, 1145–1156 [DOI] [PMC free article] [PubMed] [Google Scholar]
- 39. Nie Y., Han Y. C., Zou Y. R. (2008) J. Exp. Med. 205, 777–783 [DOI] [PMC free article] [PubMed] [Google Scholar]
- 40. Agarwal U., Ghalayini W., Dong F., Weber K., Zou Y. R., Rabbany S. Y., Rafii S., Penn M. S. (2010) Circ. Res. 107, 667–676 [DOI] [PMC free article] [PubMed] [Google Scholar]
- 41. Rodda S. J., McMahon A. P. (2006) Development 133, 3231–3244 [DOI] [PubMed] [Google Scholar]
- 42. Berman S. D., Calo E., Landman A. S., Danielian P. S., Miller E. S., West J. C., Fonhoue B. D., Caron A., Bronson R., Bouxsein M. L., Mukherjee S., Lees J. A. (2008) Proc. Natl. Acad. Sci. U.S.A. 105, 11851–11856 [DOI] [PMC free article] [PubMed] [Google Scholar]
- 43. McLeod M. J. (1980) Teratology 22, 299–301 [DOI] [PubMed] [Google Scholar]
- 44. Kronenberg H. M. (2003) Nature 423, 332–336 [DOI] [PubMed] [Google Scholar]
- 45. Karsenty G. (2003) Nature 423, 316–318 [DOI] [PubMed] [Google Scholar]
- 46. Koyama E., Young B., Nagayama M., Shibukawa Y., Enomoto-Iwamoto M., Iwamoto M., Maeda Y., Lanske B., Song B., Serra R., Pacifici M. (2007) Development 134, 2159–2169 [DOI] [PMC free article] [PubMed] [Google Scholar]
- 47. Wang Y., Zhang M., Middleton F. A., Horton J. A., Pritchard M., Spadaro J. A., Farnum C. E., Damron T. A. (2007) Cells Tissues Organs 186, 192–203 [DOI] [PubMed] [Google Scholar]


