

Abstract
The SLC26/SulP (solute carrier/sulfate transporter) proteins are a superfamily of anion transporters conserved from bacteria to man, of which four have been identified in human diseases. Proteins within the SLC26/SulP family exhibit a wide variety of functions, transporting anions from halides to carboxylic acids. The proteins comprise a transmembrane domain containing between 10–12 transmembrane helices followed a by C-terminal cytoplasmic sulfate transporter and anti-sigma factor antagonist (STAS) domain. These proteins are expected to undergo conformational changes during the transport cycle; however, structural information for this family remains sparse, particularly for the full-length proteins. To address this issue, we conducted an expression and detergent screen on bacterial Slc26 proteins. The screen identified a Yersinia enterocolitica Slc26A protein as the ideal candidate for further structural studies as it can be purified to homogeneity. Partial proteolysis, co-purification, and analytical size exclusion chromatography demonstrate that the protein purifies as stable oligomers. Using small angle neutron scattering combined with contrast variation, we have determined the first low resolution structure of a bacterial Slc26 protein without spectral contribution from the detergent. The structure confirms that the protein forms a dimer stabilized via its transmembrane core; the cytoplasmic STAS domain projects away from the transmembrane domain and is not involved in dimerization. Supported by additional biochemical data, the structure suggests that large movements of the STAS domain underlie the conformational changes that occur during transport.
Keywords: Membrane Proteins, Neutron Scattering, Protein Domains, Protein Purification, Protein Structure, SulP/SLC26, Contrast Variation, Membrane Protein, Small Angle Neutron Scattering, Structure
Introduction
The SLC26/SulP4 proteins are a superfamily of anion transporters conserved from bacteria to man (1). The human genome encodes at least 10 SLC26 proteins that play critical roles in cell physiology and are medically important, being implicated in genetic diseases such as diastrophic dysplasia, congenital chloride diarrhea, Pendred syndrome, and nonsyndromic deafness (2, 3). Proteins within the SLC26/SulP family exhibit a wide variety of functions, transporting anions ranging from halides to carboxylic acids. The molecular basis for this diversity, however, is poorly understood and structural information is extremely limited. A model of the transmembrane region containing 12 transmembrane helices has been published for the Synechococcus Slc26 protein BicA, and it has been proposed that this topology may apply across the family (4). A conserved stoichiometry within the family is the subject of debate as several members, across multiple species, have been reported to form dimers and/or tetramers (5–7). The only high resolution structural data available to date is for the cytoplasmic sulfate transporter and anti-sigma factor antagonist (STAS) domain, which is fused to the C terminus of the transmembrane domain (8–10).
SLC26 transporters must undergo sequential conformational changes during the transport cycle as typified by prestin (SLC26A5), the cochlear protein that enables animals to efficiently detect high frequency sounds (11, 12). Upon binding and/or transporting Cl−/HCO3−, prestin transduces a major conformational change into considerable mechanical force leading to a change in the length of the cochlear outer hair cells. Although the motor function of prestin may have evolved at the expense of its transport abilities (12), its electromotile function has evolved from the ability of this protein family to undergo dramatic molecular rearrangements (11, 13). Thus, characterizing the architecture of SLC26 transporters is of particular interest, paving the way to an understanding of their domain organization, structure, and associated conformational changes. Negative stain electron microscopy has been used to generate a low resolution structure of the full-length prestin from rat (5), revealing an apparent bullet-shaped molecule, however; in this case, it was difficult to judge the level of contribution of the associated detergent to the overall structure.
In this work, we have used small angle neutron scattering (SANS) combined with contrast variation to mask the detergent and obtain a low resolution model of a purified SLC26 protein alone in solution, giving the first insight into the domain organization of this important protein family. The structure of the Y. enterocolitica Slc26A2 protein shows a homodimer stabilized via its transmembrane core. Our low resolution structure, combined with other structural and biochemical information, provides a structural model for the conformational changes associated with the transport cycle in SLC26/SulP proteins.
EXPERIMENTAL PROCEDURES
Expression and Purification of YeSlc26A2
The GFP gene in the pWaldo-TEV-GFPe plasmid (14) was removed by PCR using two oligonucleotides (5′-ctggaagtacaggttttcggatccagg-3′ and 5′-aacctgtacttccagggtaaaaagcttgcggcccatcatcatcC-3′) to generate the plasmid pArno. The Y. enterocolitica Yeslc26a2 gene (YE0973) was cloned into pArno between XhoI and BamHI sites using two oligonucleotides: 5′-atgcctcgagaatgtggcaggttttaaaatca-3′ (XhoI site underlined) and 5′-atgcggatcccctcaaatttccgctgagacg-3′ (BamHI site underlined).
YeSlc26A2 was overexpressed in Escherichia coli strain C41(DE3) and induced with 0.1 mm isopropyl 1-thio-β-d-galactopyranoside for 16 h. Cells were lysed by French press in a buffer containing 50 mm Tris-HCl, pH 8.0, 500 mm NaCl, 2 mm β-mercaptoethanol, 10% glycerol (immobilized metal affinity chromatography (IMAC) buffer) plus 0.2 mm PMSF, 10 μg/ml DNase, 2 mm MgCl2. The membrane fraction was solubilized with 2% n-dodecyl β-d-maltoside (Anatrace) and loaded onto a Co2+-affinity column (HisTrap, GE Healthcare). The column was washed with IMAC buffer containing 55 mm imidazole, 0.03% n-dodecyl β-d-maltoside, and the YeSlc26A2 protein was eluted using a linear 55–500 mm imidazole gradient. YeSlc26A2 was incubated with TEV protease (10/1 w/w ratio) at 4 °C, and the IMAC purification was repeated to remove noncleaved protein and the His-tagged TEV protease. YeSlc26A2 was further purified by gel filtration in 50 mm Tris-HCl, pH 8.0, 150 mm NaCl, 0.1% Fos-choline-12 (Anatrace). The purified YeSlc26A2 was concentrated by ultrafiltration with a nominal molecular mass limit of 100 kDa (Centricon 100-K, Millipore), then diluted to 4.94 mg/ml in 50 mm Tris-HCl, pH 8.0, 150 mm NaCl, 0.1% Fos-choline-12, 11% D2O, and dialyzed against the same buffer.
Expression and Purification of YeSlc26A2 STAS Domain
The YeSlc26A2 STAS domain (amino acids 381–483) was cloned into the pEHISTEV plasmid (15) between the NcoI and XhoI sites using two oligonucleotides: 5′-atgcccatggtggcgcatgtgatttatgcagag-3′ (NcoI site underlined) and 5′-atgcctcgagttacctcaaatttccgctgag-3′ (XhoI site underlined). The protein was overexpressed in E. coli BL21(DE3) cells and purified under the same conditions as the full-length protein except that the detergent was excluded.
Co-purification of His and FLAG-tagged YeSlc26A2
C-terminally FLAG-tagged Yeslc26a2 was synthesized by PCR using the following primers 5′-atgcgagctcaggaggaatacaccatgtggcaggttttaaaatcaccaaaac-3′ (SacI site underlined) and 5′-atgctctagatcatttatcatcatcatctttataatccgtcaaatttccgctgagacggct-3′ (XbaI site underlined) to clone into plasmid pBAD33 (16) using the SacI/XbaI sites. The sequence encoding C-terminally His-tagged Yeslc26a2 was introduced in between SmaI and SacI sites in pBADCHIS (15). Yeslc26a2 was synthesized by PCR using Yeslc26a2 in pArno as a template (see above) and the following primers 5′-atgccccgggatgtggcaggttttaaaatcacc-3′ (SmaI site underlined) and 5′-atgcgagctctcagtggtggtggtggtgatgatgatgggc-3′ (SacI site underlined). C41(DE3) cells were transformed (or cotransformed) with the pBADCHIS plasmid encoding the C-terminally His-tagged version and/or the pBAD33 plasmid harboring the C-terminal FLAG-tagged version of YeSlc26A2. Cells were induced using 0.02% arabinose and then harvested and lysed by French press, and membranes were solubilized as described above. The solubilized membranes were split into two fractions and incubated with Co2+-loaded Sepharose beads or anti-FLAG M2 affinity gel (Sigma). The Sepharose beads were washed stepwise with IMAC A buffer containing 25 and 35 mm imidazole and YeSlc26A2-His8 was eluted with 500 mm imidazole. The anti-FLAG M2 affinity gel was washed with IMAC A buffer and YeSlc26A2-FLAG was eluted with 0.1 mm glycine, pH 3.5. Samples were analyzed on SDS-PAGE. For the gel filtration analysis of the His/FLAG tag YeSlc26A2 oligomer, the oligomer was purified by IMAC as described in “Purification of YeSlc26A2” with the exclusion of the TEV proteolysis and second IMAC step.
SANS Experiments and Raw Data Reduction
All samples were measured at 6 °C at the SANS instrument D22 at the Institute Laue-Langevin (Grenoble, France). Raw data were reduced with the Institute Laue-Langevin software package and PRIMUS.
SANS Data Analysis
All samples were measured on instrument D22 at the Institute Laue-Langevin (Grenoble, France) in Hellma® quartz cuvettes 100QS with 1-mm optical path length. The sample temperature was kept at 6 °C during the exposure times. Scattering data from all samples were recorded at two instrumental detector/collimator configurations, 2m/2m and 8m/8m, using a neutron wavelength of λ = 6 Å. At each configuration, the H2O/D2O buffers, the empty beam, an empty quartz cuvette, as well as a boron sample (electronic background) were measured. Exposure times varied between 20 min (empty cell, boron) and 2 h (YeSlc26A2 at 11% D2O) according to sample and instrument setup. Transmissions were measured during 3-min exposure times for each sample. The raw data were reduced (detector efficiency, electronic background, angular averaging) using a standard Institute Laue-Langevin software package. Finally, the corrected scattered intensities I(Q) (Q = (4π/λ)sinθ, where 2θ is the scattering angle) from the two different Q ranges were merged, and the respective buffer signals were subtracted using the program “PRIMUS.”
Contrast Variation Series and Structural Properties of Fos-choline-12 Detergent
To find the contrast match-point of Fos-choline-12 a contrast series of Fos-choline-12 (C = 5 mg/ml) at 0, 10, 50, 90, and 100% D2O were measured and used to plot (I(0)/(TsC))1/2 as a function of percentage of D2O in the solvent (Ts, sample transmission; I, intensity). The measured transmissions Ts of the samples were 0.5286 (0% D2O), 0.5593 (10% D2O), 0.6906 (50% D2O), 0.8592 (90% D2O), and 0.9164 (100% D2O). The respective I(0) values determined were as follows (in the same order): 0.014, 0.001, 0.16, 0.771, and 1.217. The Fos-choline-12 contrast match point was determined by the intersection of a linear fit through all points with the abscissa (Fig. 2B).
FIGURE 2.

Oligomerization of YeSlc26A2. A, gel filtration trace (Superose 6 10/60) of YeSlc26A2 used to collect the SANS data. Inset, SDS-PAGE Coomassie Blue-stained gel of Superose 6 peak fraction. B, a mixture of His-tagged and untagged YeSlc26A2 was analyzed by IMAC. Samples (BC, before cleavage; AC, after cleavage; FT, IMAC flow-through; EL, IMAC elution) were analyzed by Coomassie Blue-stained SDS-PAGE. C, C-terminally His-tagged (His tag) and FLAG-tagged (FLAG tag) YeSlc26A2 were expressed or co-expressed and purified by parallel IMAC or anti-FLAG affinity chromatography as indicated in the table above the gels. Eluates were analyzed by Western blotting using an anti-His antibody (top panel), anti-FLAG antibody (middle panel), or visualized with Coomassie Blue (bottom panel). The additional band at 200 kDa observed on the top panel is only present in this preparation and is due to a contamination. D, the coexpressed His-/FLAG-tagged protein was analyzed by gel filtration on a Superose 6 10/60 column. Molecular mass standard proteins (thyroglobulin, 670 kDa; γ-globulin, 158 kDa; ovalbumin, 44 kDa; myoglobin, 17 kDa; vitamin B12, 1.35 kDa) are shown for comparison. Inset, fractions from the gel filtration peak were pooled and analyzed by Western blotting using anti-His (left) or anti-FLAG antibodies (right). The additional lower band on the left is only present in this preparation and is due to a contamination. The gel below the gel filtration trace represents 0.5-ml fractions collected during the elution of the His/FLAG oligomer. Mw, molecular mass marker (kDa). The gel filtration traces of the molecular mass standards have been normalized.
Molecular Weight, Radii of Gyration of YeSlc26A2 Determined by SANS
The radii of gyration Rg and the intensities in the forward scattering direction, I(0), of all samples were extracted by the Guinier approximation.
The validity of the Guinier approximation, RgQ ≤ 1.3, was verified and fulfilled in each case.
The protein molecular weight, was determined from the I(0) intensity at 11% D2O using absolute calibration against H2O under the assumption that the detergent (free micelles and bound) had a negligible contribution at the contrast match point.
Molecular weight of YeSlc26A2 determined by SANS
The protein molecular weight, Mw, was determined from the I(0) intensity in 11% D2O (17) under the assumption that the detergent (free micelles and protein bound) has a negligible contribution at the contrast conditions measured.
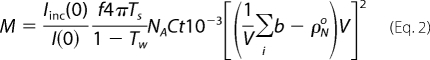 |
I(0) is the coherent macromolecular scattering in the forward direction, Iinc(0) is the incoherent scattering from the solvent in the forward direction, TS and TW are the transmissions of the sample and of water, respectively, C is the protein concentration in mg/ml, t is the thickness of the quartz cuvette in cm, f is a correction factor for the anisotropicity of the solvent scattering as a function of neutron wavelength, Σib is the scattering length density of the protein in cm (calculated from (18), ρN0 is the solvent neutron scattering density in cm−2, and V is the solvent-displaced protein volume in cm3. The values used were as follows: f = 0.82; t = 0.1 cm, I(0) = 0.0432, Iinc(0) = 1.00, TS = 0.567, TW = 0.531, NA = 6.023·1023, C = 4.94 mg/ml, V = 6.582·10−20 cm3, Σib = 1.21·10−9 cm, and ρN0 = 1.77·109 cm−2. (The solvent scattering density was calculated for 10.6% D2O, which was determined experimentally from the transmission analysis.)
Low Resolution Models Determined by Ab Initio Analysis Using DAMMIN
We used the program DAMMIN (19) to generate a low resolution envelope of YeSlc26A2 from the 5 mg/ml SANS data at the contrast match point of the Fos-choline-12 detergent. We used several variations of the program parameters using either default or expert mode with and without P2 symmetry to model the data up to Qmax = 0.141 Å−1. Beyond this Q value, the experimental data were too noisy to support a modeling procedure. The DAMMIN input files were generated using the program GNOM imposing the restraints p(r = 0) = 0 and p(r = Dmax) = 0 for the pair distance distribution function. The values of Dmax were varied between 110 and 130 Å. As a quality control, the radii of gyration determined from the pair distribution analyses were compared with that determined by the Guinier analysis of the SANS data (Rg = 40.7 ± 4.1 Å). The best results were obtained for Dmax = 120 Å, yielding a radius of gyration of 38.5 ± 2.6 Å from the p(r) function. Although DAMMIN only generates a single model, its mirror image molecule would also fulfill exactly the same criteria. Without independent information, it is impossible to judge which stereoisomer is correct. We used the fit to the recently published SLC26A6 model to select which DAMMIN model to use (20). MmSLC26A6 coordinates were supplied by Dr. Ehud Ohana (National Institutes of Health, Bethesda, MD).
RESULTS
YeSlc26A2 Purifies as Stable Oligomer
Mammalian integral membrane proteins are notoriously difficult to handle; thus, studies on prokaryotic homologues have proven crucial in characterizing the structure and function of their human counterparts (21). We cloned 27 genes encoding bacterial proteins (Fig. 1) that carried the SLC26 signatures (Prosite 01130) and cytoplasmic STAS domains (InterPro 002645). A subsequent expression and detergent screen identified the Y. enterocolitica protein YP001005307.1 (hereafter referred to as YeSlc26A2) as the ideal candidate for further structural studies as it can be purified to homogeneity in the detergent Fos-choline-12 and elutes as a single, stable and symmetrical peak from size exclusion chromatography (Fig. 2A). A first indication as to the oligomeric state of YeSlc26A2 came from its behavior during IMAC. Deliberate partial proteolysis of YeSlc26A2 expressed with a TEV protease-cleavable, C-terminal His-tag yielded a mixture of His-tagged and untagged proteins, as judged by SDS-PAGE (Fig. 2B) and Western immunoblot (data not shown). When purified by IMAC, the majority of the untagged protein flowed through the column. However, a small amount remained tightly bound and eluted with the tagged protein under high imidazole conditions, suggesting that YeSlc26A2 formed oligomers comprising tagged and untagged proteins (Fig. 2B). To further investigate the oligomeric state of YeSlc26A2, C-terminally FLAG- and His-tagged versions were co-expressed and purified by parallel IMAC and anti-FLAG affinity chromatography. When expressed in isolation the proteins were eluted from their expected affinity matrix and showed no cross-reactivity (Fig. 2C). However, when co-expressed the FLAG-tagged protein was eluted from the IMAC matrix, and the His-tagged protein was eluted from the Anti-FLAG matrix, a result strongly indicative that YeSlc26A2 forms mixed His-/FLAG-tagged oligomers (Fig. 2C). Size exclusion chromatography of the oligomeric His/FLAG proteins showed a single symmetrical peak containing both His- and FLAG-tagged proteins with no protein present at the void volume confirming that stable oligomers were formed rather than aggregates (Fig. 2D). The related distribution coefficient (Kav) corresponded to a mass of ∼180 kDa, suggesting a trimeric or dimeric state (monomer, 54.4 kDa) (Fig. 2D and supplemental Fig. S1).
FIGURE 1.

Phylogenetic relationships of the 27 bacterial SulP/SLC26A proteins used for the initial expression screen. Complete amino acid sequences were aligned with ClustalW and the tree was constructed by the neighbor-joining method using Mega (version 2.1). GenBankTM accession numbers are indicated. The Y. enterocolitica Slc26A2 (YP001005307.1) and the M. tuberculosis we used to model the STAS domain are boxed.
SANS Data Demonstrate YeSlc26A2 Is a Dimer
A critical problem in deriving low resolution structural information from purified membrane proteins is the complex nature of a sample that contains both free detergent micelles and protein surrounded by detergent. Most commonly used techniques are unable to differentiate between the protein and detergent, thus making data collection from the protein alone difficult. SANS, however, can distinguish between the protein and detergent when used in combination with contrast variation: at the correct contrast match point, i.e. hydrogen/deuterium ratio, the scattering signal from the detergent is minimal, making the detergent invisible under favorable conditions (22). First, to determine the contrast match point of Fos-choline-12 experimentally, we recorded scattering curves of Fos-choline-12 solutions without protein at varying H2O/D2O contrast ratios. The scattering curve at 100% D2O is the most representative of the unmatched detergent and indicative of compact, globular micellar structures with a radius of gyration of 17 Å (Fig. 3A). Importantly, the weakest signal was observed at 10% D2O (Fig. 3A), very close to our experimentally determined contrast match-point at 11% D2O (Fig. 3B). The scattering curve is flat without any variations of intensity outside the noise of the signal (Fig. 3A), an important indication that Fos-choline-12 can be matched homogeneously by contrast variation. Second, SANS data were collected for purified YeSlc26A2 in Fos-choline-12 at 0, 11 and 100% D2O (Fig. 3C). Both the 0 and 100% D2O data sets contain contributions from the free micelles because we did not explicitly determine the volume fractions of free detergent, we did not further analyze these data sets but focused instead on the 11% D2O data set where the detergent contributions were matched and therefore invisible. From the scattering data, the molecular weight (calculated by I(0) analysis) and solvent excluded volume (calculated by Porod analysis) of the protein at 11% D2O were calculated to be 103 kDa and 125,000 Å3, corresponding, respectively, to 1.94 and 1.9 times the theoretical values for a monomer (Table 1) demonstrating that YeSlc26A2 is a dimer under the experimental conditions.
FIGURE 3.

Small angle neutron scattering analysis. A, Fos-choline-12 SANS contrast variation series 0% (○), 10% (▿), 50% (□), 90% (◊), and 100% (△) D2O. B, experimental determination of the Fos-choline-12 contrast match point. C, SANS contrast series of the protein-detergent complex (○) 0%, (▿) 11%, and (□) 100% D2O. D, fit of the DAMMIN (line) model (P2, Dmax = 120 Å, expert mode) against the experimental YeSlc26A2 SANS data (open circles). In all panels, Q is the scattering vector, and I represents intensity.
TABLE 1.
Predicted and calculated YeSlc26A2 particle properties
| Monomer (Theoretical) | SANS (11% D2O) | Ratio (monomer:SANS) | P2 DAMMIN model | Ratio (Monomer:DAMMIN) | |
|---|---|---|---|---|---|
| Mw (kDa) | 53.1 | 103, 10–15% error | 1.94 | N.A. | |
| Solvent-excluded volume (Å3) | 66,000 | 125,000, ±25,000 | 1.9 | 140,000 ± 10,000 | 2.1 |
| Radius of gyration (Å) | N.A. | 40.7 ± 4.1 | 38.5 ± 2.6 |
N.A., not applicable.
YeSlc26A2 Model Reveals Multidomain Organization
The program DAMMIN was used to generate low resolution models of YeSlc26A2. For all parameter variations (see “Experimental Procedures”), all models generated showed very similar symmetrical, S-shaped envelopes (Fig. 4A). The presence of this symmetry indicates that such symmetry is genuine. When P2 symmetry was applied during DAMMIN modeling (Fig. 4B), the fit of the model against the experimental data improved (χ2 = 0.367 compared with 0.370 without imposed symmetry) (Fig. 3D). The solvent-excluded volume (140,000 ± 10,000Å3) and radius of gyration (38.5 ± 2.6Å) of the model were consistent with those derived from the scattering data (125,000 ± 25,000Å3 and 40.7 ± 4.1Å, respectively), another indication that the model correctly represents the YeSlc26A2 structure. The solvent excluded volume of the model corresponded to 2.1 times the predicted volume of the monomer (Table 1), again supporting a dimeric stoichiometry. The main bulk of the protein in our SANS envelope, encompassing the dimerization domain, lies mostly within a plane that corresponds to the depth of a membrane bilayer (∼30 Å) with two globular domains extending from this plane (Fig. 4B), thus revealing a multidomain organization.
FIGURE 4.

Ab initio envelopes of YeSlc26A2. A, P1 (no symmetry applied). B, P2 DAMMIN models of YeSlc26A2 using Dmax = 120 Å and Qmax = 0.141 Å−1. The models on the right are generated from the ones on the left by a rotation of 90 degrees around their long axes.
YeSlc26A Forms a Homodimer Stabilized via Its Transmembrane Core
To determine the organization of the transmembrane and C-terminal, soluble STAS domains within the structure, we created a model of the YeSlc26A2 STAS domain. The backbone traces of the high resolution STAS domain structures from E. coli, Mycobacterium tuberculosis, and rat prestin superimpose very closely (8–10), indicative of a common fold despite their limited levels of amino acid sequence identity. The reasonable sequence identity (21%, Fig. 5A) between the STAS domains of YeSlc26A2 and Rv1739c allowed us to model the STAS domain of YeSlc26A2 using SwissProt software (Fig. 5B).
FIGURE 5.

Modeling of the YeSlc26A2 STAS domain. A, amino acid sequence alignment of YeSlc26A2 and M. tuberculosis Rv1739c STAS domain generated using ClustalW. Numbers in parentheses are the amino acid residues encompassing each STAS domain. The residues in red have been proposed to constitute a juxtamembrane binding surface in Rv1739c. The asterisk, semicolon, and period under sequences mark positions of complete sequence conservation, conserved substitutions, and semiconserved substitution, respectively. The arrow marks the start of the model (B) YeSlc26A2 STAS model generated using Swiss-Model (left). No optimizing of threading energy was necessary. The model and the structure of the STAS domain of TbRc1739c (grey) are superimposed (right).
The STAS domains must project away from the membrane into the cytoplasm, thus, we considered two regions as possible STAS domain locations: either the two distal arms or the bulbous dimerization domain in the center of the structure (Fig. 4B). We overexpressed and purified the YeSlc26A2 STAS domain and then analyzed it using analytical size exclusion chromatography (Fig. 6). The YeSlc26A2 STAS domain eluted predominantly in a monodisperse peak corresponding to 13.8 kDa (predicted monomer mass, 14.6 kDa) (Fig. 6). Thus, similar to the STAS domains of the SLC26 proteins of E. coli (8), M. tuberculosis (10), and rat prestin (9), the YeSlc26A2 STAS domain purified as a monomer, showing no propensity to dimerize. These observations suggest that the STAS domains are located within the arms of the envelope rather than comprising the dimerization interface. To biochemically verify our model, in particular the position of the STAS domain within the solvent exposed arms of the envelope, we treated the purified YeSlc26A2 with trypsin and analyzed the peptides released by mass spectrometry (supplemental Fig. S2). The large majority of the peptides identified lie within the STAS domain, with the few other trypsin cleavable sites being within predicted exposed loops (supplemental Fig. S2).
FIGURE 6.

Purification of the YeSlc26A2 STAS domain. A, analytical gel filtration of the purified YeSlc26A2 STAS domain on a Superdex 75 10/30 column. Inset, SDS-PAGE Coomassie Blue-stained gel of Superdex 75 (10 × 30) peak fractions. B, determination of the YeSlc26A2 STAS domain molecular weight. Kav values were calculated from the equation Kav = (Ve − V0)/(Vt − V0) where Ve is the elution volume of each protein, V0 is the column void volume, and Vt is the total bed volume. Mw, molecular mass.
To position the STAS model within the arm of the DAMMIN envelope, we applied the following constraints (Fig. 7B). First, the N-terminal residues must be close to the bulk of the envelope; second, residues corresponding to those proposed to constitute a juxtamembrane binding surface in the rat prestin STAS and Rv1739c STAS structures were accordingly oriented; third, YeSlc26A2 residues corresponding to those identified in GDP/GTP binding in Rv1739c were assumed to be solvent-exposed.
FIGURE 7.

Domain architecture of YeSlc26A2. A, domain organization of YeSlc26A2 showing a transmembrane region of 12 α-helices and a model of the cytoplasmic STAS domain generated from sequence alignment with the M. tuberculosis STAS domain. B, surface representation of STAS domain, the N terminus is highlighted in blue, proposed juxtamembrane residues are highlighted in green, and solvent-exposed residues are highlighted in red. C, left panel, docking of SLC26A6 transmembrane model (based on ClC-ec1) and STAS domain model into the P2 DAMMIN envelope, viewed from the plane of the membrane (top and middle) and above the membrane (bottom). Blue arrows indicate possible movement of the STAS domains to form the more contracted conformation observed in the EM reconstruction of SLC26A5/prestin (right panel-adapted from Mio et al. (5)).
A recent study of mouse SLC26A6 suggested that its closest structural homologue is the E. coli CLC transporter, clc-ec1, and a model of SLC26A6 based upon the clc-ec1 fold has been generated (20). CLC proteins contain a conserved essential glutamate that maps to an essential glutamate residue in the Slc26A6 model (20) also present in YeSlc26A2 (supplemental Fig. S3). CLC proteins are dimeric; thus, we also fitted the proposed SLC26A6 dimer model into the bulky, dimerization domain of our SANS envelope (Fig. 7C).
DISCUSSION
The primary goal of this study was to obtain clear insights into the domain architecture of the important SLC26/SulP family of transporters. However, large, human membrane proteins are challenging to handle for biochemical characterization. Thus, studies on prokaryotic homologues have proven crucial in gaining structural information for their human counterparts. Moreover, due to their fragile nature and the general difficulties in overexpressing and purifying the necessary quantities, structural characterization of integral membrane proteins is notoriously difficult. Contrast-matched, SANS is an ideal technique for studying these as it (i) circumvents the need for well-ordered three-dimensional crystals and (ii) allows the construction of a three-dimensional model of membrane protein alone but stabilized in the protein-detergent complex. Thus, it can be expected that this technique will gain increasing popularity in the future among the community of scientists working on the structural biology of membrane proteins. In this study, we have succeeded in obtaining the first low resolution model of a SLC26A/SulP protein in solution with no detergent contribution giving the first clear insight into their domain architecture.
Oligomeric State of YeSlc26A2
The partial proteolysis, co-purification, and analytical size exclusion chromatography presented in this study, together with the three independent analyses of SANS data, i.e. molecular weight determination by I(0) analysis, solvent-excluded volume by POROD analysis, and DAMMIN modeling, demonstrate that YeSlc26A purifies as a stable dimer. This is also supported by the symmetry observed during DAMMIN modeling; the symmetric features were present without imposing any symmetry options during the annealing process, a good indication that such symmetry is genuine. The oligomeric state, as well as whether a common stoichiometry is conserved among the SLC26/SulP superfamily, remains a subject of debate. Initial studies of gerbil prestin using Native PAGE and yeast two-hybrid systems suggested a tetrameric state (23), a hypothesis subsequently supported by single particle analysis (5). Recently however, Wang et al. (7) used the charge density of prestin in gerbil outer hair cells to conclude that a tetrameric state was possible, but that their data would also be consistent with a dimer. In contradiction to the original hypothesis, Detro-Dassen et al., (6) used copurification, blue native PAGE and chemical cross-linking to show that human SLC26A3, rat, and zebrafish prestin, as well as a SLC26 homologue from Pseudomonas aeruginosa, form dimers with the monomers working in parallel. They conclude that a dimeric subunit is the general prokaryotic and eukaryotic SLC26 isoform. Our results support this latter hypothesis.
YeSlc26A2 Domain Architecture
Our SANS-derived envelope allows us to determine the domain organization of YeSlc26A2. We fitted a model of the soluble, C-terminal STAS domain and a model of the mouse SLC26A6 protein, generated from the ClC-ec1 fold, into our ab initio envelope. As the YeSlc26A2 STAS domain, similar to those of the SLC26 proteins of E. coli (8), M. tuberculosis (10), and rat prestin (9), purified as a monomer, we attempted to fit it into the distal arms of the DAMMIN model rather than the central dimerization domain.
Given the limited information available, only proposed juxtamembrane and substrate binding residues in the M. tuberculosis and rat prestin STAS structures, the fit of the STAS model into its proposed position is excellent (Fig. 7C). This location is also in agreement with a FRET study (24) that indicated that the N terminus rather than the C terminus of prestin is important for oligomerization.
Further proteolysis/mass spectrometry analysis indicates that the STAS domain is not protected by detergent micelles, but exposed to the solvent and hence susceptible to trypsin proteolysis, whereas the transmembrane domain appears protected by the micelles. Locating the STAS domains in the distal arms of the envelope leaves the bulk of the structure, which corresponds to the depth of a membrane bilayer, to contain the transmembrane region. Into this region, we fitted the recent CLC-derived, dimeric mouse SLC26A6 model. Overall, this model appears to fit the proposed transmembrane region of the YeSlc26A2 envelope well: the shape is similar, the dimer interfaces superimpose well, and the translocation pore is within the boundary of the YeSlc26A2 envelope. Most helices are entirely contained within the envelope, and those that are not are clustered tightly along the periphery of the envelope, and importantly, none overlap with the STAS domain model (Fig. 7C). These data cannot tell us about the relationship between the SLC26 and CLC proteins, and we do not imply here that YeSlc26A2 belongs to the CLC family; however, this modeling does demonstrate that the proposed transmembrane region of our SANS-derived envelope is similar in size to a dimeric helix bundle membrane protein with 12 transmembrane helices.
Functional Implications for SLC26A/SulP Family
The Y. enterocolitica Slc26A2 protein shows a homodimer stabilized via its transmembrane core. The cytoplasmic STAS domain projects away from the transmembrane domain and is not involved in dimerization. This domain organization has functional implications for the SLC26A/SulP protein family and provides a structural model for the conformational changes associated with the transport cycle in SLC26/SulP proteins.
Although there may have been an inverse relationship between motor and transport functions during the evolution of prestin (12), the electromotile function of prestin evolved from the ability of these proteins to undergo dramatic conformational changes (11, 13). A three-dimensional reconstruction from EM data showed a compact bullet-shaped molecule for rat prestin (5), which is clearly very different from what we observed in the YeSlc26A2 model. However, changes in membrane potential were observed by FRET to induce significant movement of the C-terminal tail of prestin (25). This is reminiscent of cyclic nucleotide-modulated (26) and CLC channels (27), where conformational rearrangements of intracellular domains is coupled to gating of the channels. Comparing the two structures (prestin versus YeSlc26A2) may offer structural insight into the conformational changes occurring during the transport cycle of the SLC26A/SulP family, varying in length in the plane of the membrane between “contracted” (Prestin) and “expanded” (YeSlc26A2) conformations via a large rotational movement of the two STAS domains (Fig. 7C). Such large conformational changes may explain how prestin transduces a change in membrane potential into the considerable mechanical force, leading to a length change of outer hair cells. Contrast-matched SANS measurements on purified prestin (5), in the presence or absence of Cl−/HCO3−, is an ideal technique to answer these essential questions.
In conclusion, we have demonstrated that YeSlc26A2 in solution is a dimer stabilized via its transmembrane domain, adding support to the hypothesis that a dimeric stoichiometry is a common feature within the family. The cytoplasmic STAS domain projects away from the transmembrane domain and is not involved in dimerization. Our model, combined with other biochemical information, strongly implicates that large movements of the STAS domain underlie the conformational changes that occur during transport.
Supplementary Material
Acknowledgments
We thank Professors Daan van Aalten and Mike Merrick, Dr. Joseph Mindell, Professor Tracy Palmer, Professor Frank Sargent, and Professor Fritz Winkler for constructive criticism of the manuscript; Dr. XiaoDan Li and P. Callow for technical help. We thank Institute Laue-Langevin for beam time on D22.
This work was supported by grants from Tenovus Scotland (T08/26), the Royal Society (2008/R2), and the Medical Research Council (G1000054).

The on-line version of this article (available at http://www.jbc.org) contains supplemental Figs. S1–S3.
- SulP
- sulfate permease
- SANS
- small angle neutron scattering
- STAS
- sulfate transporter and anti-sigma antagonist
- IMAC
- immobilized metal affinity chromatography
- SEC
- size exclusion chromatography
- TEV
- tobacco etch virus
- CLC
- chloride channel.
REFERENCES
- 1. Saier M. H., Jr., Eng B. H., Fard S., Garg J., Haggerty D. A., Hutchinson W. J., Jack D. L., Lai E. C., Liu H. J., Nusinew D. P., Omar A. M., Pao S. S., Paulsen I. T., Quan J. A., Sliwinski M., Tseng T. T., Wachi S., Young G. B. (1999) Biochim. Biophys. Acta 1422, 1–56 [DOI] [PubMed] [Google Scholar]
- 2. Dorwart M. R., Shcheynikov N., Yang D., Muallem S. (2008) Physiology 23, 104–114 [DOI] [PubMed] [Google Scholar]
- 3. Mount D. B., Romero M. F. (2004) Pflugers Arch. 447, 710–721 [DOI] [PubMed] [Google Scholar]
- 4. Shelden M. C., Howitt S. M., Price G. D. (2010) Mol. Membr. Biol. 27, 12–23 [DOI] [PubMed] [Google Scholar]
- 5. Mio K., Kubo Y., Ogura T., Yamamoto T., Arisaka F., Sato C. (2008) J. Biol. Chem. 283, 1137–1145 [DOI] [PubMed] [Google Scholar]
- 6. Detro-Dassen S., Schänzler M., Lauks H., Martin I., zu Berstenhorst S. M., Nothmann D., Torres-Salazar D., Hidalgo P., Schmalzing G., Fahlke C. (2008) J. Biol. Chem. 283, 4177–4188 [DOI] [PubMed] [Google Scholar]
- 7. Wang X., Yang S., Jia S., He D. Z. (2010) Brain Res. 1333, 28–35 [DOI] [PMC free article] [PubMed] [Google Scholar]
- 8. Babu M., Greenblatt J. F., Emili A., Strynadka N. C., Reithmeier R. A., Moraes T. F. (2010) Structure 18, 1450–1462 [DOI] [PubMed] [Google Scholar]
- 9. Pasqualetto E., Aiello R., Gesiot L., Bonetto G., Bellanda M., Battistutta R. (2010) J. Mol. Biol. 400, 448–462 [DOI] [PubMed] [Google Scholar]
- 10. Sharma A. K., Ye L., Baer C. E., Shanmugasundaram K., Alber T., Alper S. L., Rigby A. C. (2011) J. Biol. Chem. 286, 8534–8544 [DOI] [PMC free article] [PubMed] [Google Scholar]
- 11. Schaechinger T. J., Oliver D. (2007) Proc. Natl. Acad. Sci. U.S.A. 104, 7693–7698 [DOI] [PMC free article] [PubMed] [Google Scholar]
- 12. Tan X., Pecka J. L., Tang J., Okoruwa O. E., Zhang Q., Beisel K. W., He D. Z. (2011) J. Neurophysiol. 105, 36–44 [DOI] [PMC free article] [PubMed] [Google Scholar]
- 13. Stewart C. E., Hudspeth A. J. (2000) Proc. Natl. Acad. Sci. U.S.A. 97, 454–459 [DOI] [PMC free article] [PubMed] [Google Scholar]
- 14. Drew D. E., von Heijne G., Nordlund P., de Gier J. W. (2001) FEBS Lett. 507, 220–224 [DOI] [PubMed] [Google Scholar]
- 15. Lin Y., Kimpler L. A., Naismith T. V., Lauer J. M., Hanson P. I. (2005) J. Biol. Chem. 280, 12799–12809 [DOI] [PubMed] [Google Scholar]
- 16. Guzman L. M., Belin D., Carson M. J., Beckwith J. (1995) J. Bacteriol. 177, 4121–4130 [DOI] [PMC free article] [PubMed] [Google Scholar]
- 17. Jacrot B., Zaccai G. (1981) Biopolymers 20, 2413–2426 [Google Scholar]
- 18. Jacrot B. (1976) Rep. Prog. Phys. 39, 911–953 [Google Scholar]
- 19. Svergun D. I. (1999) Biophys. J. 76, 2879–2886 [DOI] [PMC free article] [PubMed] [Google Scholar]
- 20. Ohana E., Shcheynikov N., Yang D., So I., Muallem S. (2011) J. Gen. Physiol. 137, 239–251 [DOI] [PMC free article] [PubMed] [Google Scholar]
- 21. Gouaux E., Mackinnon R. (2005) Science 310, 1461–1465 [DOI] [PubMed] [Google Scholar]
- 22. Heller W. T. (2010) Acta Crystallogr. D. Biol. Crystallogr. 66, 1213–1217 [DOI] [PubMed] [Google Scholar]
- 23. Zheng J., Du G. G., Anderson C. T., Keller J. P., Orem A., Dallos P., Cheatham M. (2006) J. Biol. Chem. 281, 19916–19924 [DOI] [PubMed] [Google Scholar]
- 24. Navaratnam D., Bai J. P., Samaranayake H., Santos-Sacchi J. (2005) Biophys. J. 89, 3345–3352 [DOI] [PMC free article] [PubMed] [Google Scholar]
- 25. Gleitsman K. R., Tateyama M., Kubo Y. (2009) Am. J. Physiol. Cell Physiol. 297, C290–298 [DOI] [PubMed] [Google Scholar]
- 26. Zagotta W. N., Olivier N. B., Black K. D., Young E. C., Olson R., Gouaux E. (2003) Nature 425, 200–205 [DOI] [PubMed] [Google Scholar]
- 27. Bykova E. A., Zhang X. D., Chen T. Y., Zheng J. (2006) Nat. Struct. Mol. Biol. 13, 1115–1119 [DOI] [PubMed] [Google Scholar]
Associated Data
This section collects any data citations, data availability statements, or supplementary materials included in this article.