Abstract
Purpose: The increasing need for better image quality and high spatial resolution for successful endovascular image-guided interventions (EIGIs) and the inherent limitations of the state-of-the-art detectors provide motivation to develop a detector system tailored to the specific, demanding requirements of neurointerventional applications.Method: A microangiographic fluoroscope (MAF) was developed to serve as a high-resolution, region-of-interest (ROI) x-ray imaging detector in conjunction with large lower-resolution full field-of-view (FOV) state-of-the-art x-ray detectors. The newly developed MAF is an indirect x-ray imaging detector capable of providing real-time images (30 frames per second) with high-resolution, high sensitivity, no lag and low instrumentation noise. It consists of a CCD camera coupled to a Gen 2 dual-stage microchannel plate light image intensifier (LII) through a fiber-optic taper. A 300 μm thick CsI(Tl) phosphor serving as the front end is coupled to the LII. The LII is the key component of the MAF and the large variable gain provided by it enables the MAF to operate as a quantum-noise-limited detector for both fluoroscopy and angiography.Results: The linear cascade model was used to predict the theoretical performance of the MAF, and the theoretical prediction showed close agreement with experimental findings. Linear system metrics such as MTF and DQE were used to gauge the detector performance up to 10 cycles∕mm. The measured zero frequency DQE(0) was 0.55 for an RQA5 spectrum. A total of 21 stages were identified for the whole imaging chain and each stage was characterized individually.Conclusions: The linear cascade model analysis provides insight into the imaging chain and may be useful for further development of the MAF detector. The preclinical testing of the prototype detector in animal procedures is showing encouraging results and points to the potential for significant impact on EIGIs when used in conjunction with a state-of-art flat panel detector (FPD).
Keywords: MAF, fluoroscopy, angiography, CCD detector, MTF, DQE, linear cascade model
INTRODUCTION
The use of endovascular image-guided interventions (EIGIs) (Ref. 1) for the treatment of stroke2, 3 is replacing invasive surgical procedures and offering reduced mortality, morbidity, and discomfort.4 For EIGIs, a catheter is inserted into an artery and is then threaded under fluoroscopic guidance through the vasculature to the site of the pathology to be treated.1 The pathology may be a portion of a vessel that is stenosed or that is weakened and bulges out to form an aneurysm.
The success and the accuracy of the EIGI procedures depend on the quality of the real-time images used for the visualization of the complex vasculature. Interventional devices are becoming more complicated5 and require very accurate image guidance. The success of the treatment depends on the accurate placement of the device and the accuracy largely depends on clear visualization of the pathological region as the device is being deployed. The quality of the images for clear visualization in turn depends on the imaging detector.
Because of its real-time capabilities and high spatial resolution, x-ray fluorographic imaging is mainly used for EIGI procedures.1 X-ray angiography is used to provide high-quality, low-noise diagnostic images of the pathology primarily for diagnosis or at key decision points in an EIGI. A radio-opaque contrast medium may be injected into the vessel, making the vessel with pathologies such as stenoses or aneurysms become clearly visible. X-ray fluoroscopy, on the other hand, is a lower-dose-rate imaging modality that provides real-time interactive images for catheter and device guidance.
As EIGI procedures become more widespread and more complex, the imaging performance of the state-of-the-art x-ray detectors becomes increasingly important. Presently, the x-ray image intensifier (XII) and flat panel detector (FPD) are the detectors currently widely used. Both XII and FPD6, 7, 8, 9 have inherent problems6, 7, 10, 11, 12, 13 that often limit their imaging performance. XIIs suffer from limitations because of electrostatic focusing, a curved input phosphor surface, and light and electron optics. These limitations can result in image distortion such as pincushion distortion, which is due to the minification difference between the center and the periphery resulting from the curved surface of input phosphor and photocathode, and s-shaped distortion, which results from the effect of external magnetic fields on the electron trajectories. Another problem associated with XIIs is vignetting that occurs because of unequal collection of light photons at the center and the periphery. Finally, veiling glare that originates primarily because of light scattering can reduce contrast and severely affect image quality.6, 7
FPDs provide reasonable solutions for some of the XIIs problems. FPDs do not have distortion or veiling glare as they do not have electrostatic focusing.6, 10 Since being introduced for clinical use, FPDs have been rapidly replacing XIIs; however, FPDs do have inherent problems that limit their performance. Indirect FPDs suffer from lag, ghosting, and excessive additive instrumentation noise. The inherent lag for modern FPD systems has been able to be corrected by and large in firmware and since some temporal integration during fluoroscopy is helpful; these systems tend to augment the lag using recursive temporal filtering.14 The excessive additive instrumentation noise hampers their capability for low-dose-rate fluoroscopy.11, 12, 15 The spatial resolution for both II systems and FPD is limited to about 3 lp∕mm.9 Direct FPDs have potentially very good spatial resolution and could be a potential candidate for dynamic imaging,16, 17 but, currently, they are not in wide spread clinical implementation in fluoroscopy. X-ray detectors based on CMOS sensors are attracting a lot of interest and with advancing technology; these detectors could be a future prospect. At the present time, various CMOS-based x-ray detectors are being studied.18, 19, 20, 21, 22, 23, 24 These detectors do not have real-time imaging capability, and very high exposures are needed for their quantum-noise limited operation.
Our group has been working on solutions to the limitations of the currently used detectors. In the past, we have developed the concept of region-of-interest (ROI) imaging,25, 26, 27 wherein advantage is taken of the fact that in many instances high-resolution images are needed in only a part of the full field-of-view (FOV). The larger FOV detectors can be used in tasks that do not require high-resolution images and where the full FOV is needed. Smaller FOV ROI detectors, which give better image quality and resolution than the full FOV detectors, can be used when the higher quality is needed, for example, during critical parts of an interventional procedure. Development of high-resolution ROI detectors has proceeded with incremental improvements over the years to the point that our current ROI detector, the microangiographic fluoroscope (MAF), has begun to be clinically evaluated in neurovascular interventions.28
The MAF was designed to serve as a region-of-interest high-resolution detector15 with large variable gain. This variable gain feature facilitates both angiography and fluoroscopy.15, 29 Imaging experiments on rabbits and phantoms have shown that the MAF performs quite well as per expectations.30, 31
In this paper, we carried out a detailed and comprehensive investigation of all components of the MAF, evaluated their performance individually, and used linear cascade analysis to calculate the MAF’s theoretical performance. The theoretical modulation transfer function (MTF) and detective quantum efficiency (DQE) were determined, and a comparison was made between these and the total system curves experimentally measured.
DETECTOR DESCRIPTION
As shown in Fig. 1, the MAF is a CCD-based detector in which the CCD camera is coupled to a light image intensifier (LII) through a fiber-optic taper (FOT). A CsI(Tl) scintillator is attached to the front end of the LII with fiber-optic coupling. A key component in the design of the MAF is the LII which provides very high gain that enables the MAF to image even at very low exposure rates. The following sections describe all the components used in the detectors.
Figure 1.
MAF Schematic. LII—light image intensifier; FOP—fiber-optic plate.
Scintillator
The basic criteria for the scintillator selection depend on the effective absorption of x-rays, inherent blurring within the scintillator, and the wavelengths of the output light spectrum. The scintillator used for the MAF was a 300 μm thick high-light (HL)® CsI(Tl) scintillator grown on a 3 mm thick fiber-optic plate (FOP) with fiber diameter of 6 μm (Hamamatsu Corp. Bridgewater, NJ). CsI(Tl) has a density of 4.51 g∕cm2 (packing density ∼75%)32 and provides good absorption efficiency for diagnostic x-rays. Its output-light spectrum is in the visible range with peak intensity at 565 nm. The CsI(Tl) grown on the FOP provides better resolution than an unstructured or powder phosphor and is easier to couple.9, 32 The choice of the thickness of the scintillator must be considered carefully because the inherent spatial resolution of the scintillator is dependent on its thickness,9 and there is a compromise between spatial resolution and x-ray absorption to be made. The HL phosphor employs a reflective layer on its front surface to enhance the light output. We initially chose a HL CsI thickness of 300 μm for the MAF prototype and were able to demonstrate proper functionality of the system.31
Light image intensifier
A 40 mm diameter, generation 2 dual-stage microchannel plate light image intensifier (LII) was selected (Model PP0410K, Delft Electronic Products B.V., Roden, The Netherlands).33 It provides very large variable gain34 that enables the MAF to be used for both fluoroscopy and angiography. This LII has an input and output fiber-optic plates (FOPs) or window that provides efficient light coupling for both ends. The LII input FOP is coupled to the output FOP of the CsI phosphor module. A voltage is applied across the microchannel plates to accelerated electrons that travel through the microchannels and strike the inner surface resulting in electron multiplication. At the output end of the LII, these amplified electrons fall on the output phosphor to produce light photons. Very high gains sufficient to enable single photon counting35, 36 with minimal loss of spatial resolution can be achieved with modern LIIs.
The generation 2 LIIs we used have an alkali halide super S-20 photocathode with a quantum efficiency of 11% for the CsI(Tl) light output spectra. The applied potential between the two MCP stages can be varied from 700 to 1800 V. The corresponding gain varies from 1 to 106 output photons per input photon according to the manufacturer’s specifications. This wide dynamic range of gain is the key feature of the MAF that enables it to operate at high and low exposure-rates. The LII P-43 output phosphor with a spectrum peaking at 540 nm is well matched to the CCD sensitivity.
Fiber-optic taper
The next component in the assembly is a fiber-optic taper (FOT). The taper couples the LII to the camera CCD and minifies the image of the field-of-view to the size of the CCD chip. The use of a fiber-optic taper provides increased field-of-view with substantially more light coupling efficiency than possible with optical lenses. In the present version of the MAF, the taper with a 2.88:1 ratio gives an effective field-of-view of 3.6 cm diameter and an effective pixel size of 35 μm. More details regarding the custom-made37 FOT (Incom Inc., Charlton, MA) are given in Table TABLE I..
TABLE I.
Fiber-optic taper properties.
| Face plate material | Material Code BLS59-12 |
| Length | 50 mm |
| Diameter | 51 mm larger end, 17.8 mm smaller end |
| Core∕clad ratio | 16:1 |
| Numerical aperture | 1 |
| Refractive index | 1.80 Core, 1.49 Clad |
| Transmission (Lambertian source) | 60% at 550 nm |
CCD camera
A key component of the x-ray detector is the CCD camera that converts light photons into electrical charge and subsequently a digital image. The choice of the CCD camera was based on the pixel size, array size, data format, frame rate, dynamic range, and good response to the output spectra of the P-43 output phosphor of the LII. The 1M30 Pantera (Dalsa Corp., Waterloo, Ontario, Canada) area scan CCD camera containing a frame transfer CCD (Ref. 38) has 12 μm square pixels in a 1024 by 1024 array with 100% fill factor and provides 12 bit images at up to 30 frames per second. The choice of the 12 μm pixel with a 2.88:1 fiber-optic taper for a 1024 by 1024 array gives a square field-of-view of 3.6 cm that fits well with the 4 cm diameter of the LII. The camera also has discrete gain modes of 1 × , 2 × , or 4 × and a responsivity of 40 DN∕(nJ∕cm2) for 540 nm light in the 1 × gain mode. For all the experiments and calculation for this paper, the CCD camera was operated in 1 × gain mode.
The glass window which normally comes on the CCD sensor of the Pantera 1M30 camera was removed and a new FOP was fastened directly onto the CCD sensor.
Schematic and operation
Figure 1 shows a schematic of the MAF assembly. At the front end is the CsI phosphor module that is coupled with the LII via a fiber-optic window. The LII output is coupled to the camera through the fiber-optic taper. A silica-based gel (Fused Silica Matching liquid, Code 06350, Cargille Lab. Inc., Cedar Grove, NJ) was used for the coupling between two fiber-optic surfaces.
For the smooth operation of the MAF, a Control, Acquisition, Processing and Image Display System (CAPIDS) (Refs. 39, 40) program was developed by our group for real-time acquisition (30 frames per second), display and image processing. CAPIDS is a labview based graphical user interface (GUI) that controls the entire MAF system. It initializes and controls the camera and synchronizes it with the x-ray trigger pulses. It also controls the LII gain and displays images with some basic necessary image processing such as flat field and zero correction, as well as some optional more-complex processing such as temporal filtering.
THEORETICAL PERFORMANCE EVALUATION
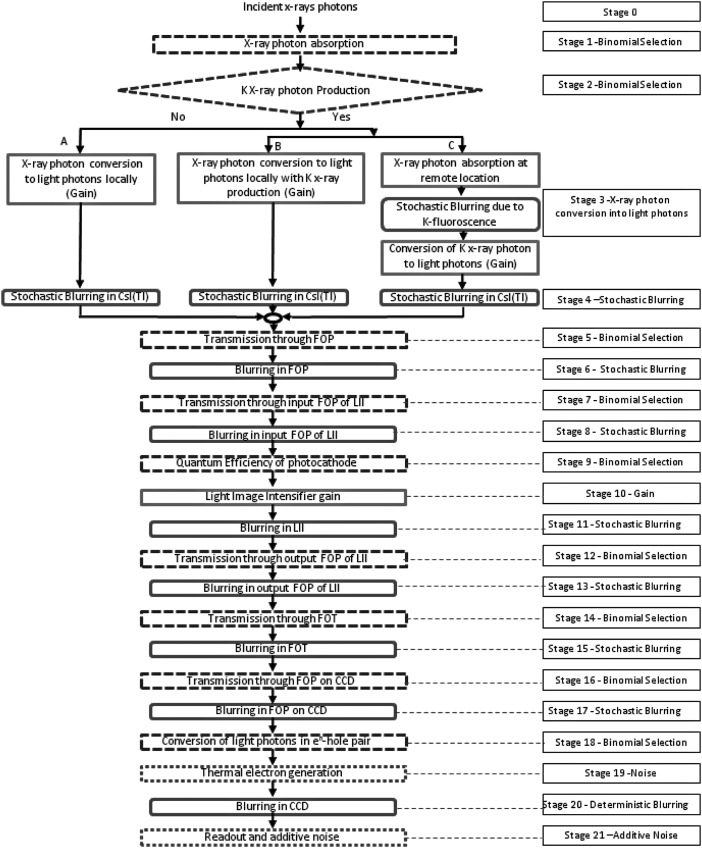
The theoretical performance evaluation of the MAF was carried out using a linear cascade model.41, 42, 43, 44, 45 The detector was considered to be a sequence of various stages and each stage was identified as one of the following basic phenomena:46, 47 amplification, binomial selection, deterministic blur, and stochastic or quantum blur. The gain and the blurring for each stage was estimated theoretically or measured. The linear parallel cascade model45,48, 49, 50 was applied and theoretical estimations of modulation transfer function (MTF) and detective quantum efficiency (DQE) were made.
Any linear system can be considered as the cascade of stages, where the output of the nth stage serves as the input of the (n + 1)th stage. In the past, others41, 42, 45, 51, 52, 53 have used these basic processes to predict the detector performance of similar detectors. Cunningham et al.41 suggested a Fourier-based approach that deals with the stages associated with the basic processes in the frequency domain and predicts the MTF and DQE. Recently, a more sophisticated model was proposed that handles parallel branches of the stages.54 Simple mathematical relations between input and output quanta were established for the different basic processes.41, 42, 43
Based on the characteristics of different stages in our detector, we were able to identify the elementary processes for each of the individual stages. Some of the initial stages up to the CsI output are followed in a similar way to what others45,48, 49, 50 have done. The schematic of the cascade model for the MAF is shown in Fig. 2. A total of 21 stages are shown from the x-ray absorption to the image formation. For the theoretical performance evaluation, the signal and the noise for each stage are formulated. For the nth stage, qn(u) and NPSn(u) represent signal and noise power spectrum, respectively, where u is the spatial frequency. The signal for zero spatial frequency is denoted by qn(0).
Figure 2.
Schematic of stages for cascade model for MAF.
The detailed expressions for signal and noise are discussed in the Appendix. The total system frequency dependent MTF and DQE were calculated using the signal and the noise expression at the final stages:
| (1) |
| (2) |
Here, κi are transmission efficiencies, Ti(u) are MTFs for the ith stages, and
g10 = LII gain
σR2 = Readout Noise
σt2 = Thermal Noise.
The detector MTF can be obtained by the normalized signal of the final stage.
| (3) |
and DQEDetector(u) can be calculated using the following formula,
| (4) |
METHODS
Evaluation of various parameters
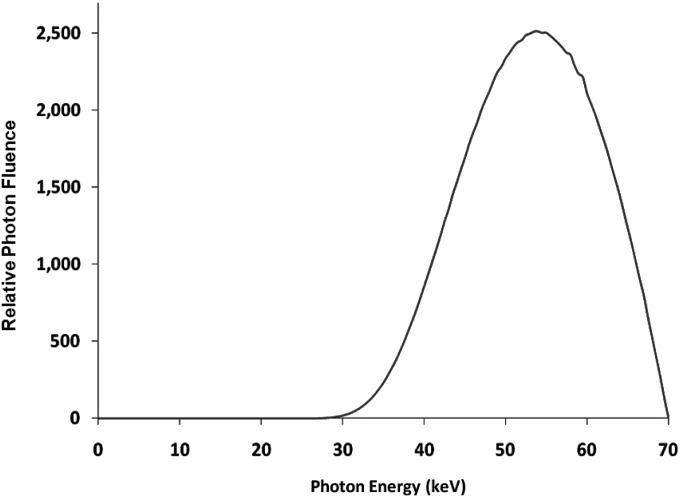
We used the RQA 5 spectrum with a first half value layer of nearly 7.1 mm of Al for the analysis of the system. A plot of the spectrum used is shown in Fig. 3 (Generated by SRS-78, developed at Institute of Physics and Engineering in Medicine, York, UK). Using the same spectrum that was used for the calculation of the x-ray fluence and average x-ray photon energy, the quantum detection efficiency η of the CsI was calculated with Eq. A3 (Appendix—absorption efficiency).
Figure 3.
RQA5 X-ray Spectrum used for the experiments.
For the parallel branching parameters of the linear cascade model, the fluorescence yield of the K-alpha photoelectric interaction ξ, the probability of K shell interaction ω in the CsI, the probability of K-edge re-absorption fk and the probability of K-photon ejection Ik was used from the works by Others55, 56, 57 and from NIST data sheets.58 The values of these parameters are listed in the Table TABLE II..
TABLE II.
Parameters used for linear cascade model calculations relating to the CsI scintillator (Refs. 55, 56, 57, 58).
| CsI K-edge | 33 keV |
| CsI density | 4.51 g∕cm3 |
| Packing fraction | 0.75 |
| Average energy of spectrum | 54 keV |
| K- fluorescence yield (ω) | 0.85 |
| K-shell contribution to photoelectric effect (ξ) | 0.83 |
| K-edge re-absorption probability (fk) | 0.60 |
| K-photon ejection probability (Ik) | 0.82 |
The mean gain for branches A, B and C was calculated with the values of average energy and the K-edge energy of the CsI using Eqs. A14 to A16. The values for ga, gb, and gc were 3000, 1167, and 1833, respectively (see the Appendix).
The transmission efficiency of the fiber-optic taper depends on the magnification ratio and other material properties whose values were supplied by the manufacturer. Equation 5 given by Hejazi and Trauemicht59 was used to calculate the transmission efficiency of a fiber-optic taper for a Lambertian source:
| (5) |
where m is the magnification ratio, which was 2.88 for the FOT we used. n1, n2, n3 are the refractive indices of the source medium, the fiber core and the fiber cladding, respectively. Tf and Fc are the transmission efficiency and the fill factor of the fiber core, respectively. LR is the loss at the surface due to Fresnel reflection.60 For the calculation of the transmission efficiencies of the FOT, we took our coupling gel as the source medium. The values for different parameters for the FOT transmission efficiency calculation are shown in Table TABLE III..
TABLE III.
| Refractive index—source medium n1 | 1.46 |
| Refractive index—fiber core n2 | 1.80 |
| Refractive index—fiber cladding n3 | 1.49 |
| Loss due to Fresnel reflection (LR) | 0 |
| Fiber fill factor (FC) | 0.75 |
| Transmission efficiency (TR) | 0.63 |
| FOT transmission efficiency | 0.025 |
| FOP on CCD transmission efficiency | 0.60 |
| CsI base FOP transmission efficiency | 0.60 |
| LII input FOP transmission efficiency | 0.60 |
| LII output FOP transmission efficiency | 0.60 |
The transmission efficiency of the FOPs) for the CsI base, LII input, LII output window, and CCD input FOP were provided by the manufacturer’s data sheets,32, 33 The light distribution coming out of the FOT is no longer Lambertian; hence, Eq. 5 was not used for the transmission efficiency calculations for the CCD FOP. The values for the transmission efficiencies of the FOPs are given in Table TABLE III..37
The LII gain in terms of photons per photon and photons per electron was supplied by the manufacturer. The LII gain was assumed to be Poisson distributed for the linear cascade model calculations. The quantum efficiency of the photocathode was taken from the quantum efficiency vs photon energy graph. The quantum efficiency of the photocathode was given as 11% for the 565 nm light photons.
The quantum efficiency of the CCD for electron-hole production was approximately 23% for the output spectrum of the LII output phosphor. The thermal noise and the read noise were taken to be 32 electrons (rms) as suggested in the data sheets for the CCD sensor.38
Calculation of various MTFs
For the total system theoretical performance calculations, we first determined the MTF for each stage. For some of the stages or components, MTFs were measured experimentally, while, for others, they were theoretically estimated or obtained from MTF data provided by the manufacturer. The method and the sources of the different MTFs are described in the following.
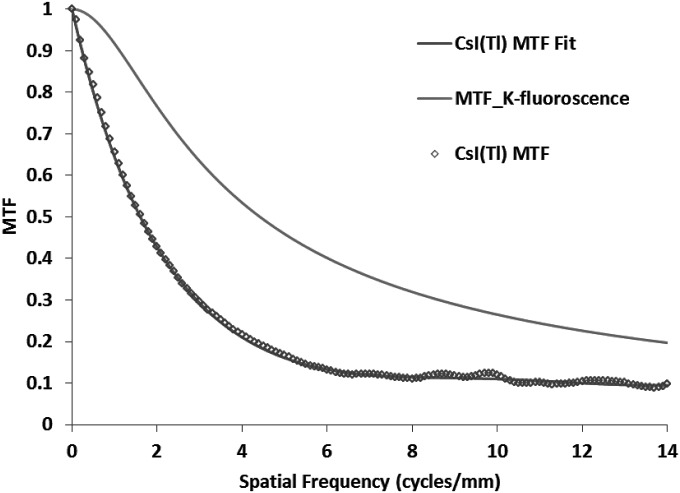
The MTF associated with CsI, T4(u), is one of the most crucial parameters because the CsI thickness affects the tradeoff between x-ray quantum efficiency determined by x-ray absorption efficiency and the MTF at high frequencies or the spatial resolution.61 For the linear cascade model, we measured the MTF for the 300 μm thick CsI module including its FOP window that was used in the MAF. We coupled the CsI to the CCD camera directly and used the standard edge method62 for the measurement. A soft spectrum with 50 kVp was taken for the MTF measurements to avoid the contribution from the K-edge blurring. The MTF measurement agrees with the published results from other groups56, 61 who measured the 300 μm thick HL CsI supplied by Hamamatsu Corp. Bridgewater, NJ.
For the estimation of the MTF due to K-edge fluorescent x-ray re-absorption, we used the theoretical model given by Que et al.52 This model calculates the spread of the K-fluorescent x-ray photons in space when it is absorbed at a remote location. The MTF for the K-fluorescence re-absorption was calculated using the photoelectric and total attenuation coefficient data for CsI and the average energy of the K-fluorescent x-rays of the CsI. The K-fluorescence MTF is used for branch “C” (as shown in Fig. 2) when the K-fluorescence photon is reabsorbed remotely and the light photons are produced. The combined MTF for the CsI (light photon spreading and K-fluorescence) was calculated and was in very good agreement with the CsI MTF measured at 70 kVp.
The MTFs for the CsI base FOP and the input and output fiber windows of the LII were estimated as the sinc function of the fiber diameter.59 The CCD MTF was taken as the sinc function of the pixel size of the CCD. The MTFs of the FOT and the CCD-FOP combination were measured using the slanted edge method. For these measurements, we used a uniform LED source (Model KB2885SGD, Kingbright Corp., Taiwan) with output near the peak output of P-43 and an optically opaque knife edge. For the CCD-FOP MTF, the edge was placed directly on the CCD-FOP. The combined MTF was calculated and divided by the MTF for the 12 μm CCD pixel to get the MTF for the CCD-FOP only. For the FOT MTF, we coupled the FOT to the CCD camera and placed the edge on the taper. In this case, we divided the measured MTF by the CCD-FOP MTF and CCD MTF (35 μm effective pixel size with taper) to get the FOT MTF referenced to the input side. We were also able to verify the transmission efficiency of the fiber-optic taper with this setup.
The LII MTF was provided by the manufacturer, and the same data were used for the model.33
RESULTS
Results from the linear cascade model
The quantum detection efficiency was calculated using Eq. A3. Attenuation data for the CsI were taken from the NIST websites.58 The calculated average value of quantum detection efficiency η was 0.62 for a 300 μm thick CsI phosphor and the RQA5 spectrum.
The effect of K-edge re-absorption on the spreading of light quanta was calculated by using the method described by Que et al.52 Figure 4 shows the MTF due to K-edge re-absorption. For the blurring of light in CsI, we measured the MTF with the slanted edge method using the spectrum described above. The measured MTF was fitted with an analytic function (sixth order polynomial), which was used for the theoretical calculations using the linear cascade model. The measured MTF and the analytic function fit are shown in Fig. 4.
Figure 4.
Measured modulation transfer function for a 300 μm thick CsI(Tl) phosphor and calculated K-fluorescence re-absorption. Analytical fit for the CsI MTF is also shown in the figure.
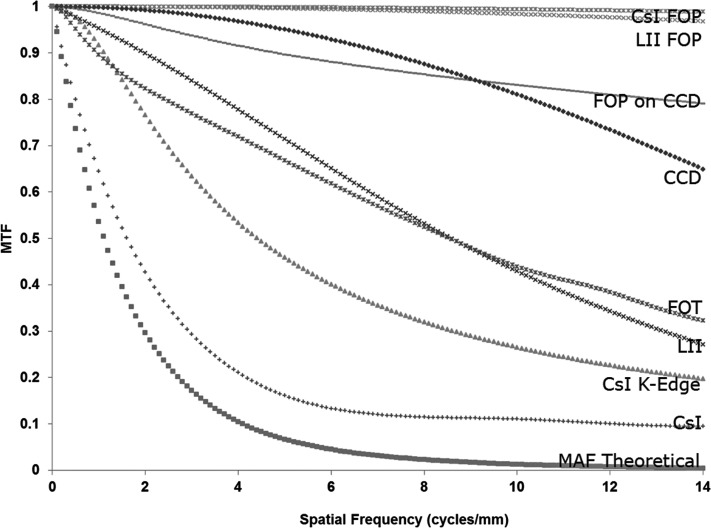
The measured MTF for the CCD FOP and FOT are shown in Fig. 5 along with the CCD MTF. The MTF for other FOP’s was estimated as the sinc function of their fiber diameter (6 μm for CsI FOP and 10 μm for LII input-output FOP window). The measured MTF for the CCD FOP is seen to be smaller than the sinc function of the fiber diameter, possibly due to additional blur in the coupling between the FOP and CCD. The MTF for the LII, as provided by the manufacturer, is also shown in Fig. 5 and includes the MTF for the input and output FOP. To obtain the LII MTF only (not shown in Fig. 5), the combined LII∕FOP MTF was divided by the input and output FOP MTF’s.
Figure 5.
Theoretically estimated modulation transfer function of the MAF and the modulation transfer functions for its various components including the FOPs, FOT, and CCD. MTFs for the FOT and FOP on the CCD were measured, while all others are supplied by the manufacturer. The CsI K-edge MTF is the K-fluorescence MTF (Used for the blurring in branch “C”).
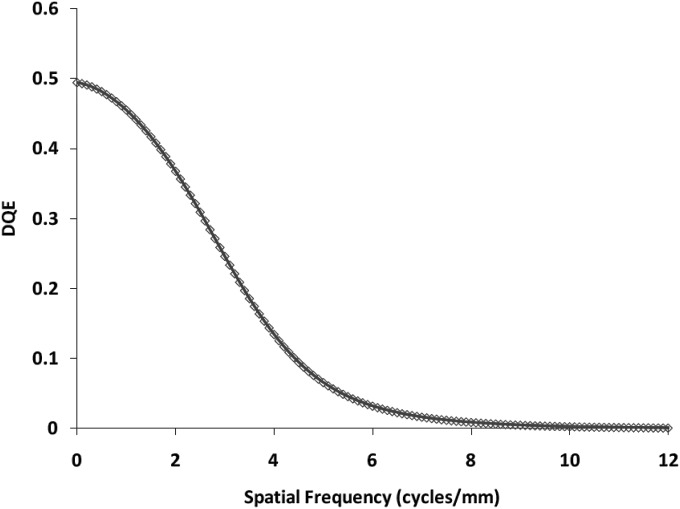
We have discussed how we obtained all the parameters and values that would be used for the linear cascade model in Sec. 4. We followed the equations given in Sec. 3 and calculated the theoretical MTF and the DQE for the detector. The theoretical MTF is shown with all component MTFs in Fig. 5. The theoretically estimated DQE for the MAF is shown in Fig. 6. For the calculations in the linear cascade model, the exposure used was 162 μR and the LII gain was 700 photons∕electron (as given in the LII specification sheet) since we used similar values of exposure and gain for our experimental data.
Figure 6.
Theoretically estimated DQE of MAF for 162 μR detector exposure with LII gain of 700 photons∕electrons.
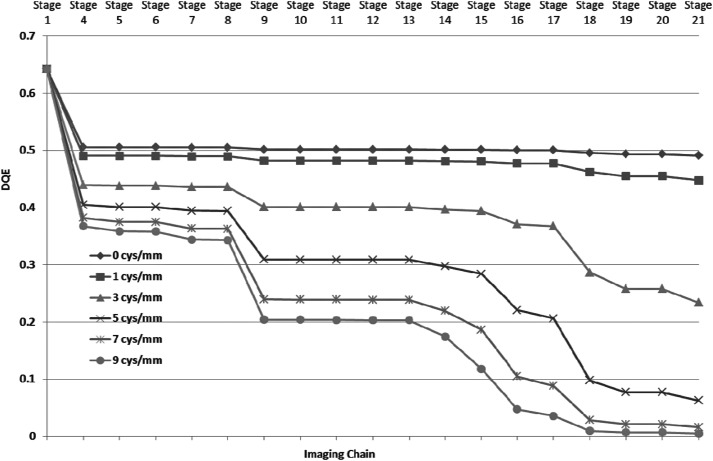
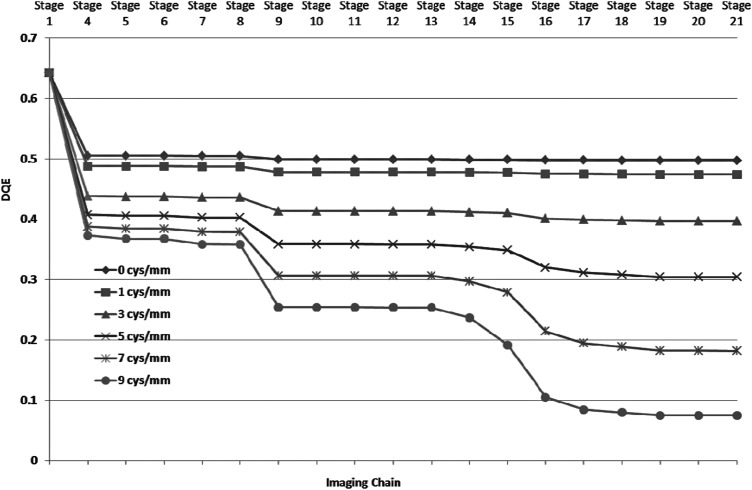
For the linear cascade model of the MAF, signal, and NPS were calculated for each individual stage. We calculated DQE for the each individual stage to observe the effect of different stages on the DQE. We plotted DQE values for six different spatial frequencies (0, 1, 3, 5, 7, and 9 cycles∕mm) for all the stages as is shown in Fig. 7. Figure 7 provides an illustrative overview of the effect of different stages on the DQE.
Figure 7.
DQE values at different stages for six different spatial frequencies. The stage numbers are the same as shown in Fig. 2.
Experimental results
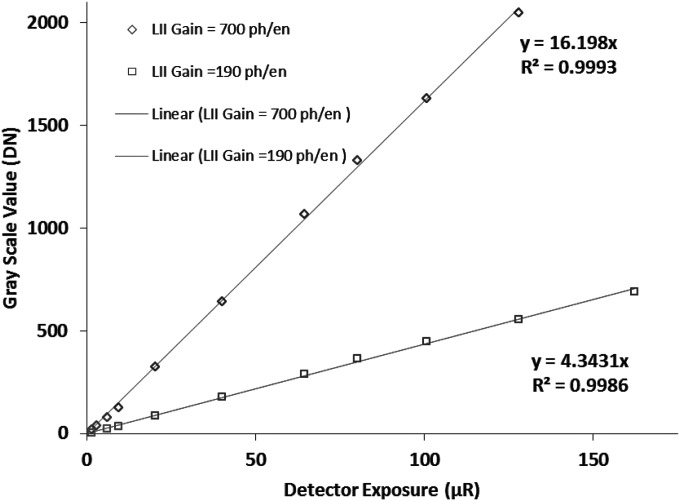
For the comparison of the theoretical estimation with the actual performance, we performed a number of experiments. To assess the detector linearity, we obtained offset and flat-field corrected images taken at different detector exposures. The mean values of the flat-field images were plotted against exposure and the linearity of our detector was verified. We repeated this test for different LII gains and the detector demonstrated linearity throughout the exposure range as seen in Fig. 8 for two different gains of the LII. The ratio of the slopes of the two curves matches well the ratio of the LII nominal gain values (700 photons∕electron and 190 photons∕electron)33 for these two settings.
Figure 8.
Characteristic response curves for the MAF. The mean digital numbers of the flat-field images are plotted versus detector input exposure for two different LII nominal gains (700 photons∕electron and 190 photons∕electron). The graphs show the linear regression fits to the data and demonstrate the linearity of the MAF with exposure for different LII gains.
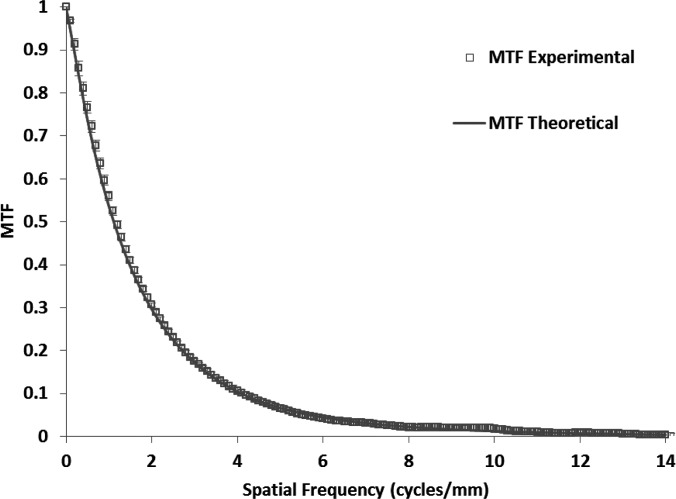
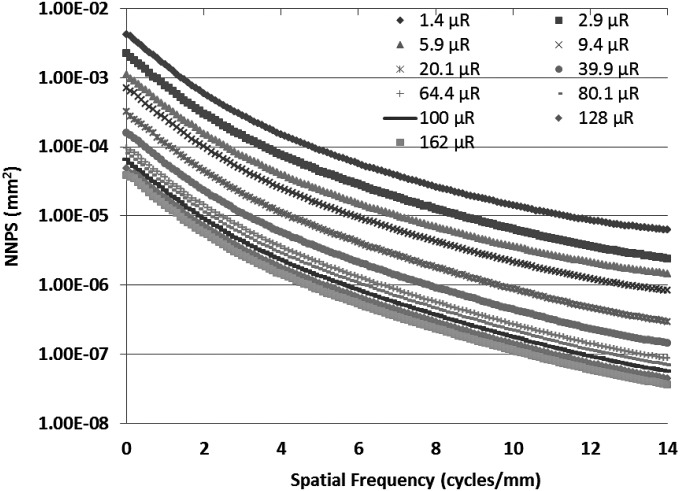
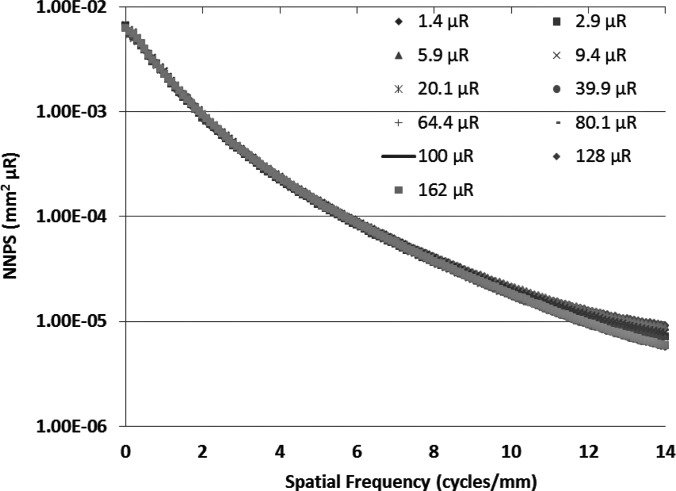
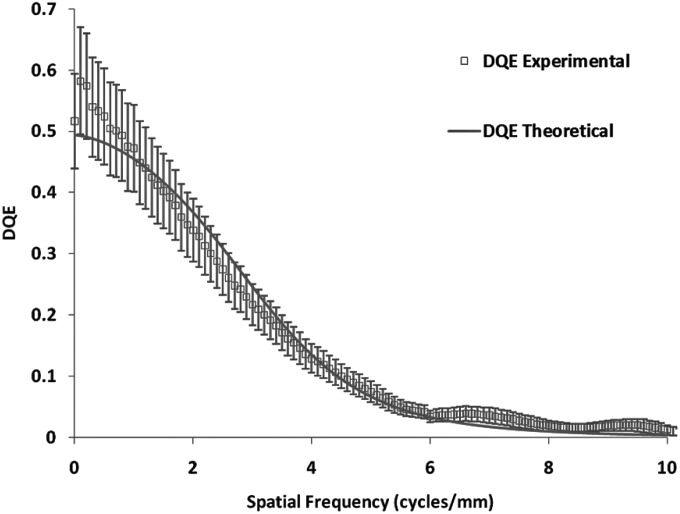
To measure the MTF for the MAF, we used the slanted edge method62 with the same spectrum. Figure 9 shows the experimentally measured MTF of the system. For the NPS determination, flat-field images were obtained at several different exposures. The individual flat-field images were corrected for the flat field and offset, and the Fourier transform method63 was used to calculate the NNPS. The calculated NNPS for various exposures and those normalized to their exposures are shown in Figs. 10 and11, respectively. The MAF detector does not have any lag, and hence, NNPS measurements do not have any lag factor. The DQE was then calculated using the NNPS for 162 μR and is shown in Fig. 12.
Figure 9.
Comparison of experimental and theoretically estimated MTFs for the MAF. The error bars for the experimentally measured MTF shows the variation between different measurements.
Figure 10.
The measured normalized noise power spectra for the MAF at various exposures are shown.
Figure 11.
Measured NNPS normalized to the input exposure for the MAF at various exposures are shown. The same shape of the NNPS curves at different exposures suggests similar DQE at different exposures.
Figure 12.
Comparison of experimental and theoretically estimated DQEs for the MAF. The error bars for the experimentally measured DQE shows the variation between different measurements.
Comparison of theoretical and experimental findings
A theoretical estimation of MTF and DQE for the MAF was made based on the linear cascade model. The MTF and DQE were measured for the detector and they were compared with the calculated values based on the linear system model. Figure 9 shows the theoretical and experimental MTF’s. Figure 12 shows the theoretical and experimental DQE’s. The error bars for the experimental MTF and DQE were calculated from the variation between seven independent measurements and indicate the 95% confidence interval for the mean value.
DISCUSSION
A region-of-interest high-resolution detector was developed and the linear cascade model was employed to evaluate its theoretical performance. The estimated theoretical performance matches well with the experimental findings and, thus, confirms the validity of the modeling of the stages. The detector is shown to be linear within the normal fluoroscopy and angiography exposure ranges (few μR to hundreds of μR). The variable gain provided by the LII did not affect the linearity of the detector except for very high angiography exposures with high frame rates. The NNPS measured at different exposures showed the same form for a range of exposures and, when normalized to the exposure, matched with each other as shown in Fig. 11. That resulted in a similar DQE for all exposures, indicating that the detector DQE is independent of exposure and the detector operates in the quantum-noise-limited region. Importantly, because of the large variable LII gain feature, the MAF operates in the quantum-limited region even at low exposures.
The good agreement between experimental and theoretical finding shows an in depth understanding of the modeling of the different stages. We used the linear system model to calculate the DQEs at each individual stage, and they were plotted for different spatial frequencies in Fig. 7. Close inspection of Fig. 7 shows that stage 18 (Quantum efficiency of CCD sensor) has deleterious effect on the DQE of the system especially at high spatial frequencies. Improvements in the MAF DQE could be achieved by making two small changes. The high-resolution type (HR) CsI provides better resolution than high light type (HL) at the cost of the light output (HR gives 60% of the HL output). The reduction in light output from the CsI could be compensated by increasing LII gain. If we replace the HL type CsI with the similar thickness of HR type CsI, we will get improvement in spatial resolution and DQE at high spatial frequencies.32, 61 Another weak stage is the quantum efficiency of the CCD sensor. The present CCD sensor is front illuminated and has poor quantum efficiency (∼23%). The replacement of the front illuminated CCD with a back illuminated CCD (quantum efficiency ∼23%) will provide a large improvement. Figure 13 shows the theoretical DQE for each stage at different spatial frequencies. The replacement of HL type CsI with HR type provides better MTF for all the frequencies (stage 4 in Figs. 713) and reduction in the drop in DQE at stage 9 (LII photocathode). One can clearly notice the improvement with the modified design. For comparison, the DQE value at the final stage is 0.19 for the modified design in comparison with 0.02 for the present configuration at 7 cycles∕mm. The CCD was used with a gain of 1 × , selecting the gain of 2 × or 4 × would have linearly increased the output signal, but would not have improved the final DQE values. All results given here are for the MAF detector and do not include system factors that may degrade the final image quality. The generalized parameter method can be used to determine the total system performance and has been used to evaluate the effects of focal spot blurring and scattered radiation for a prototype microangiographic detector.64
Figure 13.
DQE values at different stages for six different spatial frequencies for the MAF with a modified design [i.e., the HL type CsI is replaced with an HR type CsI and the front illuminated CCD (Quantum efficiency ∼23%) is replaced by a back illuminated CCD (Quantum efficiency ∼92%)]. The stage numbers are the same as shown in Fig. 2.
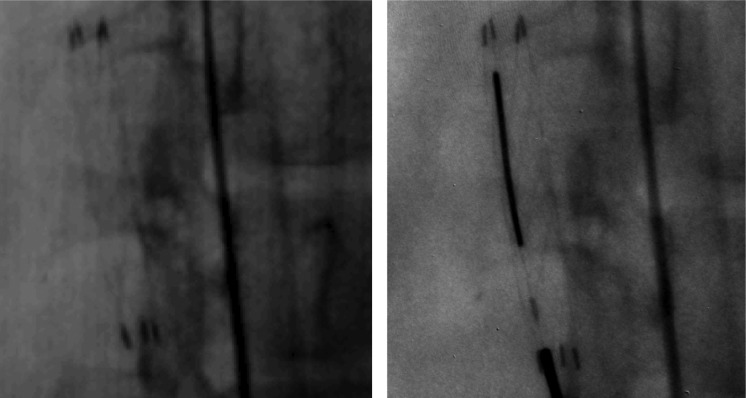
The MAF is now available as a preclinical image receptor in our research labs which contain complete clinical interventional imaging systems and is widely used for imaging various phantoms and in stent deployment experiments in rabbits. Images from those experiments shown in Fig. 14 were taken with the same technique parameters for both the flat panel detector and the MAF. More details are evident in the image taken with the MAF. For example, only the MAF image clearly shows the stent tines and hence the edge of the stent, while more precisely depicting the markers. These images clearly demonstrate the superiority of the MAF over present state-of-the-art detectors.
Figure 14.
Images of a deployed stent in a rabbit. The left image is taken with an FPD and the right image is taken with the MAF for the same animal and orientation. Additional details visible in the image taken with the MAF include the stent tines and hence the edge of the stent and the markers. Because the stent was deployed using the MAF as guidance, only the right image contains the guide wire. The exposure used was the same for both detectors.
SUMMARY AND CONCLUSION
The high-resolution, high-sensitivity microangiographic fluoroscopic detector for region-of-interest imaging was successfully designed and assembled. The linear cascade model was used to model each component and the overall theoretical performance was characterized in terms of standard detector quality metrics such as MTF and DQE. The detector was tested for linearity and operation for both angiographic and fluoroscopic exposure levels. The MTF, NNPS, and DQE were measured, and the measured MTF and DQE data showed good agreement with theoretical calculations. The MAF showed a substantial improvement in image quality in EIGI animal procedures during preclinical testing. Following our successful preclinical testing, the next step is clinical testing which has begun for neuro-interventional procedures28 at one of our university hospitals. The theoretical performance estimation shown here can facilitate component design and optimization of future region-of-interest detectors for dedicated and specific clinical imaging tasks.
ACKNOWLEDGMENTS
This work has been supported in part by NIH grants R01 EB002873 and R01 EB008425 and an equipment grant from Toshiba Medical Systems Corporation.
APPENDIX A: DETAILED LINEAR SYSTEM MODEL CALCULATIONS
Stage 1. X-ray absorption
| (A1) |
| (A2) |
where q0 is the incident number of quanta and η is energy weighted quantum detection efficiency of the phosphor and can be calculated by using:
| (A3) |
Here, x is the thickness of the phosphor, μ(E) is the linear attenuation coefficient, and φ(E) is the photon fluence, where E is the photon energy.
Stage 2. K-fluorescence event selection
Once the x-ray photon is absorbed in the phosphor, it may or may not give rise to K x-rays. We consider all the probabilities in the second stage. We used the parallel pathways model suggested by Cunninghum et al.57 If the x-ray photon did not produce K-shell fluorescent x-rays, it would follow subpath A, if a K-fluorescent x-ray is produced, depending upon the location of the absorption it would follow B or C subpaths.45, 53, 57 Path B would be followed when a K-fluorescent x-ray is produced and the remaining energy is absorbed locally and path “C” is followed for the reabsorption of K-fluorescent photon at a remote location. Signal and noise power spectrum for these stages is given by
| (A4) |
| (A5) |
| (A6) |
| (A7) |
| (A8) |
| (A9) |
Here, ζ is the K-shell contribution to photoelectric effect and ω is the K-fluorescence yield. The A and B branches follow the conversion gain stages, while x-ray photons going through the C branch suffer from blurring due to absorption of the K-fluorescent x-ray at some remote location.
Sub Stage 2i. Probabilistic absorption of K-fluorescent x-ray photons
| (A10) |
| (A11) |
Here, fk is the probability for the absorption of the K-fluorescent photon somewhere within the volume of the phosphor thickness. Ik is the probability of the K-fluorescent photon ejection.
Sub Stage 2ii. Blurring due of K-fluorescent x-ray photons reabsorption
If Tk(u) is the MTF associated with the K-fluorescence re-absorption process, the output signal and the noise power spectrum for this stage will be as follows:
| (A12) |
| (A13) |
Stage 3. X-ray photon conversion into light photons
The average energy of the incident x-ray spectrum and the K-fluorescent x-rays is given by Eavg and Ek, respectively. Approximately, 18 eV of x-ray energy is needed to generate one light photon in the CsI.61 The conversion gain in the phosphor associated with branches A, B and, C is expressed by gA, gB and gc and the expression for these gains are as follows:
| (A14) |
| (A15) |
| (A16) |
Conversion in each path is decided by the x-ray photon energy which may be any of these: primary, primary minus K-fluorescent, or K-fluorescent. With these gains, we can calculate the output using the relation given for the amplification process.
| (A17) |
| (A18) |
| (A19) |
| (A20) |
| (A21) |
| (A22) |
Stage 4. Blurring in Phosphor
This is a stochastic blurring stage and output signal and noise power spectrum will follow the equations given for the stochastic blurring process.
If T4(u) is the MTF for the blurring in the phosphor then the signal and noise power spectrum for all three branches will be affected by T4(u) as follows:
| (A23) |
| (A24) |
| (A25) |
| (A26) |
| (A27) |
| (A28) |
For the parallel branching of the events occurring in the phosphor, we need to take care of cross correlated events.45,48,53,57 Branch A does not depend on the branches B and C so there will not be any cross-correlated term between A and B or C. But branches C and B are cross-correlated and the real quantities will gave rise to NPSBC4 (u) and NPSCB4(u). Both quantities are equal and they are given by
| (A29) |
The final output signal and the NPS at the end of this stage is achieved by combining outputs of all the branches and it is given by:
| (A30) |
| (A31) |
These are the detailed expressions for the signal and the NPS at the output of the phosphor.
Stage 5. Transmission through phosphor FOP
This is a binomial selection stage and if the transmission efficiency of the FOP is given by κ5, the signal and NPS are given by,
| (A32) |
| (A33) |
Stage 6. Blurring in phosphor FOP
Stochastic blurring stage and T6(u) is the blurring in the FOP.
| (A34) |
| (A35) |
Stage 7. Transmission through LII input FOP
Binomial selection stage with transmission efficiency κ7
| (A36) |
| (A37) |
Stage 8. Blurring in LII input FOP
Stochastic blurring stage and T8(u) is the blurring in FOP
| (A38) |
| (A39) |
Stage 9. Quantum Efficiency of photocathode
Binomial selection stage with photocathode efficiency κ9
| (A40) |
| (A41) |
Stage 10. Light image intensifier gain
Amplification stage with LII gain g10 with Poisson distribution (σg102=g10),
| (A42) |
| (A43) |
Stage 11. Blurring in LII
Stochastic blurring stage and T11(u) is the blurring in LII
| (A44) |
| (A45) |
Stage 12. Transmission through LII output FOP
Binomial selection stage with transmission efficiency κ12
| (A46) |
| (A47) |
Stage 13. Blurring in LII output FOP
Stochastic blurring stage and T13(u) is the blurring in FOP
| (A48) |
| (A49) |
Stage 14. Transmission through FOT
Binomial selection stage with transmission efficiency κ14
| (A50) |
| (A51) |
Stage 15. Blurring through FOT
Stochastic blurring stage and T15(u) is the blurring in FOP
| (A52) |
| (A53) |
Stage 16. Transmission through FOP in CCD
Binomial selection stage with transmission efficiency κ16
| (A54) |
| (A55) |
Stage 17. Blurring in FOP on CCD
Stochastic blurring stage and T17(u) is the blurring in FOP
| (A56) |
| (A57) |
Stage 18. Conversion of light photons into electron-hole pairs
Binomial selection stage with transmission efficiency κ18
| (A58) |
| (A59) |
Stage 19. Thermal noise generation
Generation of thermal electrons gives a noise variance, σt2. Offset correction corrects for the thermal noise effect from the signal only. σt2 is an additive term in the NPS.
| (A60) |
| (A61) |
Stage 20. Blurring in CCD
Deterministic blurring stage and T20(u) is the blurring due to the pixelization in the CCD
| (A62) |
| (A63) |
Stage 21. Readout and additive noise
The noise variance σR2 associated with the readout process adds a term in the NPS
| (A64) |
| (A65) |
After going through all the stages, we obtain expressions for the signal and the NPS for the final stage. The final stage signal and NPS can be used to derive the frequency dependent MTF and DQE of the imaging detector.
References
- Rudin S., Bednarek D. R., and Hoffmann K. R., “Endovascular image-guided interventions (EIGIs),” Med. Phys. 35 (1), 301–309 (2008). 10.1118/1.2821702 [DOI] [PMC free article] [PubMed] [Google Scholar]
- Adamson J., Beswick A., and Ebrahim S., “Is stroke the most common cause of disability?,” J. Stroke Cerebrovasc. Dis. 13 (4), 171–177 (2004); 10.1016/j.jstrokecerebrovasdis.2004.06.003 [DOI] [PubMed] [Google Scholar]
- Dubinsky R. and Lai S., “Mortality of stroke patients treated with thromolysis: Analysis of a nationwide inpatient sample,” Neurology 66 u(11), 1742–1744 (2006). 10.1212/01.wnl.0000218306.35681.38 [DOI] [PubMed] [Google Scholar]
- Higashida R., Lahue B., Torbey M., Hopkins L. N., Leip E., and Hanley D., “Treatment of unruptured intracranial aneurysms: A nationwide assessment of effectiveness,” Am. J. Neuroradiol. 28, 146–151 (2007). [PMC free article] [PubMed] [Google Scholar]
- Rammohan C., Erdogan A., and Davidson C. J., “New stent technologies: Coated, covered, and bifurcated stents,” Controversies Consensus Imaging Intervention, 4–9 (2003).
- Vosburg K. G., Swank R. K., and Houston J. M., “X-ray image intensifiers,” Adv. Electron. Electron Phys. 43, 205–244 (1977). [Google Scholar]
- Balter S., “X-ray image intensifier,” Cathet. Cardiovasc. Interv. 46 (2), 238–244 (1999). [DOI] [PubMed] [Google Scholar]
- Cowen A. R., “Digital x-ray imaging,” Meas. Sci. Technol. 2, 691–707 (1991). 10.1088/0957-0233/2/8/001 [DOI] [Google Scholar]
- Rowlands J. A. and Yorkston J., “Flat panel detectors for digital radiography,” Phys. Med. Imaging 1, 225–313 (2000). [Google Scholar]
- Lutha R. and Rowlands J. A., “Origins of flare in x-ray image intensifiers,” Med. Phys. 17, 913–921 (1990). 10.1118/1.596447 [DOI] [PubMed] [Google Scholar]
- Antonuk L. E., Jee K. W., El-Mohri Y., Maolinbay M., Nassif S., Rong X., Zhao Q., Siewerdsen J. H., Street R. A., and Shah K. S., “Strategies to improve the signal and noise performance of active matrix, flat-panel imagers for diagnostic x-ray applications,” Med. Phys. 27 (2), 289–306 (2000). 10.1118/1.598831 [DOI] [PubMed] [Google Scholar]
- Antonuk L. E., Zhao Q., El-Mohri Y., Du H., Wang Y., Street R. A., Ho J., Weisfield R., and Yao W., “An investigation of signal performance enhancements achieved through innovative pixel design across several generations of indirect detection, active matrix, flat-panel arrays,” Med. Phys. 36 (7), 3322–3339 (2009). 10.1118/1.3049602 [DOI] [PMC free article] [PubMed] [Google Scholar]
- Siewerdsen J. H. and Jaffray D. A., “A ghost story: Spatio-temporal response characteristics of an indirect-detection flat-panel imager,” Med. Phys. 26 (8), 1624–1641 (1999). 10.1118/1.598657 [DOI] [PubMed] [Google Scholar]
- Anthony Seibert J., “ Flat-panel detectors: How much better are they?,” Pediatr. Radiol. 36 (Suppl. 2), 173–181 (2006). 10.1007/s00247-006-0208-0 [DOI] [PMC free article] [PubMed] [Google Scholar]
- Rudin S., Kuhls A., Yadava G., Josan G., Wu Y., chityala R., Rangwala H., Ionita C., Hoffmann K. R., and Bednarek D. R., “New light-amplifier- based detector design for high spatial resolution and high sensitivity CBCT mammography and fluoroscopy,” Proc. SPIE 6142, 624–634 (2006). [DOI] [PMC free article] [PubMed] [Google Scholar]
- Hunt D. C., Tousignant O. and Rowlands J. A., “Evaluation of the imaging properties of an amorphous selenium-based flat panel detector for digital fluoroscopy,” Med. Phys. 31, 1166–1175 (2004). 10.1118/1.1707755 [DOI] [PubMed] [Google Scholar]
- Wronski M. M. and Rowlands J. A., “Direct conversion flat-panel imager with avalanche gain: Feasibility investigation for HARP-AMFPI,” Med. Phys. 35, 5207–5218 (2008). 10.1118/1.3002314 [DOI] [PMC free article] [PubMed] [Google Scholar]
- Arvanitis C. D., Bohndiek S. E., Blakesley J., Olivo A. and Speller R. D., “Signal and noise transfer properties of CMOS based active pixel flat panel imager coupled to structured CsI:Tl,” Med. Phys. 36, 116–126 (2009). 10.1118/1.3036117 [DOI] [PubMed] [Google Scholar]
- Arvanitis C. D., Bohndiek S. E., Blakesley J., Olivo A., and Speller R. D., “Empirical electro-optical and x-ray performance evaluation of CMOS active pixels sensor for low dose, high resolution x-ray medical imaging,” Med. Phys. 34, 4612 (2007). 10.1118/1.2804744 [DOI] [PubMed] [Google Scholar]
- Michail C. M., Spyropoulou V. A., Fountos G. P., Kalyvas N. I., Valais I. G., Kandarakis I. S., and Panayiotakis G. S., “Experimental and theoretical evaluation of a high resolution CMOS based detector under x-ray imaging conditions,” IEEE Trans. Nucl. Sci. 58 (1), 314–322 (2011). 10.1109/TNS.2010.2094206 [DOI] [Google Scholar]
- Elbakri I. A., McIntosh B. J., and Rickey D. W., “Physical characterization and performance comparison of active and passive-pixel CMOS detectors for mammography,” Phys. Med. Biol. 54 (6), 1743-1755, 2009. 10.1088/0031-9155/54/6/022 [DOI] [PubMed] [Google Scholar]
- Cho H. S., Jeong M. H., Han B. S., Kim S., Lee B. S., Kim H. K., and Lee S. C., “Development of a portable digital radiographic system based on FOP-coupled CMOS image sensor and its performance evaluation,” IEEE Trans Nucl. Sci. 52 (5),1766–1772 (2005). 10.1109/TNS.2005.856792 [DOI] [Google Scholar]
- Kwang Hyun Kim and Young Soo Kim, “Scintillator and CMOS APS imager for radiography conditions,” IEEE Trans. Nucl. Sci. 55 (3), 1327–1332 (2008). 10.1109/TNS.2008.922214 [DOI] [Google Scholar]
- Esbrand C. J., Arvanitis C. D., Pani S., Price B. D., Griffiths J. A., Metaxas M., Royle G. J., Noy M., Leaver J., Longo R., Rokvic T., Turchetta R., Giorgiou H., Schulerud H., and Speller R. D., “Characterisation of the components of a prototype scanning intelligent imaging system for use in digital mammography: The I-ImaS system,” IEEE Trans. Nucl. Sci. 56 (3), 1419–1425 (2009). 10.1109/TNS.2009.2015762 [DOI] [Google Scholar]
- Rudin S. and Bednarek D. R., “Region of interest fluoroscopy,” Med. Phys. 19 (5), 1183–1189 (1992). 10.1118/1.596792 [DOI] [PubMed] [Google Scholar]
- Rudin S., Bednarek D. R., Kezerashvili M., Granger W. E., Serghany J. E., Guterman L. R., Hopkins L. N., Szymanski B., and Loftus R. J., “Clinical application of region-of-interest techniques to radiologic imaging,” Radiographics 16 (4), 895–902 (1996). [DOI] [PubMed] [Google Scholar]
- Rudin S., Guterman L. R., Granger W. E., Bednarek D. R., and Hopkins L. N., “Application of region-of-interest imaging techniques to neurointerventional radiology,” Radiology 199 (3), 870–873 (1996). [DOI] [PubMed] [Google Scholar]
- Binning M. J., Orion D., Yashar P., Webb S., Ionita C. N., Jain A., Rudin S., Hopkins L. N., Siddiqui A. H., and Levy E. I., “Use of the micro-angiographic fluoroscope for coiling of intracranial aneurysms,” Neurosurgery (accepted for publication). [DOI] [PMC free article] [PubMed]
- Yadava G. K., Kuhls-Gilcrist A. T., Rudin S., Patel V. K., Hoffmann K. R., and Bednarek D. R., “A practical exposure-equivalent metric for instrumentation noise in x-ray imaging systems,” Phys. Med. Biol. 53 (18), 5107–5121 (2008). 10.1088/0031-9155/53/18/017 [DOI] [PMC free article] [PubMed] [Google Scholar]
- Ionita C., Keleshis C., Jain A., Bednarek B. R., and Rudin S., ‘Testing of the high-resolution ROI micro-angio fluoroscope (MAF) detector using a modified NEMA XR-21 phantom,” Med. Phys. 36, 2713 (2009). 10.1118/1.3245875 [DOI] [Google Scholar]
- Ionita C. N., Keleshis C. M., Yadava G., Hoffmann K. R., Bednarek D. R., and Rudin S., “In- vivo endovascular image guided interventions (EIGI) using the high-sensitivity micro-angiographic fluoroscope (HS-MAF),” Proc. SPIE 6918, 53 (2008). [DOI] [PMC free article] [PubMed] [Google Scholar]
- Hamamatsu Corp, FOS—Fiber Optic Plate With Scintillator for Digital X-Ray Imaging (Hamamatsu Corp., Bridgewater, NJ, 1996).
- Delft Electronic Products B. V., Image Intensifier Tube Brochure (Delft Electronic Products B. V., NL-9300 AB Roden, Dwazziewegen 2, Roden, The Netherlands).
- Wiza J. L., “Micro channel plate detectors,” Nucl. Instrum. Methods 162, 587–601 (1979). 10.1016/0029-554X(79)90734-1 [DOI] [Google Scholar]
- Jain A., Kulhs-Gilcrist A., Bednarek D. R., and Rudin S., “Improved contrast and spatial resolution with single photon counting (SPC) for an area x-ray imager, the newly developed high-resolution micro-angiographic fluoroscopic (MAF) detector,” Nuclear Science Symposium Conf.erence Record (NSS/MIC) 2009, IEEE, Orlando, FL, (2009), pp. 3012–3016 . [DOI] [PMC free article] [PubMed] [Google Scholar]
- Panse A., Jain A., Wang W., Yao R., Bednarek D. R., and Rudin S., “High resolution emission and transmission imaging using the same detector,” Nuclear Science Symposium Conference Record (NSS/MIC/RTSW), 2010, IEEE, Knoxville, TN: (2010). [DOI] [PMC free article] [PubMed]
- Fiber Optic Tapers- Sizes and Specifications, Incom Inc., Charlton, MA (http://incomusa.com/).
- Datasheet, FTT1010-M Frame Transfer CCD Image Sensor, DALSA Professional Imaging, AE Eindhoven, The Netherlands.
- Keleshis C. M., Ionita C. N., Yadava G., Bednarek D. R., Hoffmann K. R., and Rudin S., “Lab VIEW graphical user interface for a new high sensitivity, high resolution micro angio-fluoroscopic system,” Proc. SPIE 6913, 196 (2008). [DOI] [PMC free article] [PubMed] [Google Scholar]
- Wang W., Ionita C. N., Keleshis C., Kuhls-Gilcrist A. T., Jain A., Bednarek D. R., and Rudin S., “Progress in the development of a new angiography suite including the high resolution micro-angiographic fluoroscope (MAF), a control, acquisition, processing, and image display system (CAPIDS), and a new detector changer integrated into a commercial C-arm angiography unit to enable clinical use,” Proc. SPIE 7622, 200 (2010). [DOI] [PMC free article] [PubMed] [Google Scholar]
- Cunningham I. A.,” Linear-systems modeling of a parallel cascaded stochastic processes: The NPS of radiographic screens with reabsorption of characteristic x-rays radiation,” Proc. SPIE 3336, 220–230 (1998). 10.1117/12.317021 [DOI] [Google Scholar]
- Cunningham I. A., “Applied linear-systems theory,” in Handbook of Medical Imaging, edited by Beutel J., Kundel H. L., and Van Metter R. L. (SPIE, Washington, 2000), Vol. 1. Physics and Psychophysics, pp. 79–160. [Google Scholar]
- Cunningham I. A., Westmore M. S., and Fenster A., “A spatial-frequency dependent quantum accounting diagram and detective quantum efficiency model of signal and noise propagation in cascaded imaging systems,” Med. Phys. 21 (3), 417–427 (1994). 10.1118/1.597401 [DOI] [PubMed] [Google Scholar]
- Bissonnette J. P., Cunnigham I. A., Jaffray D. A., Fenster A., and Munro P., “A Quantum Accounting and detective quantum efficiency analysis for video-based portal imaging,” Med. Phys. 24, 815–826 (1997). 10.1118/1.598009 [DOI] [PubMed] [Google Scholar]
- Ganguly A., Rudin S., Bednarek D. R., and Hoffmann K. R., “Microangiography for neurovascular imaging part II: Cascade model analysis,” Med. Phys. 30, 3029–3039 (2003). 10.1118/1.1617550 [DOI] [PubMed] [Google Scholar]
- Van Metter R. and Rabbani M., “An application of multivariate moment-generating functions to the analysis of signal and noise propagation in radiographic screen-film systems,” Med. Phys. 17 (1), 65–71 (1990). 10.1118/1.596529 [DOI] [PubMed] [Google Scholar]
- Rabbani M., Shaw R., and Van Metter R., “Detective quantum efficiency of imaging systems with amplifying and scattering mechanisms,” J. Opt. Soc. Am. 4, 895–901 (1987). 10.1364/JOSAA.4.000895 [DOI] [PubMed] [Google Scholar]
- Cunningham I. A., Westmore M. S., and Fenster A., “Linear- systems modeling of parallel cascaded stochastic processes: The NPS of Radiographic screens with reabsorption of characteristic x-radiation,” Proc. SPIE 3336, 220–230 (1998). 10.1117/12.317021 [DOI] [Google Scholar]
- Cunningham I. A. and Shaw R., “Signal-to-noise optimization of medical imaging systems,” J. Opt. Soc. Am. A 6, 621–632 (1999). 10.1364/JOSAA.16.000621 [DOI] [Google Scholar]
- Yao J. and Cunningham I. A., “Parallel cascade: New ways to describe noise transfer in medical imaging systems,” Med. Phys. 28, 2020–2038 (2001). 10.1118/1.1405842 [DOI] [PubMed] [Google Scholar]
- Williams M. B., Simoni P. U., Smilowitz L., Stanton M., Phillips W., and Stewart A., “Analysis of the detective quantum efficiency of a developmental detector for digital mammography,” Med. Phys. 26 (11), 2273–2285 (1999). 10.1118/1.598741 [DOI] [PubMed] [Google Scholar]
- Que W. and Rowlands J. A., “X-ray imaging using amorphous selenium: Inherent spatial resolution,” Med. Phys. 22 (4), 365–374 (1995). 10.1118/1.597471 [DOI] [PubMed] [Google Scholar]
- Vedantham S., Karellas A., and Suryanarayanan S., “Solid-state fluoroscopic imager for high-resolution angiography: Parallel-cascaded linear systems analysis,” Med. Phys. 31 (5), 1258–1268 (2004). 10.1118/1.1689014 [DOI] [PMC free article] [PubMed] [Google Scholar]
- Zhao W., Ji W. G., and Rowlands J. A., “Effects of characteristic x rays on the noise power spectra and detective quantum efficiency of photoconductive x-ray detectors,” Med. Phys. 28 (10), 2039–2049 (2001). 10.1118/1.1405845 [DOI] [PubMed] [Google Scholar]
- Chan H. P. and Doi K., “Energy and angular dependence of x-ray absorption and its effect on radiographic response in screen-film systems,” Phys. Med. Biol. 28 (5), 565–579 (1983). 10.1088/0031-9155/28/5/009 [DOI] [PubMed] [Google Scholar]
- Thacker S. C., Glick S. J., and Badano A., “Monte Carlo simulation of a CsI-based flat panel imager for mammography,” Proc. SPIE 5368, 411–419 (2004). 10.1117/12.535806 [DOI] [Google Scholar]
- Cunninghum I. A., Yao J., and Subotic V., “Cascaded Models and the DQE of flat-panel imagers: Noise aliasing, secondary quantum noise and reabsorption,” Proc SPIE 4682, 61–72 (2002). 10.1117/12.465610 [DOI] [Google Scholar]
- Tables of X-Ray Mass Attenuation Coefficients and Mass Energy-Absorption Coefficients,” in NIST Physical Reference Data , 2004. (http://www.nist.gov/pml/data/xraycoef/index.cfm).
- Hejazi S. and Trauernicht D. P., “System Considerations in CCD-based x-ray imaging for digital mammography,” Med. Phys. 24, 287–297 (1997). 10.1118/1.598072 [DOI] [PubMed] [Google Scholar]
- Kapany N. S., “Fiberoptics, Principles and Applications” (Academic, New York, 1967), p. 21. [Google Scholar]
- Zhao W., Ristic G., and Rowlands J. A., “X-ray imaging performance of structured cesium iodide scintillators,” Med. Phys. 31, 2594–2605 (2004). 10.1118/1.1782676 [DOI] [PubMed] [Google Scholar]
- Samei E., Flynn M. J., and Reimann D. A., “A method for measuring the presampled MTF of digital radiographic systems using an edge test device,” Med. Phys. 25 (1), 102–113 (1998). 10.1118/1.598165 [DOI] [PubMed] [Google Scholar]
- J. T.DobbinsIII, Ergun D. L., Rutz L., Hinshaw D. A., Blume H., and Clark D. C., “DQE(f) of four generations of computed radiography acquisition devices,” Med. Phys. 22 (10), 1581–1593 (1995). 10.1118/1.597627 [DOI] [PubMed] [Google Scholar]
- Kyprianou I., Rudin S., Bednarek D. R., and Hoffmann K. R., Generalizing the MTF and DQE to include x-ray scatter and focal spot unsharpness: Application to a new micro-angoigraphic system. Med. Phys. 32, 613–626 (2005). 10.1118/1.1844151 [DOI] [PubMed] [Google Scholar]


