

Abstract
Although the structural phenotype of Fetal Alcohol Syndrome (FAS) is established, prenatal exposure to alcohol may produce a broader spectrum of defects, Fetal Alcohol Spectrum Disorder (FASD). Documenting the full spectrum of defects associated with FASD is critical to determining the true incidence of this disorder. We examined 831 children from the Collaborative Initiative on Fetal Alcohol Spectrum Disorders using a structured protocol for diagnosis of FAS using the cardinal facial and growth features, and assessment of additional structural defects thought to occur more often in children with prenatal alcohol exposure. Subjects were classified as FAS, Deferred (some characteristic features of FAS) or No FAS, Groups were compared on prevalence of additional features and number of additional features observed, stratified by diagnostic category, sex, race and age. Prevalence of most additional features was greatest among subjects with FAS and least among No FAS. A higher frequency of additional features was observed among FAS and Deferred subjects ≥12 years of age than among those under 12. FAS and Deferred Whites had greater frequency of additional features than Cape Colored. Prenatal alcohol exposure may produce a broad spectrum of structural defects that goes beyond FAS with implications regarding the impact of alcohol on the developing fetus, a prerequisite for ultimate prevention of FASD.
Keywords: fetal alcohol spectrum disorders, fetal alcohol syndrome, dysmorphic features, diagnostic criteria
INTRODUCTION
The Fetal Alcohol Syndrome (FAS) is a specific pattern of altered growth, performance and structure resulting from prenatal exposure of the developing fetus to alcohol [Lemoine et al., 1968; Jones et al., 1973]. Although a number of investigators have set forth specific criteria necessary for diagnosis of FAS, four publications are of most importance relative to this issue [Stratton et al, 1996; Astley et al, 2000; Hoyme et al., 2005; Chudley et al, 2005]. Despite some differences that exist among them, all four of the previously published guidelines require growth deficiency and microcephaly, as well as alterations in facial development including short palpebral fissures, a smooth philtrum, and a thin vermillion border of the upper lip for diagnosis of this disorder. Strict adherence to these guidelines may be necessary for diagnosis of FAS. However, it is likely that prenatal exposure to alcohol leads to a much broader spectrum of defects referred to as Fetal Alcohol Spectrum Disorders (FASD). Although the phenotype of FAS, the most severe end of the spectrum, has been well-characterized, the structural defects that are associated with the broader spectrum of defects (FASD) have not been well described.
The purposes of this study are to: 1) describe the frequency of a number of specific minor structural defects that are thought to occur more often in children with prenatal alcohol exposure but are not part of the constellation of features required for diagnosis of FAS, 2) to compare the frequency of these additional specific features among children who do and do not have some or all of the key features of FAS, and 3) to determine if the number of these additional features varies by age, sex, or race of the child. Ultimately, this will be important in establishing the full range of structural anomalies resulting from prenatal exposure to alcohol.
Only by documenting the full spectrum of structural defects that constitute FASD will it be possible to fully appreciate the true incidence of problems that alcohol imposes on the developing human fetus, a requirement for developing and carrying out programs to prevent it.
MATERIALS AND METHODS
Study Population
This study was part of the Collaborative Initiative on Fetal Alcohol Spectrum Disorders (CIFASD). The CIFASD is an international consortium of basic science and clinical investigations sponsored by the U.S. National Institute of Alcohol Abuse and Alcoholism (NIAAA) and focused on addressing critical questions regarding the prenatal effects of alcohol. As part of the CIFASD, a Dysmorphology Core was established to assure accurate and consistent diagnosis of FAS in children at all consortium sites through implementation of a standard protocol based on documentation of the clinical phenotype of FAS. Children at these sites were ascertained using a variety of methods including cross-sectional, retrospective and prospective study designs.
As of 2009, 841 children from ten consortium sites (Atlanta, GA; Buffalo, New York; Los Angeles, CA; Plains States of the US; San Diego, California; Rome, Italy; Moscow, Russia; Helsinki, Finland; Cape Town, South Africa; and Rivne, Ukraine) were examined by at least one of us (HEH, LKR, MdelC, MAM and/or KLJ). Of these, 831 examinations had complete information on the additional features. The study was prospectively reviewed and approved by Human Subject Protection Programs at all participating clinical sites and at the University of California, San Diego.
Dysmorphology Assessment
A structured protocol was used for assessment of specific dysmorphologic features that constitute FAS. Palpebral fissure length (PFL) was measured with a rigid ruler marked in millimeters. Occipital frontal circumference (OFC) was measured by a cloth measuring tape. Height and weight were also measured. Age-specific centiles for height, weight, OFC and PFL were determined using previously published charts (Kuczmarski et al., 2000; Thomas et al., 1987; Tanner, 1978; Nelllhaus, 1968). The morphologic characteristics of the upper lip and philtrum were assessed and scored with the lip/philtrum guide described by Astley and Clarren [Astley et al., 2000]. Likert scale scores between 1 and 5 were assigned for the thinness of the vermilion border of the upper lip and the flatness/smoothness of the philtral ridges, with higher scores indicating greater thinness or flatness/smoothness. Scores of 4 or 5 for each scale were considered to be consistent with FAS.
Children were given a preliminary diagnosis solely on the basis of key facial features (PFL ≤10th centile, a smooth philtrum, a thin vermilion border, microcephaly (OFC ≤ 10th centile) and growth deficiency (height and/or weight ≤10th centile). In addition to the diagnosis of FAS, children could be classified in a “Deferred” group if they had features suggestive of FAS but that were insufficient to meet the specific diagnostic criteria. Specifically, children were classified as Deferred if they had only one of the key facial features necessary for diagnosis of FAS, or if they had growth deficiency and microcephaly, or if they had either growth deficiency or microcephaly and one of these specific additional features that are not part of the constellation of features required for diagnosis but occur more frequently in children prenatally exposed to alcohol.
Those additional features, set forth by Hoyme et al., include a “railroad track” configuration of the ears (see Figure 1), ptosis of the eyelids, a “hockey stick” palmar crease (see Figure 2), other palmar crease abnormalities, lack of complete extension of one or more digits, decreased supination/pronation at the elbows, other joint contractures including inability to completely extend and/or contract at the hips, knees, and ankles, as well as a heart murmur [Stratton et al., 1996]. Assessment of these additional features was subjective in some cases. For example, a goniometer was not used to specifically determine the degree of joint contractures, incomplete extension of one or more digits or decreased supination/pronation at the elbows. With respect to palmar creases, any deviation from the usual three deep creases on the palm was categorized as “other palmar crease abnormality”. Children who did not meet the criteria for either the FAS or Deferred group were classified into a “No FAS” group.
FIG 1.

Railroad track configuration of the ear: Note that the prominent horizontal crus of the helix in combination with a prominent and parallel inferior crus of the antihelix. [Color figure can be viewed in the online issue, which is available at wileyonlinelibrary.com.]
FIG 2.
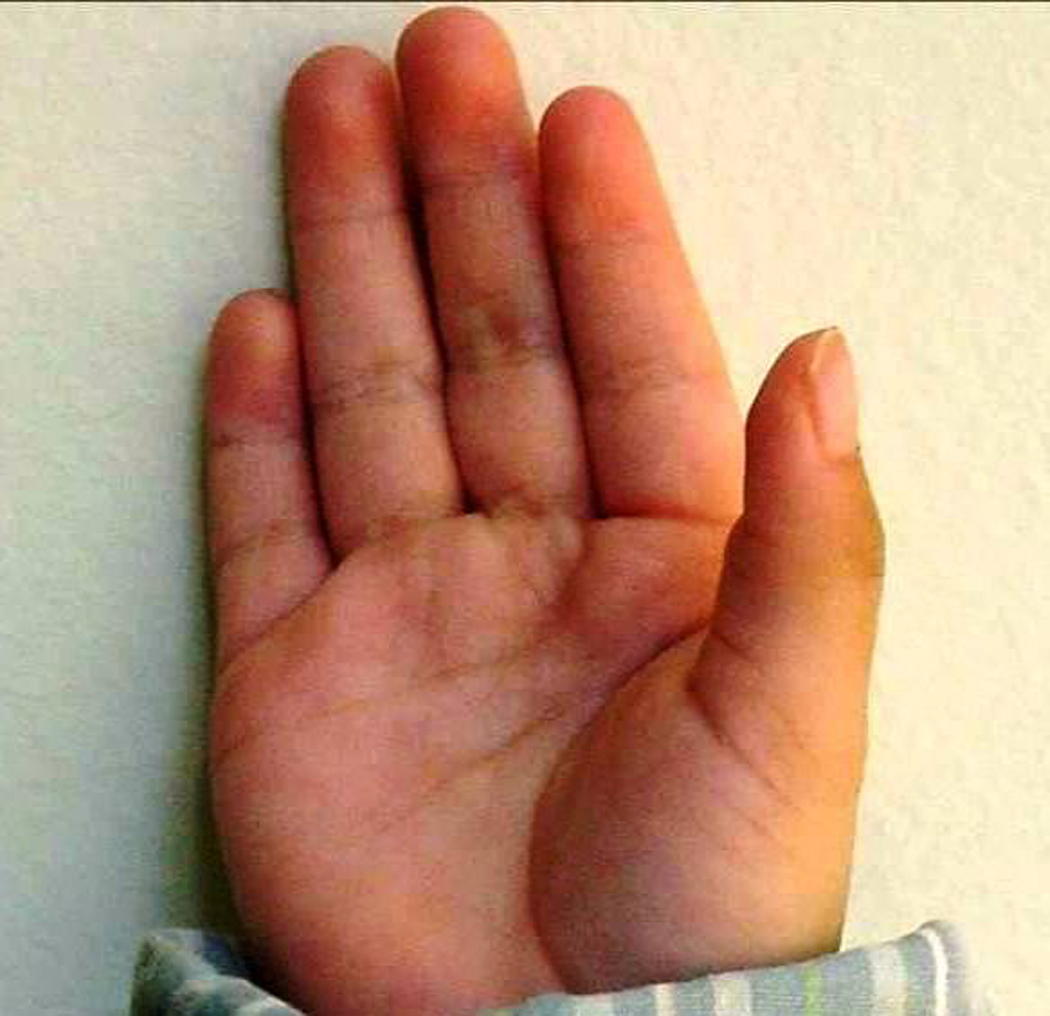
Hockey stick crease: Note that the distal palmar crease curves distally and terminates between the index and middle fingers. [Color figure can be viewed in the online issue, which is available at wileyonlinelibrary.com.]
Statistical Analysis
All statistical analyses were performed in SPSS (Release 15.0.1.1, SPSS, Inc., 1989–2006 and SAS Release 9.1, SAS Institute, Inc., Cary NC, 2002–2003). The frequency of specific features (present or absent) and number of features (0, 1, ≥2) were compared between children in the three categories: FAS, Deferred and No FAS using chi-square or Fisher’s Exact Test as appropriate. For comparison of the number of features by race, cells that contained fewer than 15 subjects resulted in exclusion of that stratum from the analysis. For the comparison of number of features by age, a cutoff of 12 years of age was used in order to account for changes in structure that occur as a result of the adolescent growth spurt.
RESULTS
The number of children by site and by category (FAS, Deferred, No FAS) for the 831 children in the sample is shown in Table I. Of the 244 subjects classified as Deferred, 25 (10%) were so classified because they had either growth deficiency or microcephaly and one of the specific eight additional features. Those 25 subjects were excluded from further analysis in order that the definition of each of the categories not include the presence or absence of one of the features that are being investigated. The racial distribution of subjects is as follows: Native American or Alaskan Native (n = 38), Asian (n = 9), Hawaiian/Pacific Islander (n = 2), Black/African American (n = 26), White (n = 486), Cape Colored (n =100), multiracial (n = 3), unknown race (n =142).
Table I.
Subjects by project site and FAS diagnostic category
| Site | FAS | Deferred | No FAS | Total |
|---|---|---|---|---|
| Atlanta, GA | 4 | 6 | 6 | 16 |
| Buffalo, NY | 22 | 14 | 39 | 75 |
| Los Angeles, CA | 3 | 6 | 7 | 16 |
| Plains States, US | 15 | 15 | 21 | 51 |
| San Diego, CA | 15 | 39 | 65 | 119 |
| FINLAND | 55 | 30 | 57 | 142 |
| Rome, ITALY | 14 | 78 | 121 | 213 |
| Moscow, RUSSIA | 64 | 19 | 6 | 89 |
| SOUTH AFRICA | 51 | 36 | 16 | 103 |
| Rivne, UKRAINE | 2 | 1 | 4 | 7 |
| Total | 245 | 244 | 342 | 831 |
The prevalence of each of the eight specific additional features for the three FAS categories is shown in Table II. For seven of the eight additional features, there was a “dose-response” relation with FAS category (p <0.05), with the children in the FAS group having the highest prevalence of each feature and those in the No FAS group having the lowest prevalence. Only “other joint contractures” showed no such association.
Table II.
Prevalence of additional features by FAS diagnostic category
| Feature | N (%) | p-value* |
|---|---|---|
| Railroad Track Ears FAS Deferred No FAS |
29 (11.8) 9 (4.1) 6 (1.8) |
<0.001 |
| Ptosis FAS Deferred No FAS |
30 (12.2) 8 (3.7) 4 (1.2) |
<0.001 |
| Heart Murmur FAS Deferred No FAS |
25 (10.2) 5 (2.3) 5 (1.5) |
<0.001 |
| Decreased elbow pronation/supination FAS Deferred No FAS |
36 (14.7) 10 (4.6) 4 (1.2) |
<0.001 |
| Incomplete extension of one or more digits FAS Deferred No FAS |
90 (36.7) 36 (16.4) 21 (6.1) |
<0.001 |
| Other joint contractures FAS Deferred No FAS |
6 (2.5) 1 (0.5) 1 (0.3) |
0.028 |
| Hockey Stick crease FAS Deferred No FAS |
53 (21.6) 19 (8.7) 18 (5.3) |
<0.001 |
| Other palmar crease abnormalities FAS Deferred No FAS |
38 (15.5) 16 (7.3) 13 (3.8) |
<0.001 |
Chi-square or Fisher’s Exact Test
As shown in Table III, sex of the child was not a significant predictor of number of additional structural defects (0, 1, ≥2) in either the FAS, Deferred or No FAS groups (p>0.05).
Table III.
Number of additional features by sex and FAS diagnostic category
| Number of Additional Features | |||||
|---|---|---|---|---|---|
| 0 | 1 | ≥2 | p-value* | ||
| FAS | Male | 39 (30.7) | 40 (31.5) | 48 (37.8) | |
| Female | 34 (28.8) | 45 (38.1) | 39 (33.0) | .538 | |
| Deferred | Male | 74 (63.2) | 28 (23.9) | 15 (12.8) | |
| Female | 72 (70.6) | 23 (22.6) | 7 (6.9) | .300 | |
| No FAS | Male | 143 (79.9) | 31 (17.3) | 5 (2.8) | |
| Female | 137 (84.0) | 22 (13.5) | 4 (2.4) | .605 | |
Pearson chi-square or Fisher’s Exact Test
As is shown in Table IV, a statistically significant difference in the number of additional features was noted in children ≥12 years of age vs. children <12 years of age in the FAS and Deferred groups but not in the No FAS group.
Table IV.
Number of additional features by age and FAS diagnostic category
| Number of Additional Features | |||||
|---|---|---|---|---|---|
| 0 | 1 | ≥2 | p-value* | ||
| FAS | <12 yrs | 49 (31.2) | 63 (40.1) | 45 (28.7) | |
| ≥12 yrs | 24 (27.3) | 22 (25.0) | 42 (47.7) | 0.008 | |
| Deferred | <12 yrs | 117 (70.9) | 38 (23.0) | 10 (6.1) | |
| ≥12 yrs | 29 (53.7) | 13 (24.1) | 12 (22.2) | 0.002 | |
| No FAS | <12 yrs | 194 (81.5) | 37 (15.6) | 7 (2.9) | |
| ≥12 yrs | 86 (82.7) | 16 (15.4) | 2 (1.9) | 0.861 | |
Pearson chi-square
Due to the requirements for minimum cell size, the comparison by race included only White and Cape Colored groups. As shown in Table V, in the FAS group, significantly more children of White race had more additional features than Cape Colored Children (p <0.05), whereas there was not a statistically significant relation between race and number of features in the Deferred and No FAS groups.
Table V.
Number of additional features by race
| Number of Additional Features | |||||
|---|---|---|---|---|---|
| 0 | 1 | ≥2 | p-value* | ||
| FAS | White | 43 (27.6) | 48 (30.8) | 65 (41.7) | |
| Cape Col | 19 (38.0) | 23 (46.0) | 8 (16.0) | 0.004 | |
| Deferred | White | 69 (60.0) | 29 (25.2) | 17 (14.8) | |
| Cape Col | 25 (73.5) | 9 (26.5) | 0 (0.0) | 0.055 | |
| No FAS | White | 178 (82.8) | 30 (14.0) | 7 (3.2) | |
| Cape Col | 14 (87.5) | 2 (12.5) | 0 (0.0) | 1.000 | |
Pearson chi-square or Fisher’s Exact Test
It is possible that for some of the additional features, particularly those that required a subjective judgement, two examiners might not agree to categorize the feature as present or absent. For 310 children in the study, two examiners evaluated the child. Interrater reliability in those cases was excellent (kappa statistic <.001). However there was not 100% concordance (data not shown). To address this issue, the data set was restricted to the 327 children seen by the same examiner (KLJ) and the analysis repeated. Results were essentially the same (data not shown).
DISCUSSION
These data document the frequency of a number of specific structural defects that have not traditionally been considered necessary for the diagnosis of FAS in a group of children diagnosed with FAS relative to those classified as Deferred or No FAS. Of the eight additional features evaluated, there was a statistically significant increase in seven of them with a “dose-response” relation documented in which the children in the FAS group had the highest prevalence of additional features and those in the No FAS had the lowest suggesting that children with the more “severe” phenotype are at increased risk for one or more specific structural defects Only “other joint contractures” lacked statistical significance.
It is important to note that Hoyme et al. analyzed a similar group of structural defects in 77 older children and adolescents with FASD in Finland [Autti-Rämö et al., 2007]. They found an increased frequency of the same structural defects as noted in this larger sample, with the exception of railroad track configuration of the ear. The data from the 77 Finnish children in that study were included in the present analysis.
It is of particular interest that four of the seven additional features that were associated with the FAS category, including decreased elbow pronation/supination, decreased finger extension, hockey stick palmar crease, and other palmar crease abnormalities, could be related to decreased fetal movement as a result of prenatal alcohol exposure’s effect on early brain development. Furthermore, the increased frequency of ptosis noted in the FAS and Deferred groups could be the result of the adverse effect of alcohol on early development of the brain.
The increased incidence of heart murmur in children in the FAS and Deferred groups in this study is expected in that cardiac defects have been documented to occur in 5% to as many as 72% of children with FASD [Burd et al., 2007]. In this study, no echocardiogram or other confirmatory tests were performed to document the prevalence of true cardiac defects.
Based on the fact that 5 of the 8 children initially described with FAS had joint anomalies (Jones et al., 1973), the lack of an increased frequency of “other joint contractures” in children with FAS or in the group designated Deferred in this study is of some surprise [Jones et al., 1973]. However, it is important to recognize that in the initial description of FAS, “other joint anomalies” was a broad category and encompassed anomalies of the palmar and interphalangeal creases, as well as decreased elbow pronation/supination and inability to completely extend the fingers. In our study, we evaluated these features individually and found all to occur more frequently in both the FAS and the Deferred groups.
Although sex of the child was not related to number of additional features in this study, the frequency of additional features varied by age at the time of examination and by race of the child in the limited subset available for this analysis. With respect to age at the time of diagnosis, greater number of additional features noted in children ≥12 years of age in both the FAS and Deferred groups is unexplained. It seems unlikely however that it is the result of factors related to normal structural changes associated with the adolescent growth spurt. It is possible, however, that this is due to some bias at some or all sites in children referred into the study at an older age who might be more likely to be more severely affected and/or to have more extensive physical features.
The significantly increased number of additional structural defects seen in children of White race compared to Cape Colored children is also unexplained. However, these data suggest that prenatal alcohol exposure might lead to a different phenotype based on age and racial background.
Limitations of this study included small sample size for selected race/ethnic groups across age groups and differences in methods for sample selection at each site. There was also variability across sites in the available information on quantity and frequency of prenatal alcohol exposure. In addition, there could be some diagnostic suspicion bias on the part of examiners who may have been more likely to recognize one or more additional features if the child being examined already exhibited some or all of the key features of FAS. However, the study included a highly structured and systematic method for conducting these examinations across all sites, and examiners were all highly experienced in differentiating these subtle features. Other strengths of this study include the cross-cultural nature of the sample, and the unprecedented number of children with FAS or some features of FAS who were examined in a standard fashion.
A better understanding of the prevalence of these additional structural defects will be important in documenting the full spectrum of physical features that constitute FAS. This can contribute to a better understanding of the developmental pathogenesis of the disorder, while at the same time aid the practicing clinician in appreciating the breadth of features that might indicate that a patient has been affected by alcohol.
ACKNOWLEDGMENTS
This study was funded by a grant from the National Institute on Alcohol Abuse and Alcoholism; Grant Number: 2U24AA014815-05
REFERENCES
- Astley SJ, Clarren SK. Diagnosing the full spectrum of fetal-exposed individuals: introducing the 4-digit diagnostic code. Alcohol Alcohol. 2000;35:400–410. doi: 10.1093/alcalc/35.4.400. [DOI] [PubMed] [Google Scholar]
- Autti-Rämö I, Fagerlund A, Ervalahti N, Loimu L, Korkman M, Hoyme HE. Fetal alcohol spectrum disorders in Finland: clinical delineation of 77 older children and adolescents. Am J Med Genet. 2007;140A:137–143. doi: 10.1002/ajmg.a.31037. [DOI] [PubMed] [Google Scholar]
- Burd L, Deal E, Rios R, Adickes E, Wynne J, Klugg M. Congenital heart defects and fetal alcohol spectrum disorders. Congenit Heart Dis. 2007;2:250–255. doi: 10.1111/j.1747-0803.2007.00105.x. [DOI] [PubMed] [Google Scholar]
- Chudley A, Conry J, Cook J, Loock C, Rosales T, LeBlanc N. Fetal alcohol spectrum disorder: Canadian guidelines for diagnosis. CMAJ. 2005;172:S1–S21. doi: 10.1503/cmaj.1040302. [DOI] [PMC free article] [PubMed] [Google Scholar]
- Hoyme HE, May PA, Kalberg WO, Kodituwakku P, Gossage JP, Trujillo PM, Buckley DG, Miller JH, Aragon AS, Khaole N, Viljoen DL, Jones KL, Robinson LK. A practical clinical approach to diagnosis of fetal alcohol spectrum disorders: clarification of the 1996 institute of medicine criteria. Pediatrics. 2005;115:39–47. doi: 10.1542/peds.2004-0259. [DOI] [PMC free article] [PubMed] [Google Scholar]
- Jones KL, Smith DW, Ulleland CN, Streissguth AP. Pattern of malformation in offspring of alcoholic women. Lancet. 1973;1:1267–1271. doi: 10.1016/s0140-6736(73)91291-9. [DOI] [PubMed] [Google Scholar]
- Lemoine P, Harrouseau H, Borteyru JP, Menuet J. Les enfants de parents alcoholiques : anomalies observees a propos de 127 cas. Ouest Med. 1968;8:476–482. [Google Scholar]
- Stratton KR, Howe CJ, Battaglia FC, editors. Fetal Alcohol Syndrome: Diagnosis, Epidemiology, Prevention and Treatment. Washington, DC: National Academy Press; 1996. [Google Scholar]