

Abstract
Mitochondrial (mt) genes and genomes are among the major sources of data for evolutionary studies in birds. This places mitogenomic studies in birds at the core of intense debates in avian evolutionary biology. Indeed, complete mt genomes are actively been used to unveil the phylogenetic relationships among major orders, whereas single genes (e.g., cytochrome c oxidase I [COX1]) are considered standard for species identification and defining species boundaries (DNA barcoding). In this investigation, we study the time of origin and evolutionary relationships among Neoaves orders using complete mt genomes. First, we were able to solve polytomies previously observed at the deep nodes of the Neoaves phylogeny by analyzing 80 mt genomes, including 17 new sequences reported in this investigation. As an example, we found evidence indicating that columbiforms and charadriforms are sister groups. Overall, our analyses indicate that by improving the taxonomic sampling, complete mt genomes can solve the evolutionary relationships among major bird groups. Second, we used our phylogenetic hypotheses to estimate the time of origin of major avian orders as a way to test if their diversification took place prior to the Cretaceous/Tertiary (K/T) boundary. Such timetrees were estimated using several molecular dating approaches and conservative calibration points. Whereas we found time estimates slightly younger than those reported by others, most of the major orders originated prior to the K/T boundary. Finally, we used our timetrees to estimate the rate of evolution of each mt gene. We found great variation on the mutation rates among mt genes and within different bird groups. COX1 was the gene with less variation among Neoaves orders and the one with the least amount of rate heterogeneity across lineages. Such findings support the choice of COX 1 among mt genes as target for developing DNA barcoding approaches in birds.
Keywords: avian origins, barcoding, mitochondrial genomes, mitogenomics, molecular clock, phylogeny
Introduction
Timing the radiation of modern birds (Neornithes) and assessing the evolutionary relationships among major orders are still controversial issues in avian biology. Feduccia (1995, 2003) proposed that birds underwent a mass extinction where most avian lineages disappeared in the Cretaceous period. That mass extinction was followed by an “explosive adaptive radiation” of the extant orders, from one or a small number of surviving lineages, in the Cenozoic period. Although such adaptive radiation implies that extensive morphological changes took place over relatively short periods of time, proponents of this hypothesis do not provide viable genetic mechanisms for those changes. The main line of evidence supporting this hypothesis is the lack of fossils prior to the Cretaceous/Tertiary (K/T) boundary (Dyke et al. 2002; Slack et al. 2006), although recent findings (Clarke et al. 2005) indicate several basal lineages in the late Cretaceous.
An alternative hypothesis is that major avian orders diversified prior to the K/T boundary, around 100 Ma. This “pre K/T radiation hypothesis” relies on time estimates from molecular dating (Cooper and Penny 1997; Kumar and Hedges 1998; Van Tuinen and Hedges 2001; Slack et al. 2006; Brown et al. 2007). A major challenge for this hypothesis is, precisely, the absence of fossil evidence supporting such timeframes. Molecular clock proponents suggest, however, that gaps in the fossil record can be explained by the scarcity of Late Cretaceous fossil horizons and by a geographical bias in the sampling that has focused in North America and Eurasia with limited information from southern continents (Cooper and Penny 1997). Nevertheless, molecular dating approaches are affected by the limited number of good fossils that can be used as calibration points (Ericson et al. 2006; Brown et al. 2008; Mayr 2009).
The controversy around the timing of the origin of modern birds is deepened by the lack of reliable phylogenetic hypotheses solving the evolutionary relationships among major Neoaves orders. Indeed, the basal polytomies observed in various phylogenetic studies are considered evidence for the post K/T explosive radiation hypothesis (Feduccia 2003; Cracraft et al. 2004; Poe and Chubb 2004). Unfortunately, resolving the relationships among higher taxa, those that have been accorded the taxonomic rank of “order,” has been both problematic and controversial (Sibley and Ahlquist 1990; Mindell et al. 1997; van Tuinen et al. 2000; Hackett et al. 2008; Pratt et al. 2009). Thus far, only two nodes at the base of the avian tree are consistently supported by both molecular and morphological evidence. The first divides the paleognathae (ratites and tinamous) and neognathae, and the second splits the neognaths between the galloanserae and Neoaves (García-Moreno et al. 2003; Sorenson et al. 2003; Harrison et al. 2004; Livezey and Zusi 2007; Slack et al. 2007). The monophyly of some groups with worldwide distribution has been well established (e.g., loons, grebes, penguins, parrots, cuckoos, and passeriforms). However, there are major orders that are paraphyletic (e.g., pelicaniforms, ciconiiforms, and caprimulgiforms), whereas the monophyletic status of others remains uncertain (e.g., gruiforms, coraciiforms, piciforms, and falconiforms) (Cracraft et al. 2004). In addition, the evolutionary relationships of several orders within the Neoaves phylogeny (e.g., parrots, columbiforms, coraciiforms, and cuculiforms) are still unsolved (Cracraft et al. 2004; Livezey and Zusi 2007).
Nevertheless, considerable progress has been made by using complete mitochondrial (mtDNA) genomes. It appears that the basal polytomy found in most phylogenetic hypotheses proposed for Neoaves could be ascertained by using complete mtDNA genomes and improving the phylogenetic signal via increasing the taxon sampling (Sorenson et al. 2003; Harrison et al. 2004; Pereira and Baker 2006; Gibb et al. 2007; Slack et al. 2007; Morgan-Richards et al. 2008; Pratt et al. 2009). Although mt genes are only one of the available sources of data used to investigate evolutionary relationships, phylogenies derived from complete mtDNA genomes have shown to be congruent with those derived from nuclear genes when appropriate sampling of taxa and analysis are used (Arnason et al. 2002; Reyes et al. 2004; Kjer and Honeycutt 2007). Indeed, complete mtDNA genomes have been successfully used in studies directed to solve the origin and radiation of mammals (Arnason et al. 2002; Reyes et al. 2004; Kjer and Honeycut 2007). A reliable phylogenetic hypothesis will provide better time estimates on the origin of several neoaves groups and, by so doing, will allow assessing how many of those originated prior to the K/T boundary. In addition, timetrees based on more reliable phylogenetic hypotheses will improve estimates of the rate of evolution for the mt genome within major avian groups. Such rates are important given the growing interest on using short sequences of mt genes (e.g., the cytochrome c oxidase I or COX1) to generate DNA barcodes linked to named specimens as a proxy for species identification (Hebert et al. 2004). Although such approaches are far from being widely accepted (Rubinoff et al. 2006), estimates of the rate of evolution are needed for assessing the sample size required for generating reliable DNA barcodes for species identification (Tavares and Baker 2008; Zhang et al. 2010).
In this investigation, we first focused on solving some of the polytomies observed at the deep nodes of the Neoaves phylogeny. We analyzed the largest avian data set of complete mtDNA genomes included so far in a single study (80 mtDNA, with 73 from Neoaves including 17 new genomes reported in this investigation). Then, we used this phylogenetic hypothesis to test whether the diversification of major avian orders took place prior to the K/T boundary by using several molecular dating methods. Finally, we discuss the variation of the rate of evolution among mt genes and their fit to a “clock-like” behavior. Overall, we were able to solve some deep nodes in the Neoaves phylogeny. Our findings support the notion that the polytomy at the base of the Neoaves tree can be solved by increasing the quality and quantity of the data in terms of taxa and number of base pairs available. Whereas some of our time estimates are younger than those reported by others, we found that most of the major orders originated prior to the K/T boundary. We found great variation on the mutation rates among mt genes; however, COX1 is the gene that shows the least amount of rate heterogeneity and variance among Neoaves orders. Such findings further support the use of COX1 for DNA barcoding approaches in birds.
Materials and Methods
Taxon Sampling and DNA Extraction
We report 17 new, complete or nearly complete, mtDNA genomes from Columbiformes (doves and pigeons, seven species), Psittaciformes (three new world parrots and a cockatoo), Coraciiformes (three species), Cuculiformes (two species), and Caprimulgiformes (one species). We include New and Old world taxa; their common and scientific names as well as sample numbers (museum or animal number) and accession numbers of the reported sequences are listed below. The Phelps Ornithological Collection (Caracas, Venezuela) provided tissue samples of white-tipped dove (Leptotila verreauxi, sample: ML795, GenBank accession number: HM640214), eared dove (Zenaida auriculata, ML840, HM640211), violaceous quail-dove (Geotrygon violacea, IC1166, HM640213), tambourine dove (Turtur tympanistria, JEM60, HM746793), emerald dove (Chalcophaps indica, JEM68, HM746789), zebra dove (Geopelia striata, JEM72, HM746791), luzon bleeding-heart (Gallicolumba luzonica, JEM65, HM746790), dusky-billed parrotlet (Forpus modestus, ML672, HM755882), cobalt-winged parakeet (Brotogeris cyanoptera, ML675, HM627323), brown-throated parakeet (Aratinga pertinax chrysogenys, ML683, HM640208), cockatiel (Nymphicus hollandicus, JEM80, HM640215), smooth-billed ani (Crotophaga ani, IC57, HM746794), and the common potoo (Nyctibius griseus, IC557, HM746792). Blood samples of African ground hornbill (Bucorvus leadbeateri, K1A004, HM640209) and the silvery-cheeked hornbill (Bycanistes brevis, K4A0022, HM640210) were made available by the Tautphaus Park Zoo (Idaho Falls, USA). A sample of a wrinkled hornbill (Aceros corrugatus, 15373, HM755883) was provided by the Tulsa Zoo and Living Museum (Tulsa, USA). Finally, the blood sample of Greater Roadrunner (Geococcyx californianus, 08-0062, HM640212) was supplied from (Liberty Wildlife Rehabilitation Foundation, Arizona, USA). Total genomic DNA was extracted from tissue and blood using Qiagen DNeasy Blood and Tissue Kit (Qiagen GmbH, Hilden, Germany) according to the manufacturer's instructions.
PCR Amplification and Sequencing
The complete mtDNA genomes were amplified using TaKaRa LA Taq DNA Polymerase (TaKaRa Takara Mirus Bio). In order to minimize the chance of obtaining nuclear copies of mt genes, six primer sets were designed to amplify long, contiguous, and overlapping segments of approximately 3.5 kb in length (table 1). The polymerase chain reaction (PCR) conditions for amplifying were: a partial denaturation at 94 °C for 1 min and 30 cycles of 94 °C for 30 s and 62–64 °C for 4 min and one cycle at 72 °C for 10 min. The PCR products were excised from 0.9% agarose gels and purified using a QIAquick Gel extraction kit (Qiagen GmbH, Hilden, Germany). The purified fragments were directly sequenced using an Applied Biosystems 3730 capillary sequencer. Where necessary, PCR products were cloned in the pGEM-T Easy Vector Systems I from Promega (Madison, WI) and at least three clones were sequenced for each region from two independent PCR reactions. In all cases, overlaps between fragments were sufficient to ensure homology (≥200 bp). Sequence identity for each gene separately was confirmed by Blast searches at the National Center for Biotechnology Information database (NCBI). Confirmation was further performed by obtaining the amino acid translation in coding regions and generating alignments for each gene against orthologs deposited in GenBank.
Table 1.
Primer Pairs Use for the PCR Amplification of Avian mtDNA Genomes.
| Primer Code | Primer Sequence (5′ to 3′) |
|
| Forward | Reverse | |
| AE228–231 | AGGGTTCGTTTGTTCAACG | GTTAGGCTGTAGTCCTTTTTAC |
| AE232–237 | GCCTTCAAAGCCTTARACAAG | CTGCDGTRAGGTTTGCTG |
| AE238–243 | CACARCTATCAATRAACATAGC | TTACTTGGAYTTGCACCAAG |
| AE244–251 | ATACTAMYARCAACCCAACG | CCAGCTTTGGGAGTTGGTG |
| AE252–253 | ATMYCCAACTCCCAAAGCTG | GAGCTTGTACGTGGTTTGTC |
| AE255–259 | GACAAAAGACTTAGTCCTAACC | AAGGGCTTAAGCCTTTTGC |
Sequences and Phylogenetic Analysis
In addition to the 17 new avian mtDNA sequences reported in this study, 63 other mtDNA genomes were included in our analyses (9 Galloanserae and 54 Neoaves). Supplementary table S1, Supplementary Material online, provides the NCBI accession numbers for all the sequences used in this investigation and the geographic distribution of the available taxa. Notice that limited effort has been made in sequencing species from the New World. Sequences were aligned using ClustalX Version 2.0.12 with manual editing. The NADH dehydrogenase 6 (NADH6), the control region (CR), and stop codons (often incomplete in the DNA sequence) were excluded from these alignments because of their heterogeneous base composition and poor phylogenetic performance (Zardoya and Meyer 1996s; Miya and Nishida 2000). Thus, the full alignments analyzed were 13,685 bp in length excluding gaps.
We rooted our Neoaves phylogenies by using the genomes from nine Galloanserae species (see supplementary table S1, Supplementary Material online). We performed phylogenetic analyses either including or excluding the outgroup. Paleognath taxa were not included in this study because the paleo/neognath division has been well established for mt genomes (Gibb et al. 2007; Slack et al. 2007). We performed three series of phylogenetic analyses for Neoaves considering different data partitions. The first series of analyses was similar to those reported by previous studies (e.g., Pratt et al. 2009), and the alignment considered five partitions: 1) first and second-codon position of the 12 protein-coding genes together, 2) third-codon position of the protein-coding genes (RY coding), 3) 19 transfer RNAs (tRNAs) together, and 4) and 5) 2 ribosomal RNAs (rRNA) individually. We used the standard RY coding for the third-codon position of the protein-coding genes because it has been reported as advantageous. RY coding pools purines (A and G coded as R) and pyrimidines (C and T coded as Y) into two-state categories (R,Y). The RY coding of the most variable partitions of the nucleotide data (specifically third-codon position) increases the proportions of observable changes on internal branches of the tree and decreases the differences in nucleotide composition in both nuclear and mt genes (Honeycutt and Adkins 1993; Delsuc et al. 2003; Phillips and Penny 2003; Phillips et al. 2006; Hackett et al. 2008; Sims et al. 2009).
In the second series of phylogenetic analyses, we consider six data partitions by dividing the 12 protein-coding genes into three categories using the mutation rate in percent per million years reported by Pereira and Baker (2006): category 1 = mutation rate > 0.580 includes cytochrome c oxidase subunit I (COX1) and II (COX2), cytochrome b (CYTB), and NADH dehydrogenase subunit I (ND1); category 2 = mutation rates less than 0.580 but higher than 0.300 that includes ATP synthase FO subunit 6 (ATP6), cytochrome c oxidase subunit III (COX3), NADH dehydrogenase subunits 2, 4, and 5 (ND2, ND4, and ND5 respectively); and category 3 = mutation rate < 0.300 that includes ATP synthase FO subunit 8 (ATP8), NADH dehydrogenase subunits 3 and 4L (ND3 and ND4L respectively). All the 19 tRNAs together, the 16S, and 23S rRNAs formed the remaining three partitions. Such partitions lead to different parameters among partitions, but they do not appear to affect the tree topology in any meaningful way. In the last series of analyses, the alignment considered 15 partitions: 1–12 are each protein-coding gene one by one starting with ND1 following the gene order in the mt genome, partition 13 includes 19 tRNAs together, and partitions 14 and 15 are the 2 rRNAS (12S and 16S), respectively.
A Bayesian analysis was carried out using MrBayes (Huelsenbeck and Ronquist 2001). Posterior distributions were obtained by Markov Chain Monte Carlo analyses with number of generations variable (20–23 millions generations) upon attainment of convergence. Maximum likelihood (ML) analyses were performed by determining the best fit model (general time reversible [GTR] + gamma + I) using MEGA 4 (Tamura et al. 2007) and then estimating the phylogenies (with and without outgroup) using the method implemented in PhyML 3.0 (Guindon and Gascuel 2003) that combines the nearest neighbor interchanges and Subtree Pruning and Regrafting algorithms, so called “BEST” option (Guindon et al. 2010). Support of the data internal branches was carried out using two methods, an approximate likelihood-ratio test (Anisimova and Gascuel 2006; Guindon et al. 2010) and bootstrap with 200 pseudoreplications. Overall, we found that ML and Bayesian phylogenies were consistent and only the Bayesian analyses are reported; however, we discuss specific cases where the ML analyses differ from the Bayesian analyses.
Timetrees
The Bayesian phylogeny obtained was then used in molecular clock analyses with three relaxed clock methods, MultiDivTime (MDT), BEAST (v 1.4.8), and r8s (Sanderson 2002; Thorne and Kishino 2002; Drummond and Rambaut 2007). The first two approaches are Bayesian, whereas the third one is a ML method. For MDT, transition/transversion ratio and the among-site rate variation were estimated with the program PAML (Yang 2007) for each partition separately. Branch lengths were estimated with the Felsenstein 84 (F84) model plus gamma. Parameters for the time estimation were as follows: prior on the ingroup root node (rttm), 97 My (van Tuinen 2009); mean of the prior for the autocorrelation parameter and its standard deviation (SD) (brownmean and brownsd), 0.015; the absolute maximum boundary for any node in the phylogeny (bigtime), 200 My; number of generations: 1,000,000, sampled every 100, with a burn-in of 100,000. The prior of the rate at the root node and its SD (rtrate and rtratesd) were calculated specifically for each partition from the median of the root-to-tip distances.
Partitions were analyzed separately also in BEAST, using a GTR + gamma + I model for each one of them. Therefore, the evolutionary parameters were optimized for each partition, but the phylogeny was maintained identical to that obtained by MrBayes. Results of eight independent runs of 80 million generations each were combined for a total of 504,056,000 generations after a burn-in of approximately 20%. This produced the suggested effective sample sizes (ESS) above 200 for 94% of the parameters. The remaining 6% had ESS values between 132 and 197. A Yule prior was used for the speciation model and Jeffreys priors for the GTR model parameters. Priors for the calibrations are discussed below. Lastly, a ML method was also used, r8s, with the phylogeny and branch lengths obtained by MrBayes. This method uses a penalized likelihood model, which favors small gradual changes in rates of evolution among lineages (autocorrelation), similar to the assumption made in MDT (BEAST, instead, assumes uncorrelated rates). The autocorrelation is expressed in terms of a “smoothing” factor, which was optimized via the cross-validation procedure (between 1 and 7900, optimal 6.3). Confidence intervals for r8s could not be obtained due to the lack of convergence of the subsamples.
In all methods, we used three calibration points, two well-recognized fossils and a geological event. The first calibration point is a minimum of 62 My provided by the fossils of two species of early penguins (genus Waimanu) dated between 61 and 63 My, which have been found in North Canterbury, New Zealand (Slack et al. 2006). The second is a minimum of 54 My from two fossils of psittaciforms from the Lower Eocene “Mo Clay” (Fur Formation) of Denmark (Waterhouse et al. 2008). The third point is a maximum of 85 My that corresponds to the early separation of New Zealand from Australia/Antartica (Cooper and Millener 1993). Such maximum has been proposed for the divergence of Passerines (Ericson et al. 2002). It is worth noting that this maximum did not affect our time estimates when removed. In the case of BEAST, in addition to the calibration points previously described, we used 66 My as a minimum for Anseriforms based on the fossil of Vegavis iaai from Vega Island, western Antarctica (Clarke et al. 2005). Contrary to MDT, which uses a uniform prior distribution for the calibrations, in BEAST, we used an exponential distribution with the 95% probability area included within the minimum and maximum boundaries used also for MDT (the minima correspond to the fossils, the maxima are equal to bigtime). This distribution reflects the confidence in the quality of the fossil record with an increased probability of the genetic divergence being closer to the minimum bound. It is also a conservative approach that could bias the estimated times toward younger divergences rather than older ones. However, it does not exclude less conservative hypothesis (i.e., older genetic divergence) because the probability distributions considered are wide (maximum = 200 My) and because the maxima are used as soft bounds (Yang and Rannala 2006). The oldest divergence within the Passeriformes used a uniform prior between 0–85 My because this is the most conservative option when using a maximum bound.
Results and Discussion
Of the 17 new mtDNA genomes, 9 were complete and 8 partial (table 2). These partial sequences lack the region between ND6 and the CR; nevertheless, this region was not considered in our phylogenetic analyses. Table 2 describes the complete and partial mt genomes reported in this investigation. We report the gene sizes and start/stop codons for the 12 coding genes included in our alignments. In all but one complete mtDNA genomes, we found the gene arrangement previously reported for Gallus gallus, ND5 → Cytb → tRNA-Thr → tRNA-Pro → ND6 → tRNA-Glu → CR → tRNA-Phe → 12S rRNA. In the cases of the roadrunner, we found the same pattern previously reported for Falcon: ND5 → Cytb → tRNA-Thr → CR(1) → tRNA-Pro → ND6 → tRNA-Glu → CR(2) → tRNA-Phe → 12S rRNA (Mindell et al. 1998; Pratt et al. 2009). We partitioned the data in multiple ways and recovered phylogenetically similar results. We, therefore, discuss in detail only the phylogenetic hypotheses recovered from the series of analyses that considered 15 partitions, one for each protein-coding gene, one for the tRNAs, and two for 12S and 16S RNA (fig. 1). Because this partition allows the optimization of parameters for each protein-coding gene specifically, which better accommodates their variable evolutionary rates; it was also chosen for the timing analyses and the estimation of rates of evolution.
Table 2.
Description of the mtDNA Genomes Reported in this Investigation.
| ND1 (bases/aa) | ND2 (bases/aa) | COX1 (bases/aa) | COX2 (bases/aa) | ATP8 (bases/aa) | ATP6 (bases/aa) | COX3 (bases/aa) | ND3 (bases/aa) | ND4L (bases/aa) | ND4 (bases/aa) | ND5 (bases/aa) | Cytb (bases/aa) | ND6 (bases/aa) | ||
| Species | mtDNA Length (bp) | Start/Stop Codon | Start/Stop Codon | Start/Stop Codon | Start/Stop Codon | Start/Stop Codon | Start/Stop Codon | Start/Stop Codon | Start/Stop Codon | Start/Stop Codon | Start/Stop Codon | Start/Stop Codon | Start/Stop Codon | Start/Stop Codon |
| Gallicolumba luzonica | 15,192 (partial) | 963/321 ATG/AGA | 1038/346 ATG/T-- | 1548/516 GTG/AGG | 678/226 ATG/TAA | 165/55 ATG/TA- | 681/227 ATG/TA- | 783/261 ATG/T-- | 348/116 ATA/TA- | 294/98 ATG/TAA | 1377/459 ATG/T-- | 1815/605 ATG/AGA | 1140/380 ATG/TA- | incomplete |
| Geopelia striata | 15,859 (partial) | 963/321 ATG/AGA | 1038/346 ATG/T-- | 1548/516 GTG/AGG | 681/227 ATG/TAA | 165/55 ATG/TA- | 681/227 ATG/TA- | 783/261 ATG/T-- | 348/116 ATA/TA- | 294/98 ATG/TAA | 1374/458 ATG/T-- | 1815/605 ATG/AGA | 1140/380 ATG/TAA | 519/173 ATG/TAG |
| Chalcophaps indica | 15,363 (partial) | 963/321 ATG/AGA | 1038/346 ATG/T-- | 1548/516 GTG AGG | 681/227 ATG/TAA | 165/55 ATG/TA- | 681/227 ATG/TA- | 783/261 ATG/T-- | 348/116 ATA/TA- | 294/98 ATG/TAA | 1377/459 ATG/T-- | 1812/604 GTG/AGA | 1140/380 ATG/TAA | incomplete |
| Turtur tympanistria | 15,557 (partial) | 963/321 ATG/AGA | 1038/346 ATG/T-- | 1548/516 GTG/AGG | 681/227 ATG/TAA | 165/55 ATG/TA- | 681/227 ATG/TA- | 783/261 ATG/T-- | 348/116 ATT/TA- | 294/98 ATG/TAA | 1377/459 ATG/T-- | 1815/605 GTG/AGG | 1140/380 ATG/TAA | 519/173 ATG/TAG |
| Geotrygon violacea | 16,864 | 963/321 ATG/AGA | 1038/346 ATG/T-- | 1548/516 GTG/AGG | 681/227 ATG/TAA | 165/55 ATG/TA- | 681/227 ATG/TA- | 783/261 ATG/T-- | 348/116 ATC/TA- | 294/98 ATG/TAA | 1377/459 ATG/T-- | 1815/605 ATG/AGA | 1140/380 ATG/TAA | 519/173 ATG/TAG |
| Zenaida auriculata | 16,781 | 963/321 ATG/AGA | 1038/346 ATG/T-- | 1548/516 GTG/AGG | 681/227 ATG/TAA | 165/55 ATG/TA- | 681/227 ATG/TA- | 783/261 ATG/T-- | 348/116 ATT/TA- | 294/98 ATG/TAA | 1377/459 ATG/T-- | 1815/605 ATG/AGA | 1140/380 ATG/TAA | 516/172 ATG/TAG |
| Leptotila verreauxi | 17,176 | 963/321 ATG/AGA | 1038/346 ATG/T-- | 1548/516 GTG/AGG | 681/227 ATG/TAA | 165/55 ATG/TA- | 681/227 ATG/TA- | 783/261 ATG/T-- | 348/116 ATC/TA- | 294/98 ATG/TAA | 1377/459 ATG/T-- | 1815/605 ATG/AGA | 1140/380 ATG/TAA | 519/173 ATG/TAG |
| Nyctibius griseus | 14,769 (partial) | 975/325 GTG/A-- | 1038/346 ATG/T-- | 1548/516 GTG/AGG | 681/227 ATG/TAA | 165/55 ATG/TA- | 681/227 ATG/TA- | 783/261 ATG/T-- | 348/116 ATC/TA- | 294/98 ATG/TAA | 1377/459 ATG/T-- | 1815/605 ATG/TAA | 1140/380 ATG/TAA | incomplete |
| Geococcyx californianus | 17,651 | 978/326 ATG/TAA | 1038/346 ATG/T-- | 1548/516 GTG/AGG | 681/227 ATG/TAA | 162/54 ATG/TA- | 681/227 ATG/TA- | 783/261 ATG/T-- | 348/116 ATA/T-- | 294/98 ATG/TAA | 1377/459 ATG/T-- | 1815/605 ATG/AGA | 1140/380 ATG/TAA | 519/173 ATG/TAG |
| Crotophaga ani | 15,774 (partial) | 975/325 ATG/AGA | 1038/346 ATG/T-- | 1548/516 GTG/AGG | 681/227 ATG/TAA | 165/55 ATG/TA- | 681/227 ATG/TA- | 783/261 ATG/T-- | 348/116 ATC/TA- | 294/98 ATG/TAA | 1377/459 ATG/T-- | 1812/604 ATG/AGA | 1140/380 ATG/TAA | 519/173 ATG/AG- |
| Forpus modestus | 14,849 (partial) | 978/326 ATG/A-- | 1038/346 ATG/TA- | 1545/515 GTG/AGG | 681/227 ATG/TAA | 165/55 ATG/TA- | 681/227 ATG/TA- | 783/261 ATG/T-- | 348/116 ATC/TA- | 294/98 ATG/TAA | 1392/464 ATG/T-- | 1815/605 GTG/TAA | 1137/379 ATG/TAA | incomplete |
| Brotogeriscyanoptera | 17,369 | 978/326 ATG/A-- | 1038/346 ATG/TA- | 1545/515 GTG/AGG | 681/227 ATG/TAA | 165/55 ATG/TA- | 681/227 ATG/TA- | 783/261 ATG/T-- | 348/116 ATA/TA- | 294/98 ATG/TAA | 1392/464 ATG/T-- | 1812/604 GTG/TAA | 1134/378 ATG/TAA | 501/167 ATG/AG- |
| Aratinga pertinax | 16,980 | 978/326 ATG/A-- | 1038/346 ATG/TA- | 1545/515 GTG/AGG | 681/227 ATG/TAA | 165/55 ATG/TA- | 681/227 ATG/TA- | 783/261 ATG/T-- | 348/116 ATA/TA- | 294/98 ATG/TAA | 1392/464 ATG/T-- | 1812/604 GTG/TAA | 1137/379 ATG/TAA | 510/170 ATG/AG- |
| Nymphicus hollandicus | 16,781 | 978/326 ATG/A-- | 1038/346 ATG/TA- | 1545/515 GTG/AGG | 681/227 ATG/TAA | 165/55 ATG/TA- | 681/227 ATG/TA- | 783/261 ATG/T-- | 348/116 ATA/TA- | 294/98 ATG/TAA | 1392/464 ATG/T-- | 1812/604 ATG/TAA | 1137/379 ATG/TAA | 513/171 ATG/AG- |
| Bucorvus leadbeateri | 17,061 | 975/325 ATG/A--- | 1038/346 ATG/T-- | 1548/516 GTG/AGG | 681/227 ATG/TAA | 165/55 ATG/TA- | 681/227 ATG/TA- | 783/261 ATG/T-- | 348/116 ATT/TA- | 294/98 ATG/TAA | 1377/459 ATG/T-- | 1812/604 ATG/AGA | 1140/380 ATG/TAA | 519/173 ATG/AG- |
| Bycanistes brevis | 17,591 | 975/325 ATG/A-- | 1038/346 ATG/TA- | 1548/516 GTG/AGG | 681/227 GTG/TAA | 165/55 ATG/TA- | 681/227 ATG/TA- | 783/261 ATG/T-- | 348/116 ATC/TA- | 294/98 ATG/TAA | 1377/459 ATG/T-- | 1812/604 GTG/AGA | 1140/380 ATG/TAA | 519/173 ATG/AG- |
| Aceros corrugatus | 16,150 (partial) | 975/325 ATG/A-- | 1038/346 ATG/TA- | 1548/516 GTG/AGG | 681/227 GTG/TAA | 162/54 ATG/TA- | 681/227 ATG/TA- | 783/261 ATG/T-- | 348/116 ATC/TA- | 294/98 ATG/TAA | 1377/459 ATG/T-- | 1809/603 ATG/AGA | 1140/380 ATG/TAG | 519/173 ATG/TA- |
NOTE.—Start and stop codons are indicated for each sequence.
FIG. 1.
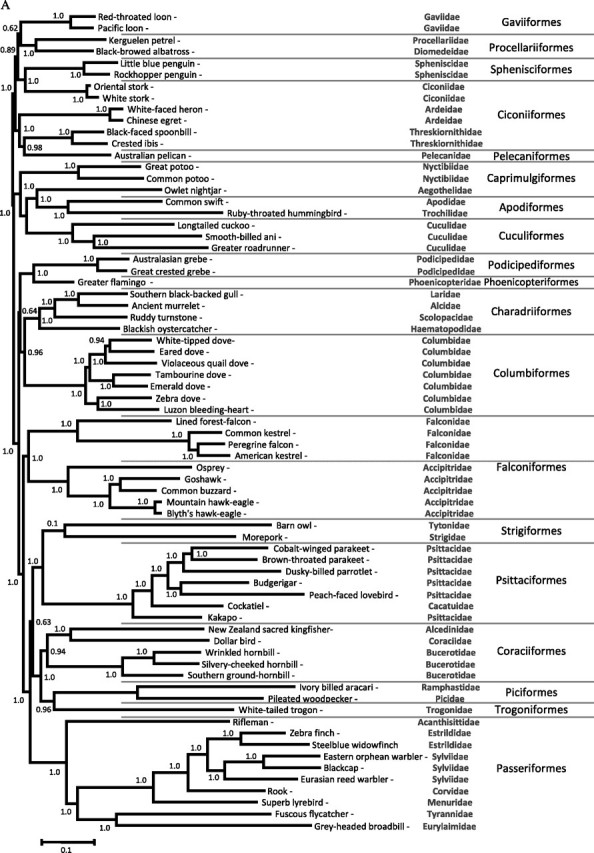
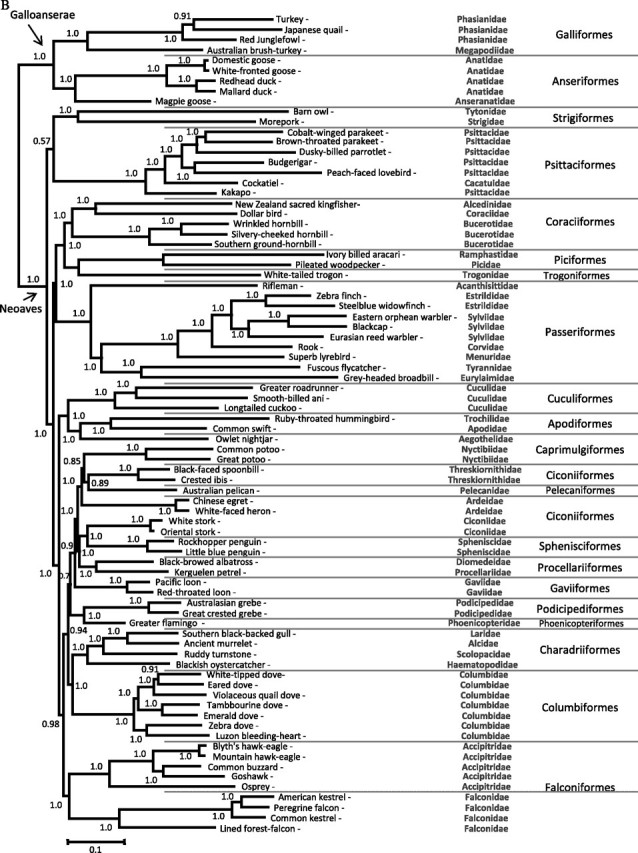
Phylogenetic hypotheses derived from MrBayes using a GTR + gamma + I using the 15 partitions analysis. Hypothesis A, unrooted tree estimated using 23 × 106 generations sampled every 100 steps. Posterior probabilities were calculated on 90,000 trees discarding 60% of the sampled phylogenies (140,000) as burn-in. Hypothesis B, rooted tree estimated by using 20 × 106 generations discarding 60% of the sampled phylogenies (120,000) as burn-in.
Unrooted Tree
Independently of the data partition used, our unrooted trees recovered several well-supported clades with a posterior probability of 1.0. Overall, the clades recovered were consistent with previous investigations reporting phylogenies using nuclear or mt genes on data sets that used fewer base pairs or that were taxonomically biased toward a specific order. One of those clades that is consistently recovered includes many of the “water bird” orders, in particular, seabirds (Procellariiformes); loons (Gaviiformes); penguins (Sphenisciformes); storks, herons, and allies (Ciconiiformes); and pelicans (Pelecaniformes) (fig. 1A). Our phylogeny confirms that Gaviiformes and Procellariiformes are sister group and share a common ancestor with Sphenisciformes; all of them are monophyletic. We also find that Ciconiiformes are paraphyletic with storks (Ciconiidae) and penguins being sister taxa (Cracraft et al. 2004; Harrison et al. 2004; Ericson et al. 2006; Watanabe et al. 2006; Slack et al. 2007; Brown et al. 2008; Hackett et al. 2008).
Our Bayesian analyses found that Caprimulgiformes, Apodiformes, and Cuculiformes are part of a clade, with a posterior probability of 1.0, with Cuculiformes and Apodiformes sharing a common ancestor with Caprimulgiformes (fig. 1A). Our ML analyses also supported this Cuculiformes–Apodiformes clade (63%); however, the monophyly with the Nyctibiidae (Caprimulgiformes) lacks support. The discrepancy between these two analyses is explained by the fact that Caprimulgiformes are paraphyletic, a result consistent with previous morphological and molecular studies using both nuclear and mt genes (Cracraft et al. 2004; Ericson et al. 2006; Livezey and Zusi 2007; Brown et al. 2008; Hackett et al. 2008). In the case of cuculiforms, their possible relationship with other orders has been difficult to support (Cracraft et al. 2004; Pratt et al. 2009); thus, even when we recovered this clade using Bayesian and ML methods, we prefer to consider the cuculiform–apodiform clade as “unsolved” until more apodiforms sequences become available and provide additional evidence.
The phylogenetic relationships of columbiforms with other Neoaves have been notoriously difficult to assess, using both molecular and morphological data (Cracraft et al. 2004; Livezey and Zusi 2007). We confirmed that shorebirds (Charadriiformes) and doves/pigeons (Columbiformes) are monophyletic groups and recovered a clade that place them as sister taxa (posterior probability of 0.94–1.0), with grebes (Podicipediformes) and flamingos (Phoenicopteriformes) as the next closely related clade (fig. 1A). Although the possibility of shorebird and pigeons being sister taxa has been previously considered Sibley and Ahlquist 1990; Shapiro et al. 2002; Pereira et al. 2007), this appears to be the first molecular evidence in support of this relationship using complete mtDNA genomes. It is worth noting that shorebirds and flamingos appeared as sister groups in other studies where Columbiformes were not included (Morgan-Richards et al. 2008). Our results also support the recently suggested Podicipediformes–Phoenicopteriformes clade (van Tuinen et al. 2001; Cracraft et al. 2004; Mayr 2004; Ericson et al. 2006).
Overall, our phylogeny recovers similar relationships within Columbiformes than those recovered by others using 9,000 bp; those studies included nuclear and mt genes as well as a more comprehensive taxonomic sampling. Similarly, within Charadriiformes, we found a clade including Laridae, Alcidae, and Scolopacidae with an early divergence of Haematopodidae (Charadrii) (fig. 1A), which is in agreement with previous studies using nuclear data (Ericson et al. 2003; Paton et al. 2003) and mtDNA genomes (Slack et al. 2007).
We always found Falconiformes (hawks and eagles) as a monoplyletic group with two well-separated clades: Accipitridae and Falconidae families (fig. 1A). This result contrasts with previous studies (Ericson et al. 2006; Gibb et al. 2007; Slack et al. 2007); however, we excluded Cathartidae (Falconiformes) because the only mtDNA sequence available generates a long isolated branch in our preliminary analyses. This could be due to the fact that Cathartidae may not be birds of prey and therefore not part of Falconiformes (Tagliarini et al. 2009). Unlike morphological studies, we could not find evidence supporting a sister relationship of falconiforms and strigiforms (owls) (Livezey and Zusi 2007). These findings are consistent with the majority of molecular studies indicating that such relationship is spurious (Sibley and Ahlquist 1990; Gibb et al. 2007; Hackett et al. 2008; Pratt et al. 2009). Instead, we found evidence indicating that strigiforms could be sister taxa of psittaciforms (parrots, see below).
In the case of Psittaciformes, there has been considerable uncertainty concerning their relationship to other avian orders. Hackett et al. (2008) hypothesized that Passeriformes and Psittaciformes were sister taxa with Falconidae as a closely related group; we could not find such relationship by increasing the number of mtDNA sequences with New World species or using any data partition. Indeed, in all our analyses with the unrooted data set, we recovered a very well-supported clade (posterior probability of 1.0, fig. 1A) between Strigiformes and Psittaciformes, sharing a common ancestor with Coraciiformes, Piciformes, Trogoniformes, and Passeriformes. We also recovered this clade in our ML analyses with unrooted trees, albeit with lower support (67%). Our results are consistent with previous reports hypothesizing that Strigiformes and Psittaciformes are sister taxa, (Sorenson et al. 2003; Harrison et al. 2004, Gibb et al. 2007; Brown et al. 2008; Wright et al. 2008). However, more sequences of complete mtDNA genome for Strigiformes are needed in order to discard the possibility of long-branch attraction effect because owls appear to have some of the highest rates of sequences evolution among the Neoaves (Pratt et al. 2009). This long-branch attraction could explain some of the results in the rooted tree (see below). It is worth noting that within Psittaciformes, the family Psittacidae sensu Collar (1997) is paraphyletic as indicated by the basal position of the Kakapo (Psittacidae, Strigopinae) when compared with the cockatoo genus Nymphicus (Cacatuidae, Calyptorhynchinae) that is the next to diverge (fig. 1A). These results are consistent with previous studies using data sets with shorter alignments (de Kloet RS and de Kloet SR 2005; Astuti et al. 2006; Tavares et al. 2006; Tokita et al. 2007; Wright et al. 2008). Overall, the relationships of the strigiforms–psittaciforms clade with coraciiforms, trogoniforms, and passeriforms are still unresolved (posterior probabilities of 0.60–0.64 and low bootstrap support in the ML analyses, 20%).
Our study shows that Coraciiformes are a monophyletic group with two well-separated clades: Bucerotidae (hornbills) and Coraciidae–Alcedinidae families. We found coraciiforms sharing a common ancestor with Piciformes and Trogoniformes. Although morphological and molecular studies showed that parrots are closely related to coraciiforms, trogoniforms, piciforms, and coliiforms (Pratt et al. 2009), some significant groups, such as coliiforms, musophagiforms, and trogoniforms, are not yet well represented in mtDNA genome studies. Thus, it is necessary to improve the sampling of lineages from these groups of birds.
Passeriformes, like in previous studies, were recovered as a monophyletic group with the suboscine (Tyranni) and the oscine passerines (Passerida and Corvida) as two separated clades, with rifleman (Acanthisittidae) as their sister group (fig. 1A). Both the monophyly and the relationship among the passeriforms have long been established using morphological (Livezey and Zusi 2007) and molecular data that include nuclear genes and mtDNA genomes (Ericson et al. 2002; Pereira and Baker 2006; Slack et al. 2007; Hackett et al. 2008; Pratt et al. 2009). In these analyses, however, Passeriformes were never found as sister taxa of Psittaciformes as recently proposed (Hackett et al. 2008).
Rooted Tree
The correct rooting of Neoaves is important not only in resolving the evolutionary history of birds but also in understanding rates and patterns of molecular evolution in their mtDNA genomes (Paton et al. 2002). We used Galloanserae as outgroup of our tree, which is considered a sister group of Neoaves. We recovered Anseriformes and Galliformes as monophyletic groups with a strong support (1.0 posterior probability and 100% bootstrap for ML) (fig. 1B) (Watanabe et al. 2006; Slack et al. 2007). Like in the unrooted tree, the Psittaciformes–Strigiformes clade was always recovered in the Bayesian analyses; however, it was not well supported in some cases (posterior probability varied between 0.57–0.92 depending on the partition used). In the case of ML analyses, the Psittaciformes or Strigiformes were indistinctively placed as basal groups in Neoaves indicating that the position of the Psittaciformes–Strigiformes clade lacked support. Although we increased the number of mtDNA genomes for psittaciforms, the psittaciforms–strigiforms relationship remains unsolved in these rooted phylogenies. This could be the result of a long-branch attraction effect between Galloanserae and the fast-evolving strigiforms, a potential artifact that could be the result of the limited taxon sampling for this group. However, this is similar to phylogenies obtained in studies using nuclear genes that have also reported great uncertainty at the basal clades of the Neoaves phylogeny (Hackett et al. 2008).
Within the Neoaves, we confirmed results derived from the unrooted tree: the monophyly of Coraciiformes, Passeriformes, Cuculiformes, Apodiformes, Sphenisciformes, Procellariiformes, Gaviiformes, Podicipediformes, Charadriiformes, Columbiformes, and Falconiformes; and the paraphyly of Ciconiiformes and Caprimulgiformes. We also found the close relationship between coraciiforms, piciforms, and trogoniforms previously described; however, these orders appear as a sister group of Passeriforms (fig. 1B). This observation is consistent in all our rooted trees. Therefore, both unrooted and rooted phylogenies suggest the early divergence of Strigiformes, Psittaciformes, Coraciiformes, Piciformes, Trogoniformes, and Passeriformes, although the specific relationships among some of these orders are still unclear. Nevertheless, our results did not support the sister relationship between passeriforms and psittaciforms with Falconidae as a sister to this clade, as has been reported by Hackett et al. (2008). Another important result of this study, is that, like the unrooted trees, the rooted trees strongly suggest that Charadriiformes and Columbiformes are sister group (fig. 1B), a result that has been suggested by few previous works (Sibley and Ahlquist 1990; Shapiro et al. 2002).
In conclusion, using the largest complete mtDNA genomes data set (80 mtDNA) included in a single study, our analyses recovered clades that suggest evolutionary relationships that have been independently proposed for these orders using mt or nuclear genes and limiting the scope of the taxa included. In contrast, we could not find evidence supporting that Psittacides and Passerines are sister taxa as was recently proposed. It may be possible that such relationship could be recovered with a more comprehensive taxa sampling of complete mtDNA genomes. Overall, our analyses strongly support the idea that by increasing the number of mtDNA sequences it is possible to solve the polytomies at the base of the Neoaves phylogeny. Indeed, we have shown that by adding sequences from critical groups, we can increase the stability of the phylogenetic hypotheses.
Timing the Origin of Neoaves
The phylogeny obtained through improved taxon (n = 80) and character (13,685 bp mtDNA) samplings, and the use of only well-accepted calibration points (n = 3) allows us to explore the evolutionary history of Neoaves with a relaxed molecular clock approach. The performance of molecular clocks is strictly dependent on the validity of their assumptions (e.g., evolutionary rate model) and on the calibration information provided, represented by the minimum–maximum boundaries and the prior distribution between them. To evaluate the effect of the clock assumptions on the Neoaves time estimates, we have used three popular methods (MDT, BEAST, and r8s), which assume different models of rate changes across lineages and allow different representation of the calibration nodes. For example, MDT and r8s assume autocorrelated evolutionary rates, whereas BEAST assumes uncorrelated rates; MDT uses uniform prior distributions for the calibration points, whereas BEAST has a suite of distributions to choose from, including uniform and exponential. This setup allows us not only to obtain a timetree of the Neoaves but also to explore the reliability of estimated divergence times and, also, include multiple sources of uncertainty in the credibility intervals associated with the estimates. The framework of our timing investigation is to test whether the origin of major Neoaves orders is consistent with a recent adaptive radiation after the K/T boundary or is rather a deeper event in time. In this optic, the most conservative approach, and the one we take here, is to discuss only those estimates that are more conservative (younger), which are those obtained with the two Bayesian methods (MDT and BEAST). Overall, r8s divergence dates were consistently older than those estimates obtained by using the other two methods and, therefore, less conservative in supporting post K/T origins.
Regardless of the fact that we used an extra calibration point for BEAST (Clarke et al. 2005), the time estimates obtained from MDT and BEAST are clearly consistent (y = 0.99x; R2 = 0.98). This is despite their differences in assumptions and priors. In BEAST, in fact, we used an exponential prior instead of a uniform prior because more conservative (see Methods) and still recover many divergence times older than the K/T boundary. Furthermore, a recent simulation study showed that MDT and BEAST perform differently when their assumption of evolutionary rate model is matched or violated (Battistuzzi et al. 2010) and tightly constrained calibration points are used. However, even in the presence of wide variation of evolutionary rates among genes and groups (table 3), in our study, we do not find a difference between the two molecular clock methods. This could be caused either by the larger calibration ranges we used or by heterogeneous rates that, in reality, are best described by a mixture of the evolutionary models assumed by the two clocks. Nevertheless, the agreement of two widely different molecular clocks supports their accuracy and the use of combined credibility intervals (cCrIs) ensures that multiple sources of uncertainty (e.g., rate model and calibration prior) are considered during hypothesis testing (Battistuzzi et al. 2010) (table 3). Even using these conservative time estimates, our results support that the basal divergences of Neoaves occurred in the Cretaceous, before the K–T boundary, with many crown groups diversifying later in the Cenozoic (table 3, fig. 2A and B, see also supplementary fig. S1, Supplementary Material online with r8s times in supplementary materials). The origin of a crown group starts with its divergence from its sister clade (the stem). We, therefore, looked at these divergences and found that of 14 monophyletic orders represented by more than one lineage, 12 have their stem groups prior to the K/T (table 3). These observations are consistent with previous studies that included some of these groups (Harrison et al. 2004; Pereira and Baker 2006; Brown et al. 2008; Pratt et al. 2009; Paton et al. 2002) and are also supported by historical biogeographical reconstructions (Cracraft 2001).
Table 3.
Time Estimates and the cCrIs Obtained Using Our Rooted Phylogenetic Hypothesis.
| Divergence | MDT |
Beast |
cCrIs | ||
| Node Age (My) | 95% CrI | Node Age (My) | 95% CrI | ||
| Strigiformes–Psttaciformes | 85.29 | 79.15, 93.98 | 88.33 | 79.32, 97.62 | 79.15–97.62 |
| Strigiformes | 75.59 | 69.26, 84.04 | 75.95 | 64.64, 87.07 | 69.26–87.07 |
| Psittaciformes | 57.32 | 54.13, 63.43 | 61.44 | 54.00, 69.71 | 54.13–69.71 |
| Coraciiformes–Piciformes–Trogoniformes (CPT group) | 82.18 | 76.09, 90.62 | 83.55 | 75.40, 91.90 | 76.09–91.90 |
| Coraciiformes | 78.56 | 72.61, 86.77 | 79.48 | 70.95, 87.95 | 72.61–87.95 |
| Piciformes–Trogoniformes | 72.5 | 66.39, 80.37 | 76.78 | 67.83, 85.69 | 66.39–85.69 |
| CPT–Passeriformes | 84.61 | 78.45, 93.19 | 87.30 | 79.14, 95.50 | 78.45–95.50 |
| Passeriformes | 76.26 | 70.34, 83.89 | 78.50 | 71.75, 85.00 | 70.34–85.00 |
| Suboscines–Oscines | 73.61 | 67.71, 81.16 | 74.92 | 67.66, 81.86 | 67.71–81.86 |
| Menuroidea–Oscines | 53.39 | 48.38, 59.57 | 60.02 | 52.91, 67.42 | 48.38–67.42 |
| Cuculiformes–Apodiformes | 80.77 | 74.79, 89.11 | 79.92 | 71.89, 88.59 | 74.79–88.59 |
| Cuculiformes | 63.38 | 57.71, 70.44 | 59.76 | 48.27, 71.62 | 57.71–71.62 |
| Apodiformes | 65.37 | 59.40, 72.95 | 58.34 | 46.48, 69.87 | 59.40–69.87 |
| Ciconiiformes–Pelecaniformes–Sphenisciformes–Procellariiformes | 72.25 | 67.13, 79.72 | 71.78 | 65.42, 78.73 | 67.13–78.73 |
| Ciconiidae–Sphenisciformes | 67.12 | 62.38, 74.53 | 66.84 | 62.00, 73.25 | 62.38–73.25 |
| Procellariiformes | 57.98 | 52.83, 64.86 | 57.37 | 47.56, 67.71 | 52.83–67.71 |
| Gaviiformes | 73.42 | 68.19, 81.01 | 73.21 | 66.66, 80.35 | 66.66, 81.01 |
| Podicipediformes–Phoenicopteriformes | 65.59 | 60.39, 72.81 | 67.15 | 57.88, 76.74 | 60.39–76.74 |
| Charadriiformes–Columbiformes | 74.98 | 69.45, 82.78 | 74.86 | 67.63, 82.65 | 69.45–82.65 |
| Charadriiformes | 66.57 | 61.21, 73.79 | 64.59 | 55.33, 73.95 | 61.21–73.95 |
| Columbiformes | 49.77 | 45.28, 55.63 | 47.23 | 37.62, 56.77 | 45.28–56.77 |
| Falconiformes | 77.05 | 71.26, 85.16 | 77.79 | 69.87, 85.83 | 69.87–85.83 |
| Accipitridae | 61.6 | 56.29, 68.45 | 58.97 | 47.68, 70.20 | 56.29–70.20 |
| Falconidae | 59.92 | 54.48, 66.94 | 58.97 | 48.02, 70.32 | 54.48–70.32 |
NOTE.—Stem (italic) and rown group divergences (regular) are shown.
FIG. 2.
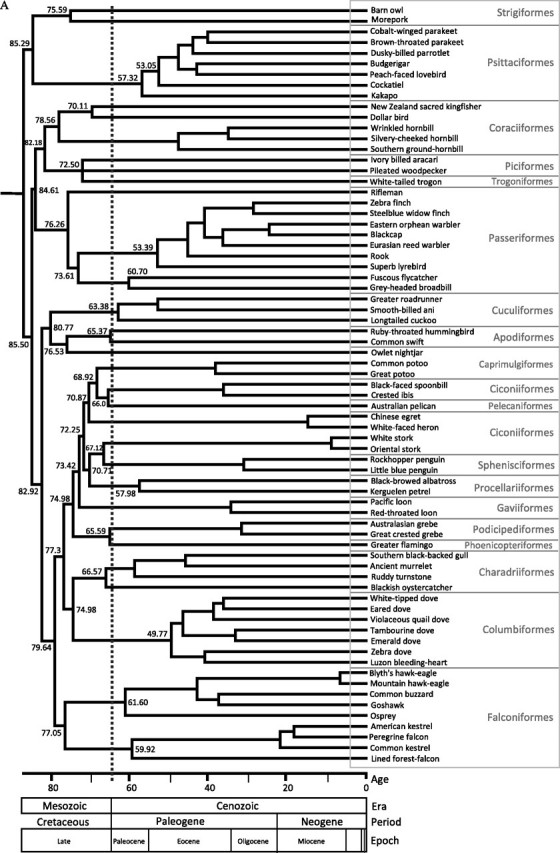
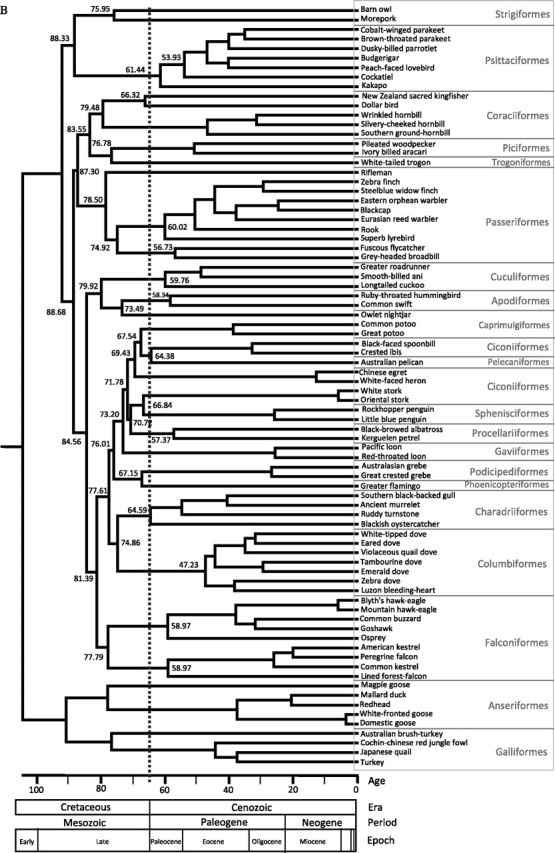
Timetrees estimated using phylogenetic hypothesis B. Timetree (A) was obtained using MDT; the calibration point within the outgroup (Galloanserae) could not be used in this method. Timetree (B) was obtained using BEAST; it includes the calibration point within the outgroup (Galloanserae). Both methods yield very similar time estimates.
Overall, our results are consistent with Cooper and Penny (1997), where modern bird orders started to diverge by the mid-Cretaceous, with at least 22 lineages crossing the Cretaceous–Tertiary (K/T) boundary 65 Ma. Our time estimates suggest that a large number of lineages survived from the Cretaceous to the present with many ecological–morphological transformations taking place during the late Cretaceuos, and the crown groups diverged in the Tertiary (fig. 2). Such scenario was previously proposed by Penny and Phillips (2004) in their so-called model D. However, better taxon sampling that leads to well-supported phylogenetic hypothesis among avian orders and additional good calibration points are needed.
In the case of the origin of Columbiformes, their divergence from Charadriiformes took place in the late Cretaceous (75 My, fig. 2), and the radiation of modern Columbiformes occurred in the middle of the Eocene (45.28–56.77 My, table 3), similarly to what have been recently reported (Pereira et al. 2007). In our study, the crown group of the Charadriiformes originated slightly prior to the K/T boundary (61.21–73.95 My); however, Baker et al. (2007) reported older times placing their origin between 79 and 102 My. Our time estimates for Passeriformes confirm previous reports of a pre K/T origin (Cracraft 2001; Ericson et al. 2002); the specific time estimates are given in the table 3.
We found that the radiation of Psittaciformes took place early in the Cenozoic Era (ca. 54–70 My, table 3 and fig. 2); however, the cCrI includes the K/T. Debates about the origin of the parrots and cockatoos reflect those of the Neornithes in general, with some studies suggesting that they originated in Gondwana during the Cretaceous (Cracraft 1973; Forshaw 1989; Wright et al. 2008, using 82 Ma for the split between cockatoos and the remaining psittaciforms), whereas others, citing fossil evidence from tertiary deposits in Europe or using fossils to calibrate their molecular dating, conclude a post-Cretaceous diversification (Dyke and Mayr 1999; Mayr 2002; Wright et al. 2008). Given that our estimates are considered conservative, the possibility that psittaciforms radiated prior the K/T boundary cannot be dismissed, especially, if the divergence from strigiformes will be further supported by additional data; our investigations indicate that such hypothetical owl–parrot divergence took place prior to the K/T (table 3). This is the first study using complete mtDNA genomes that estimated the origin of Coraciiformes. We found that Coraciiformes diverged from Piciformes and Trogoniformes around 76–92 My, and the origin of modern Coraciiformes is placed in the Late Cretaceous (72.61–87.95 My, table 3).
Based on the time estimates obtained and the individual branch lengths, we also estimated the average rate of evolution for all mt genes (table 4 and supplementary table S2 and fig. S2, Supplementary Material online for a detailed account of rate estimates per node for all genes). As previously reported (Pereira and Baker 2006; Nabholz et al. 2009), we found great disparities among the rate of evolution on mt genes. Several studies have focused on the reliability of COX1 for identifying species in different bird orders (Hebert et al. 2004; Tavares and Baker 2008); however, limited efforts have been made to compare the variance on its rate of evolution among major Neoaves groups and how those compare with that observed for other mt genes (Pereira and Baker 2006; Nabholz et al. 2009). Overall, we found that COX1 is the slower evolving gene and also the one that exhibits the lower variance among major Neoaves groups as further evidenced in figure 3, where the dispersion of rates among COX1 (slower) and ND2, the fastest evolving gene, are contrasted. The lower average and variance of COX1 evolutionary rates across major Neoaves groups support its use for developing standards for DNA barcoding because those have the potential of being reproducible among highly divergent groups of birds. This observation is further reinforced when we explore the fit of a linear regression between divergence times and genetic distance for each gene. The higher the fit, the closer to a clock-like behavior the gene is (table 5). Whereas several genes show relatively good fit, we found that COX1 is the one that shows the least amount of rate heterogeneity (R2 = 0.84).
Table 4.
Average Substitution Rates for Each Protein-Coding Gene in Terms of Substitutions Per Site Per My for Major Bird Orders.
| Partition | Gene | Rate (per site, per My) |
Average Rate | SD | |||||
| Charadriiformes | Columbiformes | Coraciiformes | Falconiformes | Passeriformes | Psittaciformes | ||||
| 1 | ND1 | 0.0033 | 0.0032 | 0.0054 | 0.0034 | 0.0051 | 0.0033 | 0.0039 | 0.00099 |
| 2 | ND2 | 0.0048 | 0.0055 | 0.0093 | 0.0059 | 0.0090 | 0.0062 | 0.0068 | 0.00191 |
| 3 | COX1 | 0.0022 | 0.0025 | 0.0037 | 0.0021 | 0.0032 | 0.0023 | 0.0027 | 0.00064 |
| 4 | COX2 | 0.0030 | 0.0041 | 0.0069 | 0.0041 | 0.0074 | 0.0043 | 0.0050 | 0.00175 |
| 5 | ATP8 | 0.0027 | 0.0033 | 0.0079 | 0.0054 | 0.0052 | 0.0040 | 0.0047 | 0.00185 |
| 6 | ATP6 | 0.0044 | 0.0045 | 0.0080 | 0.0055 | 0.0079 | 0.0055 | 0.0059 | 0.00161 |
| 7 | COX3 | 0.0019 | 0.0026 | 0.0038 | 0.0026 | 0.0041 | 0.0027 | 0.0030 | 0.00083 |
| 8 | ND3 | 0.0034 | 0.0031 | 0.0045 | 0.0035 | 0.0068 | 0.0040 | 0.0042 | 0.00136 |
| 9 | ND4L | 0.0039 | 0.0035 | 0.0069 | 0.0040 | 0.0053 | 0.0037 | 0.0045 | 0.00131 |
| 10 | ND4L | 0.0029 | 0.0034 | 0.0068 | 0.0038 | 0.0059 | 0.0040 | 0.0045 | 0.00155 |
| 11 | ND5 | 0.0027 | 0.0030 | 0.0054 | 0.0032 | 0.0050 | 0.0034 | 0.0038 | 0.00112 |
| 12 | CYTB | 0.0023 | 0.0029 | 0.0049 | 0.0027 | 0.0040 | 0.0027 | 0.0033 | 0.00099 |
| 13 | tRNA | 0.0014 | 0.0014 | 0.0035 | 0.0024 | 0.0032 | 0.0024 | 0.0024 | 0.00087 |
| 14 | 12S | 0.0020 | 0.0022 | 0.0054 | 0.0033 | 0.0031 | 0.0034 | 0.0032 | 0.00124 |
| 15 | 16S | 0.0021 | 0.0025 | 0.0059 | 0.0035 | 0.0035 | 0.0036 | 0.0035 | 0.00134 |
NOTE.—Rates were calculated using MDT.
FIG. 3.

Rates distributions across branches (internal and external) for COX1 (the slower evolving gene) and ND2 (the fastest evolving gene).
Table 5.
Linear Regression Between Divergence Times and Genetic Distance for Each Gene.
| Substitution | ||
| Gene | Rate | Fit (R2) |
| ND1 | 0.0036 | 0.7955 |
| ND2 | 0.006 | 0.7811 |
| COX1 | 0.0024 | 0.8477 |
| COX2 | 0.0044 | 0.6775 |
| ATP8 | 0.0043 | 0.5656 |
| ATP6 | 0.0054 | 0.8035 |
| COX3 | 0.0026 | 0.7454 |
| ND3 | 0.0037 | 0.6481 |
| ND4L | 0.0039 | 0.6418 |
| ND4 | 0.004 | 0.7672 |
| ND5 | 0.0035 | 0.7784 |
| Cytb | 0.0029 | 0.7509 |
| tRNAs | 0.0023 | 0.6885 |
| 12S | 0.0028 | 0.6478 |
| 16S | 0.0032 | 0.6993 |
NOTE.—The higher the fit the more clock like is the behavior of the gene.
In conclusion, even using conservative approaches, molecular time estimates place the origin of many extant avian orders at the end of the Mesozoic and the radiation of modern genera in the Paleocene and Eocene. These times estimates, together with the perspective that basal politomies of the Neoaves phylogeny could be solved by improving the sampling in terms of taxa and nucleotides, contradict the hypothesis of an explosive adaptive radiation for modern birds after the K/T boundary (Feduccia 1995, 2003). We also found that among mt genes, COX1 evolved with the lower variance in its rates among major groups and is the gene with the least amount of rate heterogeneity (i.e., closer to a clock-like behavior).
Supplementary Material
Supplementary tables S1 and S2 and figures S1 and S2 are available at Molecular Biology and Evolution online (http://www.mbe.oxfordjournals.org/).
Acknowledgments
The authors thank the Tautphaus Park Zoo (Idaho Falls, USA), the Tulsa Zoo and Living Museum (Tulsa, USA), and Kathy Orr at the Liberty Wildlife Rehabilitation Foundation (Arizona, USA) for access to valuable samples. This research was supported by grants from the National Institute of Health (GM080586) to A.E. and the National Science Foundation (EGS0019) to S.K. We thank the DNA laboratory at the School of Life Sciences for their technical support.
References
- Anisimova M, Gascuel O. Approximate likelihood-ratio test for branches: a fast, accurate, and powerful alternative. Syst Biol. 2006;55:539–552. doi: 10.1080/10635150600755453. [DOI] [PubMed] [Google Scholar]
- Arnason U, Adegoke JA, Bodin K, Born EW, Esa YB, Gullberg A, Nilsson M, Short RV, Xu X, Janke A. Mammalian mitogenomic relationships and the root of the eutherian tree. Proc Natl Acad Sci U S A. 2002;99:8151–8156. doi: 10.1073/pnas.102164299. [DOI] [PMC free article] [PubMed] [Google Scholar]
- Astuti D, Azuma N, Suzuki H, Higashi S. Phylogenetic relationships within parrot (Psittacidae) inferred from mitochondrial cytochrome-b gene sequences. Zool Sci. 2006;23:191–198. doi: 10.2108/zsj.23.191. [DOI] [PubMed] [Google Scholar]
- Baker AJ, Pereira SL, Paton TA. Phylogenetic relationships and divergence times of Charadriiformes genera: multigene evidence for the Cretaceous origin of at least 14 clades of shorebirds. Biol Lett. 2007;3:205–210. doi: 10.1098/rsbl.2006.0606. [DOI] [PMC free article] [PubMed] [Google Scholar]
- Battistuzzi FU, Filipski A, Hedges SB, Kumar S. Performance of relaxed-clock methods in estimating evolutionary divergence times and their credibility intervals. Mol Biol Evol. 2010;27:1289–1300. doi: 10.1093/molbev/msq014. [DOI] [PMC free article] [PubMed] [Google Scholar]
- Brown JW, Payne RB, Mindell DP. Nuclear DNA does not reconcile ‘rock’ and ‘clock’ in Neoaves: a comment on Ericson et al. Biol Lett. 2007;3:257–259. doi: 10.1098/rsbl.2006.0611. [DOI] [PMC free article] [PubMed] [Google Scholar]
- Brown JW, Rest JS, García-Moreno J, Sorenson MD, Mindell DP. Strong mitochondrial DNA support for a Cretaceous origin of modern avian lineages. BMC Biol. 2008;28:6–6. doi: 10.1186/1741-7007-6-6. [DOI] [PMC free article] [PubMed] [Google Scholar]
- Clarke JA, Tambussi CP, Noriega JI, Erickson GM, Ketcham RA. Definitive fossil evidence for the extant radiation in the Cretaceous. Nature. 2005;433:305–308. doi: 10.1038/nature03150. [DOI] [PubMed] [Google Scholar]
- Collar NJ. Family Psittacidae (parrots) In: del Hoyo J, Elliot A, Sargatal J, editors. Handbook of the birds of the world. Barcelona (Spain): Lynx Editions; 1997. pp. 280–477. [Google Scholar]
- Cooper A, Penny D. Mass survival of birds across the Cretaceous-Tertiary boundary: molecular evidence. Science. 1997;275:1109–1113. doi: 10.1126/science.275.5303.1109. [DOI] [PubMed] [Google Scholar]
- Cooper RA, Millener P. The New Zealand biota: historical background and new research. Trends Ecol Evol. 1993;8:429–433. doi: 10.1016/0169-5347(93)90004-9. [DOI] [PubMed] [Google Scholar]
- Cracraft J. Continental drift, paleoclimatology and evolution and biogeography of birds. J Zool. 1973;169:455–545. [Google Scholar]
- Cracraft J. Avian evolution, Gondwana biogeography and the Cretaceous-Tertiary mass extinction event. Proc R Soc Lond B Biol Sci. 2001;268:459–469. doi: 10.1098/rspb.2000.1368. [DOI] [PMC free article] [PubMed] [Google Scholar]
- Cracraft J, Barker FK, Braun M, et al. (14 co-authors) Phylogenetic relationships among modern birds (Neornithes). Toward an avian tree of life. In: Cracraft J, Donoghue MJ, editors. Assembling the tree of life. New York: Oxford University Press; 2004. pp. 468–489. [Google Scholar]
- de Kloet RS, de Kloet SR. The evolution of the spindling gene in birds: sequence analysis of an intron of the spindling W and Z gene reveals four major divisions of the Psittaciformes. Mol Phylogenet Evol. 2005;36:706–721. doi: 10.1016/j.ympev.2005.03.013. [DOI] [PubMed] [Google Scholar]
- Delsuc F, Phillips MJ, Penny D. Comment on “Hexapod origins: monophyletic or paraphyletic”? Science. 2003;301:1482. doi: 10.1126/science.1086558. [DOI] [PubMed] [Google Scholar]
- Drummond AJ, Rambaut A. BEAST: Bayesian evolutionary analysis by sampling trees. BMC Evol Biol. 2007;7:214. doi: 10.1186/1471-2148-7-214. [DOI] [PMC free article] [PubMed] [Google Scholar]
- Dyke GJ, Dortangs RW, Jagt JWM, Mulder EWA, Schulp AS, Chiappe LM. Europe's last Mesozoic bird. Naturwissenschaften. 2002;89:408–411. doi: 10.1007/s00114-002-0352-9. [DOI] [PubMed] [Google Scholar]
- Dyke GJ, Mayr G. Did parrot exist in the Cretaceous period? Nature. 1999;399:317–318. [Google Scholar]
- Ericson PG, Anderson CL, Britton T, Elzanowski A, Johansson US, Källersjo M, Ohlson JI, Parsons TJ, Zuccon D, Mayr G. Diversification of Neoaves: integration of molecular sequence data and fossils. Biol Lett. 2006;2:543–547. doi: 10.1098/rsbl.2006.0523. [DOI] [PMC free article] [PubMed] [Google Scholar]
- Ericson PG, Christidis L, Cooper A, Irestedt M, Jackson J, Johansson US, Norman JA. A Gondwanan origin of passerine birds supported by DNA sequences of the endemic New Zealand wrens. Proc R Soc Lond B Biol Sci. 2002;269:235–241. doi: 10.1098/rspb.2001.1877. [DOI] [PMC free article] [PubMed] [Google Scholar]
- Ericson PG, Envall I, Irestedt M, Norman JA. Inter-familial relationships of the shorebirds (Aves: Charadriiformes) based on nuclear DNA sequence data. BMC Evol Biol. 2003;3:16. doi: 10.1186/1471-2148-3-16. [DOI] [PMC free article] [PubMed] [Google Scholar]
- Feduccia A. Explosive evolution in Tertiary birds and mammals. Science. 1995;267:637–638. doi: 10.1126/science.267.5198.637. [DOI] [PubMed] [Google Scholar]
- Feduccia A. Big bang' for tertiary birds? Trends Ecol Evol. 2003;18:172–176. [Google Scholar]
- Forshaw JM. Parrots of the world. Willoughby (Australia): Landsdowne Editions; 1989. [Google Scholar]
- García-Moreno J, Sorenson MD, Mindell DP. Congruent avian phylogenies inferred from mitochondrial and nuclear DNA sequences. J Mol Evol. 2003;57:27–37. doi: 10.1007/s00239-002-2443-9. [DOI] [PubMed] [Google Scholar]
- Gibb GC, Kardailsky O, Kimball RT, Braun EL, Penny D. Mitochondrial genomes and avian phylogeny: complex characters and resolvability without explosive radiations. Mol Biol Evol. 2007;24:269–280. doi: 10.1093/molbev/msl158. [DOI] [PubMed] [Google Scholar]
- Guindon S, Dufayard JF, Lefort V, Anisimova M, Hordijk W, Gascuel O. New algorithms and methods to estimate maximum-likelihood phylogenies: assessing the performance of PhyML 3.0. Syst Biol. 2010;59:307–321. doi: 10.1093/sysbio/syq010. [DOI] [PubMed] [Google Scholar]
- Guindon S, Gascuel O. A simple, fast, and accurate algorithm to estimate large phylogenies by maximum likelihood. Syst Biol. 2003;52:696–704. doi: 10.1080/10635150390235520. [DOI] [PubMed] [Google Scholar]
- Hackett SJ, Kimball RT, Reddy S, et al. (17 co-authors) A phylogenomic study of birds reveals their evolutionary history. Science. 2008;320:1763–1768. doi: 10.1126/science.1157704. [DOI] [PubMed] [Google Scholar]
- Harrison GL, McLenachan PA, Phillips MJ, Slack KE, Cooper A, Penny D. Four new avian mitochondrial genomes help get to basic evolutionary questions in the late Cretaceous. Mol Biol Evol. 2004;21:974–983. doi: 10.1093/molbev/msh065. [DOI] [PubMed] [Google Scholar]
- Hebert PDN, Stoeckle MY, Zemlak TS, Francis CM. Identification of birds through DNA barcodes. PLoS Biol. 2004;2:e312. doi: 10.1371/journal.pbio.0020312. [DOI] [PMC free article] [PubMed] [Google Scholar]
- Honeycutt RL, Adkins RM. Higher-level systematic of eutherian mammals-an assessment of molecular characters and phylogenetics hypotheses. Annu Rev Ecol Syst. 1993;24:279–305. [Google Scholar]
- Huelsenbeck JP, Ronquist F. MrBayes: Bayesian inference on phylogenetic trees. Bioinformatics. 2001;17:754–755. doi: 10.1093/bioinformatics/17.8.754. [DOI] [PubMed] [Google Scholar]
- Kjer KM, Honeycut RL. Site specific rates of mitochondrial genomes and the phylogeny of eutheria. BMC Evol Biol. 2007;7:8. doi: 10.1186/1471-2148-7-8. [DOI] [PMC free article] [PubMed] [Google Scholar]
- Kumar S, Hedges SB. A molecular timescale for vertebrate evolution. Nature. 1998;392:917–920. doi: 10.1038/31927. [DOI] [PubMed] [Google Scholar]
- Livezey BC, Zusi RL. Higher-order phylogeny of modern birds (Theropoda, Aves: Neornithes) based on comparative anatomy. II. Analysis and discussion. Zool J Linn Soc. 2007;149:1–95. doi: 10.1111/j.1096-3642.2006.00293.x. [DOI] [PMC free article] [PubMed] [Google Scholar]
- Mayr G. On the osteology and phylogenetic affinities of the Pseudasturidae-lower Eocene stem-group representatives of parrots (Aves, Psittaciformes) Zool J Linn Soc. 2002;136:715–729. [Google Scholar]
- Mayr G. Morphological evidence for sister group relationship between flamingos (Aves: Phoenicopteridae) and grebes (Podicipedidae) Zool J Linn Soc. 2004;140:157–169. [Google Scholar]
- Mayr G. Paleogene fossil birds. Berlin Heidelberg (Germany): Springer-Verlag; 2009. [Google Scholar]
- Mindell DP, Sorenson MD, Dimcheff DE. Multiple independent origins of mitochondrial gene order in birds. Proc Natl Acad Sci U S A. 1998;95:10693–10697. doi: 10.1073/pnas.95.18.10693. [DOI] [PMC free article] [PubMed] [Google Scholar]
- Mindell DP, Sorenson MD, Huddleston CJ, Miranda HC, Jr., Knight A, Sawchuk SJ, Yuri T. Phylogenetic relationship among and within select avian orders based on mitochondrial DNA. In: Mindell DP, editor. Avian molecular evolution and systematics. New York: Academic; 1997. pp. 214–247. [Google Scholar]
- Miya M, Nishida M. Use of mitogenomic information in teleostean molecular phylogenetics: a tree-based exploration under the maximum-parsimony optimality criterion. Mol Phylogenet Evol. 2000;17:437–455. doi: 10.1006/mpev.2000.0839. [DOI] [PubMed] [Google Scholar]
- Morgan-Richards M, Trewick SA, Bartosch-Härlid A, Kardailsky O, Phillips MJ, McLenachan PA, Penny D. Bird evolution: testing the Metaves clade with six new mitochondrial genomes. BMC Evol Biol. 2008;8:20. doi: 10.1186/1471-2148-8-20. doi:10.1186/1471-2148-8-20. [DOI] [PMC free article] [PubMed] [Google Scholar]
- Nabholz B, Glémin S, Galtier N. The erratic mitochondrial clock: variations of mutation rate, not population size, affect mtDNA diversity across birds and mammals. BMC Evol Biol. 2009;9:54. doi: 10.1186/1471-2148-9-54. [DOI] [PMC free article] [PubMed] [Google Scholar]
- Paton T, Haddrath O, Baker AJ. Complete mitochondrial DNA genome sequences show that modern birds are not descended from transitional shorebirds. Proc R Soc Lond B Biol Sci. 2002;269:839–846. doi: 10.1098/rspb.2002.1961. [DOI] [PMC free article] [PubMed] [Google Scholar]
- Paton TA, Baker AJ, Groth JG, Barrowclough GF. RAG-1 sequences resolve phylogenetic relationships within Charadriiform birds. Mol Phylogenet Evol. 2003;29:268–278. doi: 10.1016/s1055-7903(03)00098-8. [DOI] [PubMed] [Google Scholar]
- Penny D, Phillips MJ. The rise of birds and mammals: are microevolutionary processes sufficient for macroevolution? Trends Ecol Evol. 2004;19:516–522. doi: 10.1016/j.tree.2004.07.015. [DOI] [PubMed] [Google Scholar]
- Pereira SL, Baker AJ. A mitogenomic timescale for birds detects variables phylogenetic rates of molecular evolution and refutes the standard molecular clock. Mol Biol Evol. 2006;23:1731–1740. doi: 10.1093/molbev/msl038. [DOI] [PubMed] [Google Scholar]
- Pereira SL, Johnson KP, Clayton DH, Baker AJ. Mitochondrial and nuclear DNA sequences support a Cretaceous origin of Columbiformes and a dispersal-driven radiation in the Paleogene. Syst Biol. 2007;56:656–672. doi: 10.1080/10635150701549672. [DOI] [PubMed] [Google Scholar]
- Phillips MJ, McLenachan PA, Down C, Gibb GC, Penny D. Combined mitochondrial and nuclear DNA sequences resolve the interrelations of the major Australasian marsupial radiations. Syst Biol. 2006;55:122–137. doi: 10.1080/10635150500481614. [DOI] [PubMed] [Google Scholar]
- Phillips MJ, Penny D. The root of the mammalian tree inferred from whole mitochondrial genomes. Mol Phylogenet Evol. 2003;28:171–185. doi: 10.1016/s1055-7903(03)00057-5. [DOI] [PubMed] [Google Scholar]
- Poe S, Chubb AL. Birds in a bush: five genes indicate explosive evolution of avian orders. Evolution. 2004;58:404–415. [PubMed] [Google Scholar]
- Pratt RC, Gibb GC, Morgan-Richards M, Phillips MJ, Hendy MD, Penny D. Toward resolving deep neoaves phylogeny: data, signal enhancement, and priors. Mol Biol Evol. 2009;26:313–326. doi: 10.1093/molbev/msn248. [DOI] [PubMed] [Google Scholar]
- Reyes A, Gissi C, Catzeflis F, Nevo E, Pesole G, Saccone C. Congruent mammalian trees from mitochondrial and nuclear genes using Bayesian methods. Mol Biol Evol. 2004;21:397–403. doi: 10.1093/molbev/msh033. [DOI] [PubMed] [Google Scholar]
- Rubinoff D, Cameron S, Will K. A genomic perspective on the shortcomings of mitochondrial DNA for “barcoding” identification. J Hered. 2006;97:581–594. doi: 10.1093/jhered/esl036. [DOI] [PubMed] [Google Scholar]
- Sanderson M. Estimating absolute rates of molecular evolution and divergence times: a penalized likelihood approach. Mol Biol Evol. 2002;19:101–109. doi: 10.1093/oxfordjournals.molbev.a003974. [DOI] [PubMed] [Google Scholar]
- Shapiro B, Sibthorpe D, Rambaut A, Austin J, Wragg GM, Bininda-Emonds ORP, Lee PLM, Cooper A. Flight of the Dodo. Science. 2002;295:1683. doi: 10.1126/science.295.5560.1683. [DOI] [PubMed] [Google Scholar]
- Sibley CG, Ahlquist JE. Phylogeny and classification of birds: a study in molecular evolution. New Haven (CT): Yale University Press; 1990. [Google Scholar]
- Sims GE, Jun SR, Wu GA, Kim SH. Whole-genome phylogeny of mammals: evolutionary information in genic and nongenic regions. Proc Natl Acad Sci U S A. 2009;106:17077–17082. doi: 10.1073/pnas.0909377106. [DOI] [PMC free article] [PubMed] [Google Scholar]
- Slack KE, Delsuc F, McLenachan PA, Arnason U, Penny D. Resolving the root of the avian mitogenomic tree by breaking up long branches. Mol Phylogenet Evol. 2007;42:1–13. doi: 10.1016/j.ympev.2006.06.002. [DOI] [PubMed] [Google Scholar]
- Slack KE, Jones CM, Ando T, Harrison GL, Fordyce RE, Arnason U, Penny D. Early penguin fossils, plus mitochondrial genomes, calibrate avian evolution. Mol Biol Evol. 2006;23:1144–1155. doi: 10.1093/molbev/msj124. [DOI] [PubMed] [Google Scholar]
- Sorenson MD, Oneal E, Garcia-Moreno J, Mindell DP. More taxa, more characters: the hoatzin problem is still unresolved. Mol Biol Evol. 2003;20:1484–1498. doi: 10.1093/molbev/msg157. [DOI] [PubMed] [Google Scholar]
- Tagliarini MM, Pieczarka JC, Nagamachi CY, Rissimo J, de Oliveira EHC. Chromosomal analysis in Cathartidae: distribution of heterochromatic blocks and rDNA, and phylogenetic considerations. Genetica. 2009;135:299–304. doi: 10.1007/s10709-008-9278-2. [DOI] [PubMed] [Google Scholar]
- Tamura K, Dudley J, Nei M, Kumar S. MEGA4: Molecular Evolutionary Genetics Analysis (MEGA) software version 4.0. Mol Biol Evol. 2007;24:1596–1599. doi: 10.1093/molbev/msm092. [DOI] [PubMed] [Google Scholar]
- Tavares ES, Baker AJ. Single mitocondrial gene barcodes reliably identify sister-species in diverse clades of birds. BMC Evol Biol. 2008;8:81. doi: 10.1186/1471-2148-8-81. [DOI] [PMC free article] [PubMed] [Google Scholar]
- Tavares ES, Baker AJ, Pereira SL, Miyaki CY. Phylogenetic relationships and historical biogeography of neotropical parrots (Psittaciformes: Psittacidae: Arini) inferred from mitochondrial and nuclear DNA sequences. Syst Biol. 2006;55:454–470. doi: 10.1080/10635150600697390. [DOI] [PubMed] [Google Scholar]
- Thorne JL, Kishino H. Divergence time and evolutionary rate estimation with multilocus data. Syst Biol. 2002;51:689–702. doi: 10.1080/10635150290102456. [DOI] [PubMed] [Google Scholar]
- Tokita M, Kiyoshi T, Armstrong K. Evolution of craniofacial novelty in parrots through developmental modularity and heterochrony. Evol Dev. 2007;9:590–601. doi: 10.1111/j.1525-142X.2007.00199.x. [DOI] [PubMed] [Google Scholar]
- van Tuinen M. Advanced birds (Neoaves) In: Hedges SB, Kumar S, editors. The timetree of life. New York: Oxford University Press; 2009. pp. 419–422. [Google Scholar]
- van Tuinen M, Butvill DB, Kirsch JAW, Hedges SB. Convergence and divergence in the evolution of aquatic birds. Proc R Soc Lond B. 2001;268:1–6. doi: 10.1098/rspb.2001.1679. [DOI] [PMC free article] [PubMed] [Google Scholar]
- van Tuinen M, Hedges SB. Calibration of avian molecular clocks. Mol Biol Evol. 2001;18:206–213. doi: 10.1093/oxfordjournals.molbev.a003794. [DOI] [PubMed] [Google Scholar]
- van Tuinen M, Sibley CG, Hedges SB. The early history of modern birds inferred from DNA sequences of nuclear and mitochondrial ribosomal genes. Mol Biol Evol. 2000;17:451–457. doi: 10.1093/oxfordjournals.molbev.a026324. [DOI] [PubMed] [Google Scholar]
- Watanabe M, Nikaido M, Tsuda TT, Kobayashi T, Mindell D, Cao Y, Okada N, Hasegawa M. New candidate species most closely related to penguins. Gene. 2006;378:65–73. doi: 10.1016/j.gene.2006.05.003. [DOI] [PubMed] [Google Scholar]
- Waterhouse DM, Lindow BEK, Zelenkov NV, Dyke GJ. Two new parrots (Psittaciformes) from the lower Eocene fur formation of Denmark. Palaeontology. 2008;51:575–582. [Google Scholar]
- Wright TF, Schirtzinger EE, Matsumoto T, et al. (11 co-authors) A multilocus molecular phylogeny of the parrot (Psittaciformes): support for a Gondwanan origin during the Cretaceous. Mol Biol Evol. 2008;25:2141–2156. doi: 10.1093/molbev/msn160. [DOI] [PMC free article] [PubMed] [Google Scholar]
- Yang ZH. Paml 4: phylogenetic analysis by maximum likelihood. Mol Biol Evol. 2007;24:1586–1591. doi: 10.1093/molbev/msm088. [DOI] [PubMed] [Google Scholar]
- Yang ZH, Rannala B. Bayesian estimation of species divergence times under a molecular clock using multiple fossil calibrations with soft bounds. Mol Biol Evol. 2006;23:212–226. doi: 10.1093/molbev/msj024. [DOI] [PubMed] [Google Scholar]
- Zardoya R, Meyer A. Phylogenetic performance of mitochondrial protein-coding genes in resolving relationship among vertebrates. Mol Biol Evol. 1996;13:933–942. doi: 10.1093/oxfordjournals.molbev.a025661. [DOI] [PubMed] [Google Scholar]
- Zhang AB, He LJ, Crozier RH, Muster C, Zhu CD. Estimating sample sizes for DNA barcoding. Mol Phylogenet Evol. 2010;54:1035–1039. doi: 10.1016/j.ympev.2009.09.014. [DOI] [PubMed] [Google Scholar]
Associated Data
This section collects any data citations, data availability statements, or supplementary materials included in this article.