

Abstract
The study describes >400 major histocompatibility complex (MHC) class II B exon 2 and 114 intron 2 sequences of 36 passerine bird species, 13 of which belong to the group of Darwin’s finches (DFs) and the remaining 23 to close or more distant relatives of DFs in Central and South America. The data set is analyzed by a combination of judiciously selected statistical methods. The analysis reveals that reliable information concerning MHC organization, including the assignment of sequences to loci, and evolution, as well as the process of species divergence, can be obtained in the absence of genomic sequence data, if the analysis is taken several steps beyond the standard phylogenetic tree construction approach. The main findings of the present study are these: The MHC class II B region of the passerine birds is as elaborate in its organization, divergence, and genetic diversity as the MHC of the eutherian mammals, specifically the primates. Hence, the reported simplicity of the fowl MHC is an oddity. With the help of appropriate markers, the divergence of the MHC genes can be traced deep in the phylogeny of the bird taxa. Transspecies polymorphism is rampant at many of the bird MHC loci. In this respect, the DFs behave as if they were a single, genetically undifferentiated population. There is thus far no indication of alleles that could be considered species, genus, or even DF group specific. The implication of these findings is that DFs are in the midst of adaptive radiations, in which morphological differentiation into species is running ahead of genetic differentiation in genetic systems such as the MHC or the mitochondrial DNA. The radiations are so young that there has not been enough time to sort out polymorphisms at most of the loci among the morphologically differentiating species. These findings parallel those on Lake Victoria haplochromine fishes. Several of the DF MHC allelic lineages can be traced back to the MHC genes of the species Tiaris obscura, which we identified previously as the closest extant relative of DFs in continental America.
Keywords: Darwin’s finches, MHC class II, species polymorphism, phylogeny, variability, continental finches
Introduction
The major histocompatibility complex (MHC) is a set of genes shared by all jawed vertebrates possessing an immune system based on thymus-derived (T) lymphocytes (Klein and Hořejší 1997). Proteins controlled by the MHC genes display a special structural feature, the peptide-binding region, which is a groove capable of accommodating peptides of certain length and composition. Specialized antigen-presenting cells express MHC molecules loaded with pathogen-derived peptides on their surfaces for recognition by specific T-cell receptors on T lymphocytes. The interaction between the loaded MHC molecules and the T-cell receptors triggers a complex immune response, which leads to the elimination of the pathogen, from which the peptides originated. All gnathostomes possess two classes of MHC genes, class I and class II, which differ in their structure and functional specialization. In tetrapods, most of the class I and class II genes occupy a single chromosomal region, whereas in teleost fishes, the two classes are on different chromosomes (Bingulac-Popovic et al. 1997; Kelley et al. 2005). In the different tetrapod taxa, the clusters of the MHC genes have different evolutionary histories characterized by expansions and contractions as a result of gene duplications and deletions accompanying unequal crossing-over (Ohno 1970; Kulski et al. 2002; Kelley et al. 2005). Another striking feature of the MHC is an extensive polymorphism of some of the genes. Not only is the number of alleles at some of the MHC loci very large, but also many of the alleles differ by multiple substitutions. Moreover, the alleles form distinct evolutionary lineages and often members of a given lineage are more closely related to alleles of a corresponding lineage in another species than to alleles in a different lineage of the same species. This phenomenon is explained by the transspecies polymorphism (TSP) hypothesis (Klein 1980; Arden and Klein 1982)—the postulate that alleles of highly polymorphic MHC genes are transmitted through the speciation phase from the ancestral to the descendent species (reviewed in Klein et al. 2007). Because of this feature, the MHC genes can serve as markers in the study of the mechanisms of speciation, for example, to obtain information about the size of populations founding new species (Klein et al. 2007). The feature has been exploited in the study of adaptive radiation (Klein et al. 1993; Vincek et al. 1997)—the divergence of a founding species into a set of new species in response to diversified environmental conditions in a circumscribed area. One of the best-known cases of adaptive radiation is the group of 15 species of Darwin’s finches (DFs) on the Galapagos Archipelago and the Cocos Island in the Pacific Ocean (Lack 1947; Grant 1986).
It has long been suspected (Lack 1947; Grant 1986), and recent molecular evidence substantiates the suspicion (Freeland and Boag 1999a, 1999b; Petren et al. 1999, 2005; Sato et al. 1999), that the 15 DF species have radiated from a founding population that reached the islands by crossing an expanse of the Pacific Ocean of some 960 km from Central or South America. Mitochondrial DNA studies (Freeland and Boag 1999b; Sato et al. 1999) support the divergence of the founding population into five biologically distinct groups: the ground, tree, vegetarian, warbler, and Cocos Island finches. The studies fail to differentiate the species within the groups distinguished morphologically, thus confirming the presumed recency of the radiations. The mitochondrial DNA studies (Sato et al. 2001a) also support the origin of DFs from the Central/South American region and suggest that the founder population came from the tribe Thraupini, subfamily Emberizinae, family Fringillidae in the classification of Sibley and Ahlquist (1990). Of the extant species of Thraupini, the most closely related species to the DFs appears to be the grassquits of the genus Tiaris, specifically the dull-colored grassquit Tiaris obscura (Sato et al. 2001a). MHC DNA studies suggest that the founding population of the DFs was no smaller than 30 individuals (Vincek et al. 1997). Molecular characterization of the MHC class II B genes of the DFs (Sato et al. 2000, 2001b) has suggested the existence of at least five different groups of sequences, possibly from different loci. Of these, only one (group 5) had been studied in detail. The MHC and the DFs, together with their close relatives, offer a unique opportunity to study how genetic variation is retained or lost at the molecular level during speciation. The specific aims of the present study were as follows: first, to survey comprehensibly the MHC class II B genes of the DFs and related species; second, to determine the depth of sequence divergence at the most variable segment (the exon 2) of these genes and so to differentiate intra versus interlocus variation; third, to assess the extent of the polymorphism at the putative class II B loci; fourth, to estimate the proportion of the TSP at these loci; and fifth, to use all this information to draw inferences about the nature of speciation in the DFs.
Materials and Methods
Birds, Blood Samples, and DNA Extraction
Blood samples of “continental finches” (CFs) (10–20 μl from wing veins) were taken from mist-netted specimens collected by H.T. on St. Lucia and in Ecuador (Sato et al. 2001a). We use the term CFs to describe all species investigated for this study collected outside the Galapagos Archipelago and the Cocos Island. Blood samples of DFs were collected by P.G., R.G., and Dr. Peter T. Boag at Queen’s University, Ontario, Canada (Vincek et al. 1997; Sato et al. 1999). DFs were represented by 13 species, and CFs were represented by 22 species from 6 tribes of the family Fringillidae. The tribes were 15 species of Thraupini, 1 species of Parulini, 2 species of Icterini, 2 species of Emberizini, 1 species of Cardinalini, and 1 species of Carduelini (table 1). Other families were represented by Synallaxis brachyura (family Furnariidae, order Passeriformes), Columba squamosa, Geotrygon montana (family Columbidae, order Columbiformes), Piaya minuta (family Coccyzidae, order Cuculiformes). In total 117 individuals were used in this study, 55 DFs and 62 CFs (supplementary table S1, Supplementary Material online). Each individual was numbered; numbers 004–065 represent DFs and numbers 071–137 represent CFs. Blood was stored in AS buffer (Qiagen Blood Kit, Qiagen). This kit was also used for DNA extraction.
Table 1.
Sample Taxonomy and Species Representation.
| Species Name | Species Abbreviations | Tribe | No. of Indivi-duals | Group No. |
Primer Combinations Used | ||||||||||||||||||
| 1.6 | 1.7 | 2.4 | 2.5 | 3.1 | 3.2 | 3.3 | 4 | 5 | 10 | 11 | 12 | 13 | 14 | 15 | 16 | Total | |||||||
| DFs | Cactospiza pallida | Capa | Th | 3 | 1 | 3 | 3 | 2 | 3 | 12 | b e v z | ||||||||||||
| Camarhynchus parvulus | Capr | Th | 4 | 4 | 2 | 2 | 1 | 9 | bcd v | ||||||||||||||
| Camarhynchus pauper | Capu | Th | 3 | 1 | 3 | 6 | 2 | 12 | b et v | ||||||||||||||
| Camarhynchus psittacula | Caps | Th | 3 | 2 | 1 | 1 | 3 | 7 | b e v | ||||||||||||||
| Certhidea olivacea | Ceol | Th | 3 | 2 | 8 | 4 | 1 | 15 | b tuv z | ||||||||||||||
| Geospiza conirostris | Geco | Th | 3 | 2 | 2 | 4 | 1 | 9 | b t y | ||||||||||||||
| Geospiza difficilis | Gedi | Th | 2 | 1 | 1 | 1 | 1 | 4 | v | ||||||||||||||
| Geospiza fortis | Gefo | Th | 7 | 6 | 5 | 3 | 2 | 1 | 1 | 4 | 1 | 1 | 24 | b tuv | |||||||||
| Geospiza fuliginosa | Gefu | Th | 3 | 1 | 3 | 2 | 2 | 8 | b v | ||||||||||||||
| Geospiza magnirostris | Gema | Th | 4 | 1 | 4 | 3 | 3 | 2 | 1 | 14 | b t v | ||||||||||||
| Geospiza scandens | Gesc | Th | 12 | 13 | 20 | 11 | 8 | 1 | 1 | 1 | 55 | a b e vwx | |||||||||||
| Pinaroloxias inornata | Piin | Th | 5 | 2 | 9 | 4 | 4 | 4 | 23 | a v z | |||||||||||||
| Platyspiza crassirostris | Plcr | Th | 3 | 3 | 1 | 6 | 3 | 1 | 14 | b e tuv | |||||||||||||
| CFs | Catamenia inornata | Cain | Th | 1 | 4 | 4 | e | ||||||||||||||||
| Coereba flaveola | Cofl | Th | 1 | 2 | 1 | 3 | e | ||||||||||||||||
| Coryphospingus cucullatus | Cocu | Th | 1 | 2 | 6 | 8 | b e | ||||||||||||||||
| Diglossa humeralis | Dihu | Th | 1 | 2 | 1 | 3 | e | ||||||||||||||||
| Loxigilla noctis | Lono | Th | 2 | 3 | 1 | 1 | 5 | e t v | |||||||||||||||
| Melanospiza richardsoni | Meri | Th | 7 | 11 | 8 | 19 | e t v | ||||||||||||||||
| Oryzoborus angolensis | Oran | Th | 1 | 1 | 1 | 2 | e | ||||||||||||||||
| Poospiza hispaniolensis | Pohi | Th | 2 | 2 | 2 | e t | |||||||||||||||||
| Ramphocelus carbo | Raca | Th | 1 | 1 | 1 | 2 | e | ||||||||||||||||
| Sicalis flaveola | Sifl | Th | 2 | 1 | 6 | 7 | b e | ||||||||||||||||
| Sporophila nigricollis | Spni | Th | 1 | 5 | 5 | e | |||||||||||||||||
| Tiaris bicolor | Tibi | Th | 4 | 1 | 12 | 5 | 6 | 2 | 26 | b e tuv | |||||||||||||
| Tiaris canora | Tica | Th | 5 | 5 | 5 | 1 | 11 | b e t v z | |||||||||||||||
| Tiaris obscura | Tiob | Th | 6 | 1 | 1 | 3 | 11 | 15 | 7 | 6 | 44 | ab e u v | |||||||||||
| Volatinia jacarina | Voja | Th | 16 | 1 | 26 | 5 | 6 | 38 | b | ||||||||||||||
| Dendroica adelaidae | Dead | Pa | 1 | 2 | 2 | e | |||||||||||||||||
| Dives warszewiczi | Diwa | Ic | 1 | 2 | 2 | e | |||||||||||||||||
| Sturnella bellicosa | Stbe | Ic | 1 | 2 | 2 | e | |||||||||||||||||
| Atlapetes rufinucha | Atru | Em | 1 | 2 | 1 | 3 | e | ||||||||||||||||
| Zonotrichia capensis | Zoca | Em | 1 | 3 | 3 | e | |||||||||||||||||
| Pheucticus aureoventris | Phau | Ci | 1 | 3 | 3 | e | |||||||||||||||||
| Euphonia musica | Eumu | Cu | 1 | 2 | 2 | e | |||||||||||||||||
| Synallaxis brachyura | Sybr | 1 | 2 | 2 | f | ||||||||||||||||||
| Columba squamosa | Cosq | 1 | 2 | 2 | f | ||||||||||||||||||
| Geotrygon montana | Gemo | 1 | 1 | 1 | f | ||||||||||||||||||
| Piaya minuta | Pimi | 1 | 2 | 2 | f | ||||||||||||||||||
| Total | 31 | 41 | 14 | 40 | 36 | 9 | 22 | 12 | 57 | 29 | 21 | 14 | 9 | 8 | 5 | 61 | 409 | ||||||
NOTE—DFs, Darwin's finches; CFs, continental finches. For the origin of finches used in this study, see Sato et al. (1999, 2001a). Tribe abbreviation—Th, Thraupini; Pa, Parulini; Ic, Icterini; Em, Emberizini; Ci, Cardinalini; Cu, Carduelini.
Polymerase Chain Reaction (PCR), Cloning of PCR Product, and DNA Sequencing
PCR conditions were as follows: one cycle of denaturation for 30 s at 94 °C, annealing for 15 s at the annealing temperature, and extension for 7 min at 72 °C, followed by 34 cycles of denaturation for 15 s at 94 °C, annealing for 15 s at the annealing temperature, and extension for 1–3 min at 72 °C, and a final extension for 7 min at 72 °C. In each reaction, 2 μl of genomic DNA, 0.2 mM of each of the four deoxyribonucleotides, 0.5 μM of each of the sense and antisense primers, 2.5 U of Taq polymerase (Amersham Pharmacia Biotech), and 0.4 U Pfu DNA polymerase (Stratagene) were added to 10 μl of 5× PCR buffer. Hot-start PCR was carried out using HotWax 3.5 mM Mg2+ beads (Invitrogen). The DNA was amplified in the GeneAmp PCR System 9700 (PE Applied Biosystems) or in the PTC-200 Programmable Thermal Controller (MJ Research, Biozym, Hessisch Oldendorf, Germany). The sequences and the position of primers are shown in supplementary figure S4 (Supplementary Material online). The primers used in each individual and each species are shown in supplementary table S1 (Supplementary Material online) and table 1, respectively. The primer combinations for the amplification of parts of exon 2 are designated a, b, c, d, e, f; primer combinations for the amplification of parts of exon 2 and parts or whole intron 2 are designated t, u, v, w, x, y, z. PCR products were purified by agarose gel electrophoresis and extraction using the QIAEX II Gel Extraction Kit (Qiagen) and cloned into the pUC18 vector with the help of the Sure Clone Ligation Kit (Amersham Biosciences). The sequencing reactions were processed by the automated laser fluorescent sequencer (Amersham Pharmacia Biotech) and the LI-COR Long Read IR DNA sequencer (MWG Biotech). Each clone was sequenced in both directions in the LI-COR Long Read IR DNA sequencer.
Southern DNA Blotting and Hybridization
A total of 7 μg of bird genomic DNA was digested with 120 U of the restriction enzymes EcoRI, HindIII, and BamHI overnight under the conditions recommended by the supplier (Roche Diagnostics, Mannheim, Germany), and fragments were separated by 0.8% agarose gel electrophoresis and blotted onto Hybond-N + nylon filters (Amersham Biosciences). One hundred nanograms of DNA was used to label the probe. Probe labeling, prehybridization, and hybridization were conducted using the AlkPhos DIRECT kit (Amersham Pharmacia Biotech). After 14.5-h hybridization, the filter was washed according to the AlkPhos Direct protocol. Following the application of the chemiluminescent detection reagent CDP-Star, Hyperfilm ECL was exposed to the blot for 2 h 15 min on the second day and developed.
Sequences
The sequences have been deposited in the DDBJ databank and can be retrieved under the accession codes AB531504–AB531822. In the phylogenetic trees (fig. 2, supplementary figs. S1 and S2, Supplementary Material online), each sequence is designated using four letters of the species abbreviation and three digits of the individual number followed by the accession code. MHC class II sequences of humans and of various catarrhines and platyrrhines were obtained from the MHC databases (www.ebi.ac.uk/imgt/hla/and www.ebi.ac.uk/ipd/mhc/, respectively). Strepsirrhine sequences were obtained from the NCBI nucleotide database (www.ncbi.nlm.nih/gov/nucleotide/). To reduce possible bias due to overrepresentation, from >700 HLA-DRB sequences, 280 sequences representing each major HLA-DRB lineage were selected and combined with all nonhuman sequences. Following elimination of short sequences, in excess of 1,000 unique primate exon 2 sequences were aligned for use in analyses. Sequences of galliform birds were identified by Blast search and extracted from the NCBI database.
FIG. 2.
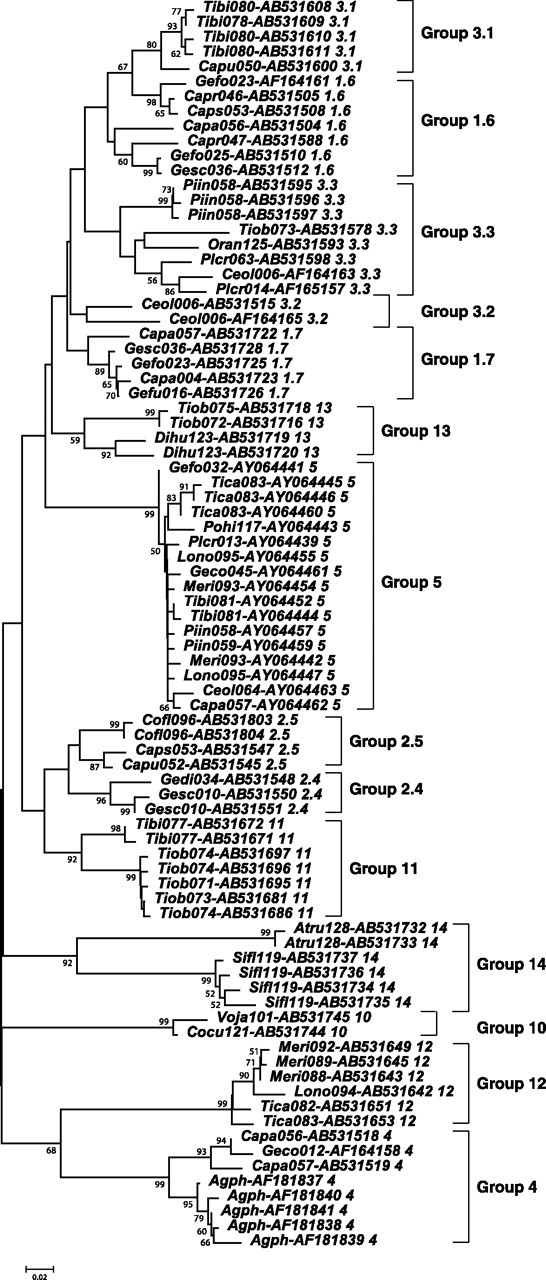
NJ tree of 84 selected DF and CF class II MHC exon 2 sequences. The sequence designation indicates the species MHC abbreviations and the individual numbers followed by the sequence accession code and finally the group to which the sequence is allocated. The alignment length was 233 nt, and sequences shorter than 190 bp were excluded, as were sequences showing affinity to more than one grouping. Fourteen groups are shown in the tree. Group 15 was omitted because of its short sequences. Distances were determined using Kimura’s two-parameter method with pairwise deletion of gaps or missing data. Numerals on nodes indicate a bootstrap recovery >50% of that node over 500 replications. Vertical bars and adjacent numerals indicate the extent and identity of the groups respectively.
Sequence Analysis
MHC exon 2 sequences were aligned using default settings of the ClustalW program (Thompson et al. 1994). Phylogenetic analysis on large data sets was conducted using MEGA (Tamura et al. 2007), whereas additional parsimony and likelihood analyses on smaller data sets were conducted using PAUP* (Swofford 1998) or PHYLIP (Felsenstein 1993), respectively. Neighbor joining (NJ) trees were based on distances estimated using Kimura’s two-parameter method with pairwise deletion of indels. To determine how our survey relates to passerine MHC variation, we chose representative members of each group and performed Blast searches for possible orthologous sequences among other passerine MHC sequences in the DNA databases. Sequences identified as being similar to specific DF or CF sequences were subjected to phylogenetic analyses.
Kimura’s two-parameter method was used to determine the substitutional distance between all pairwise combinations of aligned exon 2 sequence. The nucleotide diversity (π) for each group was estimated from the average of the pairwise comparisons within groups and the intergroup genetic distance (p) was estimated from distances between groups. The net nucleotide diversity (dA) was estimated by subtracting average nucleotide diversities from the intergroup divergence. It was estimated for all intergroup comparisons although it is formally relevant to divergence between populations rather than between loci.
Results
Characteristics of an Extensive MHC Survey
To obtain an informative “slice” through the genetic variability at the time of adaptive radiation, we collected nucleotide sequences of the most variable part (exon 2) of the MHC class II B genes from 13 species of DFs and 26 species of their close relatives (table 1). The collection contained altogether 321 unique sequences from the total of 443 sequences, of which 219 came from DFs and 224 from the CF. Some of the DF sequences (60) were reported in earlier studies of the founding population size (Vincek et al. 1997), the description of a highly conserved MHC locus (Sato et al. 2001b), and a preliminary study of the sequence motif origin (Sato et al. 2000). Most of the sequences were obtained from PCR amplification products using primer pairs located at the opposite ends of exon 2, but 114 sequences came from amplifications, in which one primer was located within exon 2 and the other either within intron 2 or in exon 3. The length of the former sequences containing exon 2 ranged from 164 to 189 bp; that of the intron 2–containing sequences varied from 292 to 2,163 bp.
Several lines of evidence indicate that the sequences come from multiple loci. First, the number of different sequences per individual ranges from 1 to 14 (supplementary table S1, Supplementary Material online) so that at least some individuals must have minimally 7 MHC class II B loci. Second, on phylogenetic trees based on these sequences (see below), multiple clades could be distinguished, of which at least some represented different loci. Third, multiple loci are also indicated by the analysis of the intron 2 sequences (see below). And fourth, Southern blot analysis reveals the presence of multiple bands (fig. 1), at least some of which are presumably derived from different loci.
FIG. 1.
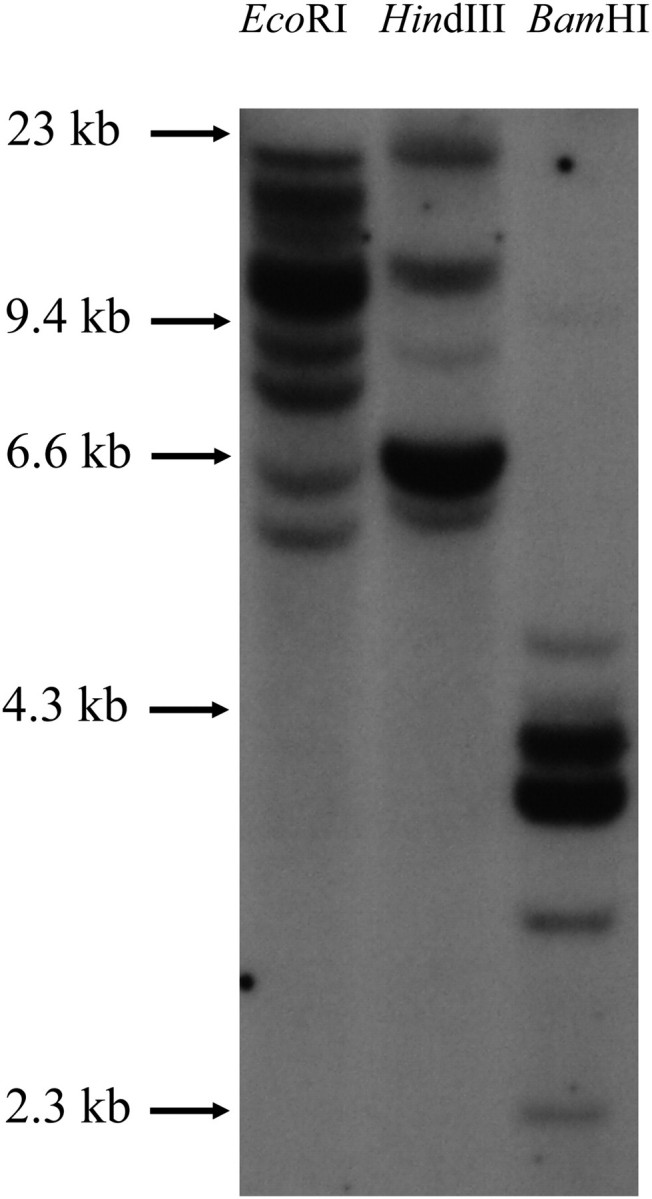
Southern blot hybridization. Melanospiza richardosoni genomic DNA was digested with EcoRI, HindIII, and BamHI restriction enzymes, and the blot was hybridized with a Meri MHC class II B exon 2 probe. Marker sizes in kilobases (kb) are indicated.
MHC Locus Assignment
Direct mapping of the MHC at a molecular level requires the availability of a high quality of DNA preparations. For rare or endangered species such as DFs, necessary quantities of tissue are not readily available, and it is desirable to determine as much as possible without recourse to such DNA preparations. We emphasize, however, that for the purpose of the present study, a completely accurate assignment of the individual sequences to the different MHC loci was not strictly necessary. Our approach was to distinguish individual loci as far as possible using bioinformatic methods. First, we attempted to estimate the likely number of loci using as a guide the number of bands in the Southern blots, the number of sequences recovered per individual and the divergence patterns seen in phylogenetic trees and in pairwise sequence comparisons. Second, we attempt to assign sequences to these loci using as a guide the expected general increase in the number of substitutions in going from intralocus to interlocus comparisons. Finally, we examined the consistency of our assignments by comparison with substitution patterns seen in genomes with a similar MHC organization.
To obtain an overall picture of MHC class II B variation in DFs and CFs, we produced phylogenetic trees by the NJ, parsimony, and maximum likelihood methods based on the complete set of sequences. Supplementary figure S1 (Supplementary Material online) shows one such tree based on exon 2 sequences.
Several putative loci are identified by their sharing of distinctive sequence characteristics and their grouping into well-supported distinctive clades. Sequences previously identified as groups 4 and 5 (Vincek et al. 1997; Sato et al. 2000) are clearly distinguished in well-supported clades, as are the groups we designate 10, 12, 13, 14, and 15. These groupings are supported by parsimony and likelihood trees. For this and other reasons outlined below, we believe them to be distinct loci. Other clades can be seen that are not so well supported, and several sequences lie between clades. Many of these difficult-to-assign sequences have a shorter length (those of Vincek et al. 1997 are 173 bp in length) or can be categorized as recombinant, having sequence affinities with more than one clade.
Additional steps were necessary, however, to distinguish probable loci among the remaining sequences. Among the sequences that do not fall into well-supported clades, the number of such sequences obtained per individual varies from 1 to 11 (supplementary table S1, Supplementary Material online) indicating that as many as 6 additional loci are required. The DF-containing clades alone were examined initially. Sequences that could be reliably assigned to specific groups on the phylogenetic trees (bootstrap values >95 for groups 4 and 5) were removed from consideration, as initially were also the CF sequences, and the remaining DF sequences were subjected to a second round of phylogenetic analysis. By this approach, seven probable clades were identified among the remaining DF sequences on phylogenetic trees. Because these seven clades contain sequences previously divided into three groups by Vincek et al. (1997), they are given the designations 3.1, 3.2, 3.3, 2.4, 2.5, 1.6, and 1.7, with the first digit indicating the numbering of Vincek et al. and the second digit the current divisions. We next attempted to assign sequences of uncertain affinity to each of the specific clades. Sequences in these clades were divided into core members and candidate members, the former generally producing well-supported clades in phylogenetic trees and the latter being of uncertain affinity. Initially, only strongly differentiated core member sequences were assigned to the seven groups defined by the clades. Pairwise distances between and within groups and between these groups and the candidate sequences were then estimated. In this manner, the candidate member sequences could be assigned to specific groups while ensuring that intragroup distances were predominantly less than intergroup distances for any sequence and that the net nucleotide distances (dA) within groups were consistent with those found in primate MHC class II B loci (see below). Subsequently, the CF sequences were tested to determine their group assignments, using the same rationale. Sixty-one of the CF sequences could thus be accommodated within the DF clades (table 1). Most of the remaining CF sequences could be subdivided into six further clades, which were again selected to give consistently smaller distances between than within groups. In this manner, all but 56 CF and 5 DF sequences (which are either too distant to assign together or represent probable recombinants between groups) were assigned to 15 groups (table 1 and supplementary fig. S1, Supplementary Material online). Supplementary figure S1 (Supplementary Material online) contains in excess 400 sequences many of which are unassigned, short, or recombinant-like resulting in poor support for most groupings on the tree. The elimination of such sequences and the reduction of the groups to core members result in a better representation of the groups and better supported clades, as seen in figure 2. We postulate that each group corresponds to a distinct locus and consequently estimate that at least 15 loci are seen in our survey, of which one (group 12) consists solely and one predominantly (group 10) of sequences containing a shared termination codon in exon 2. Our estimate of nine loci encompassing the DF sequences is consistent with the pattern seen in the Southern blot and accommodates much of the variation seen in trees. However, the fact that the avian MHC is known to show considerable haplotypic variation (variation in the gene copy number) within and between species (Hosomichi et al. 2006), together with the irregular distribution of sequences per group from each individual (supplementary table S1, Supplementary Material online), strongly suggests that haplotypic variation also occurs in DFs and CFs.
To further boost the confidence in the clades, we aligned 114 sequences encompassing all or part of intron 2. The sequences include representatives of 11 of the assigned groups (introns of groups 10, 13, 14, and 15 did not amplify), and most of them consist largely of repeats, the most common being CCAGTCCATT, which occurs 437 times in the 114 sequences. Minor variants of this decamer occur also at high frequencies and, as in other fringillid species (Hess et al. 2000: Came, Agph, and Anvi), very little of the intron is nonrepetitive. The loss or gain of repeat elements makes the intron alignment challenging. Nevertheless, the tree of 114 sequences (supplementary fig. S2, Supplementary Material online) recovers the previously assigned groupings to a considerable extent. Groups 4, 5, 11, and 12 are recovered monophyletically.
An interesting feature of the second intron is the presence of a short (60–80 bp) segment of DNA without similarity to the repeats. The segment is found in all DF and CF sequences available, except group 5. Blast searches also reveal its presence in noncoding segments of MHC sequences from other passerine species including zebra finch as well as in a member of the psittacine order. The role or origin of this element is not clear, but the element is not widespread outside the MHC and it shows a high degree of sequence conservation. Like the DFs, the redwing blackbird has loci that both contain (Agph-DAB2, Agph-DAB3) and do not contain (Agph-DAB1) the element. The element thus provides a marker for passerine MHC genes, dividing them into two separate groups.
The MHC proteins produced by different loci or allelic lineages are often identified by characteristic peptide motifs that distinguish members of a group (Klein and O'hUigin 1995). In order to characterize the presence of peptide motifs that differentiate the groupings, we determined a majority consensus amino acid sequence for each of the 15 groups (fig. 3). For each group, we also produced a sequence logo, which gives information on the frequency of the occurrence of amino acids in each position (supplementary fig. S3, Supplementary Material online).
FIG. 3.

Amino acid alignment of majority consensus sequence estimated for each of 15 groups. The upper sequence shows the overall majority consensus, and a dash (-) in the lower sequences indicates identity with the top sequence. The single letter amino acid code is used to indicate differences between group consensus and overall consensus with exclamation mark (!) used to indicate a termination codon.
Considerable sequence variation between the 15 consensus sequences is seen in figure 3, with variability concentrated in several locations along the alignment. Several distinguishing motifs are seen among the seven groups that are poorly resolved in phylogenetic analyses (groups 3.1, 3.2, 3.3, 2.4, 2.5,1.6, and 1.7). Groups 3.1, 3.2, and 3.3 share a predominant HRE motif (HRQ in the case of 3.1) at locations 8–10 as well as RVA at positions 36–38. The three groups are distinguished from one another by the invariant occurrence of a QQLTM motif in alignment positions 15–19 of group 3.1, whereas LMHVM predominates in group 3.2 and QPYAV in group 3.3 at these positions. Groups 2.4, 2.5, 1.6, and 1.7 share a predominant ERY in positions 8–10 and share QPYAV with group 3.3 as the predominant residues at positions 15–19. Positions 36–38 are occupied by RVA in group 1.6 but by MNA in groups 2.4, 2.5, and 1.7. The four groups can be distinguished at positions 46–49 by the presence of EWM (2.4), ELM (2.5), AKL (1.6), or AIL (1.7).
Considerable sporadic sharing of motifs or amino acid residues occurs unsystematically between distinct groups and sequences. For example, both Y or F occur sporadically within most groups at positions 6 and 33 of the alignment. At position 36, M, R, or K are found in various groups. At positions 64–66, each of the motifs PIV or ELD and EVF is shared by several groups. A stop codon (TAG) is found occasionally in groups 3.1, 10, and 13 in place of Y at residue 63. It is probable that recombinational processes generate much of the observed sharing although point mutation and convergence may also be implicated and distinguishing the relative role of each of these mechanisms may be difficult.
Intertribe Orthology and TSP
Group 5, previously described by Sato et al. (2001b), is both the largest (57 sequences) and most speciose (17 species) (table 1). The distinctive character of this group (evidenced by its isolation from other groups on phylogenetic trees and interspecies conservation) facilitates the assignment of sequences to it, even of those from distant species. Nevertheless, it consists only of DFs and their close CF relatives, and it is either absent or failed to amplify from more distant CF species. Group 4, previously described by Vincek et al. (1997), is also distinctive on trees but contains fewer (12) sequences from five species only. The redwing blackbird Agph-DAB2 locus (Edwards et al. 1998) was found to be similar to group 4 sequences in Blast searches. Phylogenetic analysis strongly supports the orthology of Agph-DAB2 to DF group 4 (supplementary fig. S1, Supplementary Material online), attesting to a high level of interspecies conservation and to an early origin of this locus. It is the only locus for which we find a well-supported orthology between two different emberizine tribes. The remaining 7 DF-containing groupings are 3.1 (36 sequences from 11 species), 3.2 (9 sequences from 2 species), 3.3 (22 sequences from 8 species), 2.4 (14 sequences from 3 species), 2.5 (40 sequences from 14 species), 1.6 (31 sequences from 9 species), and 1.7 (41 sequences from 8 species) (table 1).
MHC allelic lifetimes are known to be enhanced by selection such that MHC polymorphisms can persist beyond the lifetimes of species. An adaptive radiation provides much opportunity for the identification of MHC polymorphisms that exceed in age the lifetime of the radiating species. Because species divergence times are closely spaced during an adaptive radiation, the identification of long-lived TSPs is facilitated. A characteristic of TSP is the reduction of the extent to which sequences form species-specific clades in phylogenetic trees. In this study (supplementary fig. S1, Supplementary Material online), many sequences do not group by species and considerable mixing of species occurs within clades. Alleles from a particular species that are scattered to different parts of the tree provide likely examples of TSPs. Among DFs, such patterns are found for Piin, Capr, and Caps in group 3.1; for Plcr, Piin, Gefu, and Gesc in group 3.3; for Gesc and Piin in group 2.4; for Capa, Piin, and Gesc in group 2.5; for Gesc, Capr, Gefo, and Geco in group 1.6; for Gesc, Gema, Gefo, Gefu, and Capa in group 1.7; as well as Gefo, Gema, and Geco in group 4. Thus, for 10 of the species, at all but one of the putative loci, likely examples of TSPs occur. Because of the manner by which locus assignment is made, there is some uncertainty regarding what is a locus and what is a lineage and incomplete lineage sorting may contribute to TSP in recently derived DF (ground and tree finches). It is therefore possible that the extent of TSP is overstated. Nevertheless, it is improbable that other reconstructions of the tree or locus reassignment could bring all distant alleles together. Further subdivision of clades into additional loci might reduce the extent of TSPs but would require that the number of loci far exceed the number of bands seen in the Southern blot (fig. 1). In the simplest case, complete elimination of TSP in DF entails postulating at least seven additional loci to subdivide those groups that show TSP. On the other hand, an overestimation of the number of loci would generally result in an underestimation of the degree of TSP.
Comparison to MHC Divergences in Primates and Galliformes
The MHC displays remarkable consistency across the many gnathostome taxa in which it has been characterized. The division of the MHC into two classes each of which is itself divided into multiple families shared between species within each taxon is generally conserved. Because of this consistency, we can expect to learn much by comparing the MHC organization in the best-characterized mammalian order, primates, to its avian counterpart, the order Passeriformes. Our approach is to compare the characteristics of interlocus divergence for both the avian and the eutherian orders. To obtain statistical measures of MHC class II B sequence diversity within and divergence between the groups, we analyzed the frequency distribution of divergences in histograms and estimated three parameters: average genetic distance (p), average nucleotide diversity per site (π), and net number of nucleotide substitutions per site (dA). The pattern of diversity depends on the loci—their numbers, the timing of their divergences, and the extent of their polymorphisms. The best-characterized MHC of any species is the human (HLA) class II B gene complex (Robinson et al. 2010). The HLA class II B loci fall into five subclasses (families) that arose by gene duplication and are named DOB, DPB, DQB, DRB, and DMB. The earliest duplication gave rise to DMB, and all the families arose prior to the radiation of eutherian mammals. Each of the DPB, DQB, and DRB loci has subsequently undergone independent duplications. In the comparisons that follow, we eliminate duplicate loci consisting predominantly of pseudogenes (DPB2, DQB2, DRB2, DRB6) and the poorly alignable DMB, and retain the DOB, DPB1, DQB1, DRB1, DRB3, DRB4, and DRB5 loci.
The DF and CF comparisons include comparisons across species, as well as across loci. Because the pattern of diversity is affected by species representation and the timing of the species’ divergences, catarrhine, platyrrhine, and strepsirrhine (DRB only) sequences were added to the human comparisons. These primate sequences were divided into five groups, consisting of DOB, DPB, DQB, DRB1, and other DRB duplicate loci, respectively (this last group is referred to as DRBX). We compared the 3′ segment of exon 2 orthologous to that sequenced in DF and CF genes—a segment of 223 bp maximally. To mimic the incompleteness of many DF and CF sequences, we examined the effects of terminating half of the primate sequences at 173 bp in length, corresponding to the shorter DF and CF sequences.
Figure 4A shows the frequency of specific levels of sequence divergence found in pairwise sequence comparisons in human. Intralocus comparisons range in divergence from 0 to 15 substitutions per 100 sites, interlocus DRB comparisons from 3 to 15, and interfamily DRB, DPB, and DQB comparisons from 18 to 34 substitutions per 100 sites. Interfamily comparisons involving DOB sequences lie in the range 47–50 substitutions per 100 sites (table 2A), reflecting an early divergence of this locus. Three distinct peaks with nodes at 7, 21, and 27 are seen reflecting comparisons of different subclasses in human sequence. The mode at seven results from high frequencies of all intralocus and inter-DRB loci comparisons. The mode at 21 corresponds to comparisons of DRB loci to DPB and that at 27 to comparisons involving DQB (fig. 4A, table 2A). Comparisons with DRB1 and its duplicate loci produce peaks that overlap extensively—an indication of the recency of these duplications relative to the long-lived polymorphisms at DRB1. When additional catarrhine (fig. 4B) or platyrrhine plus strepsirrhine (fig. 4C), sequences are added to the human sequences, a right shift in modes occurs, with a broadening of the distributions and a blurring of the distinct peaks in DPB- and DQB-specific interfamilial comparisons.
FIG. 4.

Frequency histogram of pairwise distances found in intra (light shading) and inter (dark shading) group comparisons. The four sequence groups used for primates are (a) human DRB1, DRBX (which is DRB3, 4, or 5), DPB1, and DQB1 (b) Catarrhine DRB1, DRBX (consisting of nonspecified DRB duplicate loci), DPB1, and DQB1 (c) Strepsirrhine and haplorrhine DRB1, DRBX, DPB1, and DQB1. A variable number of sequence groups is used for birds. The groups are (d) 9 groups including all assigned DFs; (e) the same 9 groups including all DFs and CFs assigned to those groups; (f) all 15 groups including all the assigned DFs and CFs. The horizontal axis indicates the number of substitutions per 100 sites (estimated using Kimura’s two-parameter method) found in pairwise sequence comparisons, whereas the ordinate indicates the frequency of occurrence of a specific number of substitutions. (g) The distribution found for available fowl (light shading, 104 unique sequences) and quail (dark shading 39 unique sequences) MHC class II B sequences. The frequency values in pairwise comparisons of fowl sequences are shown at 10% of the true height to make them comparable with that of the quail.
Table 2.
Genetic Distances between (A) Primate Loci and (B) Passerine Loci.
| A. Mean number of nucleotide substitutions between primate locia | |||||||||||||||
| Human Loci | DRB1 | DRBX | DPB1 | DQB1 | DOB | ||||||||||
| DRB1 | 6.3 | 1.3 | 15.9 | 19.1 | 44.6 | ||||||||||
| DRBX | 8.5 | 8.0 | 16.5 | 18.6 | 45 | ||||||||||
| DPB1 | 20.8 | 22.3 | 3.5 | 25.9 | 44.8 | ||||||||||
| DQB1 | 26.4 | 26.7 | 20 | 8.2 | 43 | ||||||||||
| DOB | 48.6 | 49.8 | 47.4 | 47.9 | 1.7 | ||||||||||
| N | 282 | 30 | 70 | 40 | 4 | ||||||||||
| Catarrhine Loci | DRB1 | DRBX | DPB1 | DQB1 | |||||||||||
| DRB1 | 7.4 | 0.9 | 14.5 | 16.9 | |||||||||||
| DRBX | 10.1 | 11.1 | 14.2 | 15.2 | |||||||||||
| DPB1 | 21.5 | 23.1 | 6.7 | 26.9 | |||||||||||
| DQB1 | 26.3 | 26.5 | 17.9 | 11.3 | |||||||||||
| N | 353 | 148 | 134 | 101 | |||||||||||
| Strepsirhine Loci | DRB1 | DRBX | DPB1 | DQB1 | |||||||||||
| DRB1 | 7.4 | 1.5 | 14.4 | 16.6 | |||||||||||
| DRBX | 12.5 | 14.6 | 11.5 | 13.8 | |||||||||||
| DPB1 | 21.6 | 22.2 | 6.9 | 26.9 | |||||||||||
| DQB1 | 26.2 | 27 | 17.6 | 11.8 | |||||||||||
| N | 353 | 355 | 135 | 107 | |||||||||||
| B. Mean number of nucleotide substitutions between passerine locia | |||||||||||||||
| Ground Finch Group | 3.1 | 3.2 | 3.3 | 2.4 | 2.5 | 1.6 | 1.7 | 4 | 5 | ||||||
| 3.1 | 6.6 | 12.2 | 7.1 | 13.5 | 11.7 | 6.9 | 8.2 | 16.1 | 16.1 | ||||||
| 3.2 | 12.2 | 0 | 9.4 | 18.9 | 14.9 | 15.4 | 19.3 | 24.2 | 23.8 | ||||||
| 3.3 | 14.4 | 9.4 | 8 | 9.6 | 3.6 | 5.9 | 7.2 | 17.8 | 19 | ||||||
| 2.4 | 19.6 | 18.9 | 16.4 | 5.6 | 4.4 | 11.9 | 7.3 | 17.7 | 15.9 | ||||||
| 2.5 | 18.1 | 14.9 | 10.7 | 10.3 | 6.2 | 7.3 | 4.2 | 19 | 15.8 | ||||||
| 1.6 | 12.6 | 15.4 | 12.4 | 17.2 | 12.9 | 4.9 | 4.3 | 22.6 | 14.4 | ||||||
| 1.7 | 14.7 | 19.3 | 14.4 | 13.3 | 10.4 | 10 | 6.4 | 20.6 | 12.7 | ||||||
| 4 | 20.4 | 24.2 | 22.8 | 21.5 | 23 | 26 | 24.7 | 1.9 | 29.4 | ||||||
| 5 | 19.7 | 23.8 | 23.3 | 19 | 19.1 | 17.1 | 16.2 | 30.7 | 0.6 | ||||||
| N | 6 | 1 | 4 | 13 | 8 | 23 | 34 | 10 | 6 | ||||||
| DF Group | 3.1 | 3.2 | 3.3 | 2.4 | 2.5 | 1.6 | 1.7 | 4 | 5 | ||||||
| 3.1 | 7.2 | 5.9 | 5 | 10.4 | 9.1 | 5.9 | 8.5 | 15.8 | 16.6 | ||||||
| 3.2 | 12.3 | 5.6 | 6.2 | 13.1 | 11.8 | 7.9 | 8.6 | 19.9 | 17.3 | ||||||
| 3.3 | 12.8 | 13.2 | 8.3 | 7.2 | 3.7 | 5 | 7.1 | 17.7 | 17.2 | ||||||
| 2.4 | 16.9 | 18.9 | 14.4 | 5.9 | 4.1 | 11 | 6.9 | 18 | 16.1 | ||||||
| 2.5 | 15.8 | 17.7 | 10.9 | 10.1 | 6.1 | 7.5 | 4.1 | 20.1 | 16.3 | ||||||
| 1.6 | 12.5 | 13.7 | 12.1 | 17 | 13.5 | 6 | 4 | 21.6 | 14.2 | ||||||
| 1.7 | 15.3 | 14.6 | 14.4 | 13.1 | 10.3 | 10.1 | 6.3 | 20.5 | 13.2 | ||||||
| 4 | 20.6 | 23.9 | 23 | 22.1 | 24.3 | 25.7 | 24.8 | 2.3 | 29.5 | ||||||
| 5 | 20.6 | 20.6 | 21.8 | 19.4 | 19.8 | 17.6 | 16.8 | 31.1 | 0.8 | ||||||
| N | 22 | 9 | 20 | 15 | 36 | 31 | 42 | 12 | 24 | ||||||
| DF/CF Group | 3.1 | 3.2 | 3.3 | 2.4 | 2.5 | 1.6 | 1.7 | 4 | 5 | 10 | 11 | 12 | 13 | 14 | 15 |
| 3.1 | 9.1 | 6.2 | 5 | 10.4 | 8.7 | 5.6 | 7.4 | 16.3 | 15.2 | 22.7 | 10.7 | 24.1 | 9.6 | 17.4 | 9.9 |
| 3.2 | 13.2 | 4.9 | 7.2 | 13.7 | 12.2 | 8.5 | 9.2 | 20.5 | 17.2 | 27.6 | 17.5 | 27.9 | 9 | 21.4 | 13.8 |
| 3.3 | 14.7 | 14.7 | 10.3 | 6.9 | 3.6 | 5.4 | 7.4 | 17.6 | 15.8 | 25.2 | 10.5 | 23.4 | 10.8 | 19.4 | 8.8 |
| 2.4 | 17.9 | 19.1 | 15 | 5.9 | 4 | 11 | 6.9 | 18 | 15.6 | 27.8 | 6 | 24.8 | 15.5 | 18.3 | 8.8 |
| 2.5 | 16.5 | 18 | 12 | 10.2 | 6.6 | 7.4 | 4 | 19.9 | 15.8 | 25.3 | 7.6 | 22.8 | 13.7 | 18.6 | 7.7 |
| 1.6 | 13.1 | 13.9 | 13.5 | 17 | 13.6 | 6 | 4 | 21.6 | 13.9 | 26 | 15.7 | 25.7 | 9.4 | 21.3 | 14.3 |
| 1.7 | 15.1 | 14.8 | 15.7 | 13.1 | 10.4 | 10.1 | 6.3 | 20.5 | 12.8 | 25.6 | 11.8 | 24.3 | 12.2 | 19.3 | 11 |
| 4 | 22 | 24.1 | 23.9 | 22.1 | 24.3 | 25.7 | 24.8 | 2.3 | 28.7 | 31.7 | 18.8 | 21.7 | 25.3 | 23.1 | 21.7 |
| 5 | 20.9 | 20.8 | 22 | 19.7 | 20.2 | 18 | 17.1 | 31 | 2.3 | 23.1 | 16.6 | 26.5 | 15.1 | 25.5 | 18.7 |
| 10 | 30.2 | 33.1 | 33.3 | 33.7 | 31.6 | 31.9 | 31.8 | 35.8 | 27.2 | 6 | 24.3 | 24.8 | 26.2 | 27.1 | 26.9 |
| 11 | 18.2 | 22.9 | 18.7 | 12 | 13.9 | 21.7 | 18 | 23 | 20.8 | 30.3 | 6.1 | 26.1 | 16.4 | 15.8 | 12.3 |
| 12 | 29.9 | 31.6 | 29.8 | 29 | 27.4 | 30 | 28.7 | 24.1 | 28.9 | 29.1 | 30.4 | 2.5 | 30.3 | 31.7 | 26.2 |
| 13 | 16.5 | 13.8 | 18.2 | 20.8 | 19.3 | 14.7 | 17.7 | 28.8 | 18.5 | 31.5 | 21.8 | 33.9 | 4.6 | 20.1 | 15 |
| 14 | 27.9 | 29.8 | 30.5 | 27.2 | 27.8 | 30.2 | 28.5 | 30.2 | 32.6 | 36 | 24.8 | 38.9 | 28.3 | 11.9 | 19.6 |
| 15 | 17.5 | 19.3 | 16.9 | 14.8 | 14 | 20.3 | 17.2 | 25.8 | 22.9 | 32.9 | 18.3 | 30.5 | 20.3 | 28.6 | 6 |
| N | 38 | 11 | 26 | 15 | 40 | 31 | 42 | 12 | 68 | 35 | 27 | 14 | 9 | 9 | 7 |
The table shows comparisons between (A) human, catarrhine or strepsirrhine loci or (B) between ground finches, DF groups, Darwin finch groups or DF and CF groups. The net nucleotide substitution between groups (dA) is shown above, the nucleotide diversities (π) along, and the mean nucleotide substitutions between groups below the diagonals. Substitutional distances (per 100 sites) are estimated using Kimura’s two-parameter method.
Table 2 indicates how the shifts seen in histograms are reflected in the statistical characteristics of the distributions in terms of p and dA. All intralocus variation is increased by consideration of catarrhine species in addition to humans, from 6.3 substitutions per 100 sites in humans to 7.4 for DRB1, from 8.0 to 11.1 for DRBX (reflecting multiple paralogous comparisons), from 3.5 to 6.7 for DPB1, and from 8.2 to 11.3 for DQB1. No unambiguous orthologs of DRB1 are found for strepsirrhine or platyrrhine species, but addition of sequences to the DRBX, DPB1, and DQB1 categories further increases the intralocus variation seen in table 2. Similarly, intralocus variation generally increases when DF sequences are added to those of ground finches (from 6.6 to 7.2 for group 3.1 or 0.6 to 0.8 for group 5) and when CFs are included.
No single DF species has a comparable number of sequences as are available in human and no single species has available sequences representing all the DF loci. However, the ground finches are known to be sufficiently closely related that mitochondrial (mt) haplotypes have not segregated in a species-specific manner (Sato et al. 1999). Pooling of the 120 ground finch sequences produces a distribution (fig. 4D) with three prominent spikes (at 10, 12, and 15) as well as several slight shoulders (at 18, 23, and 27). The prominent spikes are caused in part by the presence of many shorter sequences. The phenomenon can be reproduced in the primate distributions by trimming the final 45 bp in half of the sequences. The lack of isolated peaks is consistent with the DF sequences comprising more than the four locus groupings described in humans (fig. 4A). The distribution of divergences ranges from 0 to 13 substitutions per 100 sites for intralocus and from 6 to 38 substitutions per 100 sites for interlocus comparisons. This range compares with that found in human interlocus comparisons of DRB, DPB, and DQB but is less than that found for DOB. When all DFs are considered (fig. 4E), the interlocus divergence range is unchanged but shoulders appear more prominently on the distribution. When CFs are included with DFs (fig. 4F), the multimodality of the distribution is clearer with broad peaks around 20 and 31. The maximal interlocus distance increases to 43 substitutions per 100 sites, approaching that found for human DOB comparisons.
Much of the increase in divergences upon inclusion of CF sequences may be attributable to comparisons between paralogous loci in distant species. In addition to thraupine relatives of DFs, the tree includes representatives of sister tribes Cardinalini (Phau), Emberizini (Zoca, Atru), Icterini (Agph, Stbe, Diwa), and Parulini (Dead), as well as outgroups (Eumu, Sybr, Cosq, Gemo, Pimi) (Sibley and Ahlquist 1990; Klicka et al. 2007). Groups 10 and 15 are composed almost entirely of Voja and group 14 of Sifl and Atru, species known to be distant relatives of the DFs (Sato et al. 2001a). Among the likely orthologs of DF loci, the most distant are sequences found in the redwing blackbird Agph (Edwards et al. 1998) that are placed in group 4 with strong (99% in trees constructed with full-length sequences) bootstrap support. Besides the 15 groups we define here, the additional 61 sequences are either too distant or their groups contain too few sequences to be reliably assigned to specific clades. We denote these sequences as group 16 (table 1 and supplementary fig. S1, Supplementary Material online).
We used Blast search to obtain all sequences related to exon 2 of class II MHC genes in quail and fowl. The MHC of these galliformes has been well characterized genomically (Hosomichi et al. 2006) and, although far fewer exon 2 sequences are available than for primates, their closer evolutionary proximity to passerines makes them relevant to the analyses. Figure 4G shows the distribution of divergences within fowl sequences and within quail sequences. The 95 fowl sequences comprise 2 loci and have divergences not >18 substitutions per 100 sites. In contrast, the quail loci are numerous (up to 7 transcribed loci per haplotype), show haplotype variation (between 1 and 7 transcribed loci per chromosome), and a range of divergence (up to 33 substitutions per 100 sites) comparable with what we observed in DFs. In addition, the quail presents a complex pattern of divergences with the appearance of multiple peaks (the reduced number of sequences makes the pattern indistinct), whereas the fowl pattern appears monotonic. Both by the criterion of divergence range and the presence of multiple peaks, the DF loci more closely resemble the quail pattern than the much simpler fowl pattern. The mean divergence between quail and fowl MHCs is 23.1 substitutions, and the species are thought to have diverged some 20 Ma (Helm-Bychowski and Wilson 1986) indicating that 1% substitution corresponds to approximately 1 My divergence in figure 4G.
Under the assumption that the substitution rates of the bird and primate class II B loci are roughly comparable, we draw the following main conclusions from the data. First, all clades of bird sequences that give in pairwise comparisons genetic distances of <7.4 substitutions per 100 sites (the average distance between alleles at the catarrhine DRB1 locus) can operationally be taken as representing alleles at a single locus. All but one (group 3.3) of the nine DF-containing clades satisfy this condition. Second, because in the case of DF the sequences of different species intermingle in these clades, they represent TSP (Klein et al. 2007). Third, because sequences in several of the CF clades clustered by species, we presume that the explanation for this difference between DFs and CFs is the shorter species-divergence time in the DFs as compared with the CF group. And fourth, clades separated by an average genetic distance >7.4 substitutions per 100 sites presumably represent different class II B loci.
The 36 interlocus combinations of DF-containing clades yielded distance values ranging from slightly above the DRB1 reference point to 31.1 substitutions per 100 sites. This highest average value is found between groups 4 and 5, and both these groups show distances generally at or above 20% in comparisons with all other groups. The odd character of both the group 5 (Sato et al. 2001b) and group 4 loci probably accounts for the increased distance, which exceeds that between the primate DRB1 and DQB1 loci (26.4% substitution). The lowest average genetic distances between groups are those in the pairs 1.6 with 1.7 and 2.4 with 2.5 (10.1 and 10.2 substitutions per 100 sites, respectively), which compare with those between catarrhine DRB1 and DRBX loci (10.1 substitutions per 100 sites). All of the comparisons not involving groups 4 and 5 are in the range 10.1–19.1%. The bird class II B region can therefore be expected to be as complex as the human one and comprise loci of different degrees of relatedness to one another.
Timing of Locus Duplications in DFs and CFs
An NJ tree was constructed from the mean genetic distances between groups (fig. 5). In addition to representing the different intergroup distances, the tree also indicates a likely phylogeny for the groups. The catarrhine MHC tree (fig. 5A) shows bifurcating nodes at discrete intervals from each other, reflecting both the known relationships between loci and the discrete nature of distributions for pairwise comparisons (fig. 4A–C). The tree of DF and CF groups (fig. 5B) indicates that many closely spaced duplications occurred in the generation of the 15 groups. The close spacing of duplications is the likely cause of the poor resolution of intergroup peaks in the distribution of pairwise comparisons (fig. 4D–F). The relationships indicated in the tree suggest that group 5 may have arisen by duplication from a locus ancestral to groups 1.6 and 1.7. Furthermore, group 13, containing Tiob and Dihu sequences, may share locus ancestry with group 3.2. The robustness of the phylogeny based on average distances cannot be easily tested, but some of the relationships seen in figure 5 are supported by the observation that the minimum distances are smaller in pairwise comparisons between group 5 and sequences of group 1.6 (13% substitution) and group 1.7 (9% substitution) than for any other group.
FIG. 5.

NJ tree constructed from the mean pairwise distances between groups. All pairwise sequence comparisons are used to estimate Kimura’s two-parameter substitutional distances between groups for (a) catarrhine DRB1, DRBX, DPB1, DQB1, and DOB sequences or (b) all 15 groups of DF and CF sequences. The same scale is used for both dendrograms, and the bar indicates 5% divergence.
Several features of the DF MHC support our previous analyses of the relationships among DFs as well as between DFs and their closest relatives. Firstly, the MHC repertoires of DF species overlap extensively. Individual DF species are represented by multiple sequences at most of the seven loci. Second, the relationships of sequences at many individual loci indicate incomplete sorting of allelic polymorphism between DF species reflecting their recent origins. Third, those CF species thought to be close relatives of DFs also share many of the sequence groups with DFs. Representation of orthologous sequences for individual loci roughly follows the pattern of proximity of the CF species to DFs (Sato et al. 2001b), from Tiob (four orthologous loci), Tibi (three orthologous loci), to nine thraupini species with a single orthologous locus (table 1). Multiple nonthraupine species show no clearly orthologous sequences, with the single exception of the icterine Agph, which shares group 4 sequences. The pattern of shared groups suggests that several of the duplications leading to the DF repertoire occurred during the diversification of the Thraupini rather than during the adaptive radiation of the DFs. CF orthologs have not yet been found for groups 3.2, 2.4, 1.6, and 1.7. However, the divergence of DF-only groups from other groups (fig. 5) is sufficiently large to suggest that they too have arisen prior to the arrival on the Galapagos of the DFs an estimated 2.5 Ma. Orthologs might be found in more specialized surveys of the MHC or, alternatively, the loci might have been lost through deletion in some CF species.
Discussion
Genetic characterization of the MHC can range in scale from description of the polymorphisms of individual loci to consideration of the spectrum of variation between families. Although partial characterizations are available for many vertebrate species, complete information on arrangement of loci and families is available for only very few species. The problems of characterization are increased in consideration of rare or endangered species where source material is scarce. For that reason, we have attempted in DFs an approach that does not call for elaborate DNA preparation. We utilize extensive PCR and a wide variety of primers to obtain a wide range of exonic and intronic sequences covering a multitude of MHC genes. The variation found in DFs is then interpreted by comparison with related CF species and with the better characterized MHC of primates.
Despite the obstacles to an extensive molecular approach to understanding DF MHC, the comparative approach has yielded much information. The study reveals the existence of considerable variation in the DF MHC at the level of polymorphism and of locus diversity. The sequences obtained fall into 15 distinct groups representing probable loci and the divergences between loci can be as great as those found for primate MHC class II B families. However, the pattern of divergences is not as well defined as in primates, and much of the duplication process appears to have occurred more recently, particularly during the origin and divergence of the thraupine tribe. Beyond results specific to DFs and thraupini, the study establishes the orthology of loci across emberizine tribes and describes an intronic marker shared across avian orders that distinguishes two categories of MHC loci.
The data presented in this communication have implications for three areas of study: evolution of the MHC, evolution of DF, and speciation. In the first of these three areas, the data indicate high complexity of the MHC class II B region in the DF and related bird species. Although the resolution of the MHC organization in the DF will have to await the completion of their genome sequence, our data predict complexity of the finch MHC class II B region comparable with that of the human class II B region. The complexity consists in the multiplicity of loci, high polymorphism of some of the loci, and differentiation of the loci into subclasses. Multiplicity of DF class II B loci is indicated by family studies (Sato et al. 2000), as well as by the frequent observation of more than two sequences per individual bird (the range being from 3 to 14; supplementary table S1, Supplementary Material online) and by the occurrence of multiple clades on phylogenetic trees of MHC class II B exon 2 sequences. The evidence presented here indicates that each clade represents at least one locus, and the diversity of the individual clades implies that these loci are different from one another, some of them as much as the different subclasses of the HLA class II B region. Polymorphism of the loci is indicated by multiple sequences within each clade (locus). The only exception is the clade 5 locus, which is highly conserved in its evolution (Sato et al. 2001b). The complexity of the DF MHC class II B region is by no means exceptional in birds, for it is indicated by studies across a wide range of phylogenetic groups (Edwards et al. 1999). In this regard, the simple structure of the MHC in the domestic fowl (Kaufman et al. 1999) is an oddity.
The polymorphism of the MHC class II B loci in turn reveals important facets of the DF evolution. The polymorphism is clearly and almost universally transspecies. There is thus far no indication of alleles that could be considered species, genus, or even DF group specific. Alleles at the individual loci are widely shared among the different DF species, including the Cocos finch. Some of the allelic lineages (those in clades 2.5, 3.1, 3.3, 4, and 5) appear to be shared also with some of the CF species. In fact, the TSP is so rampant in the DFs that from the point of view of the MHC class II B exon 2 sequences, this whole bird group appears to be a single, genetically undifferentiated population. In this respect, the situation resembles strikingly that of the haplochromine cichlid fishes in Lake Victoria, East Africa. In the Lake Victoria haplochromine species “flock” polymorphisms at not only the MHC genes but also at mitochondrial DNA and at randomly sampled nuclear genes fail to differentiate the morphologically defined species (Klein et al. 2007; Samonte et al. 2007).
This brings us to the third implication of the present study. The implication is that, like the haplochromine fishes in Lake Victoria, the DFs on the Galapagos and Cocos islands are in the midst of adaptive radiations, in which morphological differentiation into species is running ahead of genetic differentiation in genetic systems such as the MHC genes or the mitochondrial DNA (Sato et al. 1999). The radiations are so young that there has not been enough time to sort out polymorphisms at most of the loci among the morphologically differentiating species. The persistence of unsorted polymorphisms is aided by interbreeding between the morphologically diverging species. Evidence for such interbreeding has been reported for both the DFs (Grant PR and Grant BR 1994; Grant et al. 2004) and the Lake Victoria haplochromines (Samonte et al. 2007). In the DFs, the rounds of radiation now observed in the ground and the tree finches are probably subsequent to the initial radiation from the founding flock that might have reached the Galapagos Archipelago some 2.5 Ma (Vincek et al. 1997). It would appear from the extent of the TSP in these groups that this new round of radiation is of a younger age.
Supplementary Material
Supplementary tables S1 and figures S1–S4 are available at Molecular Biology and Evolution online (http://www.mbe.oxfordjournals.org/).
Acknowledgments
The experimental part of this research was carried out at the now defunct Max-Planck Institut für Biologie, Abteilung Immungenetik, Tübingen, Germany. Drs. Nikolas Nikolaidis and Dimitra Chalkia were involved in the early stage of the analysis on this study. This project has been funded in whole or in part with Federal funds from the National Cancer Institute, National Institutes of Health, under contract HHSN261200800001E. The content of this publication does not necessarily reflect the views or policies of the Department of Health and Human Services, nor does it mention trade names, commercial products, or organizations imply endorsement by the US Government.
References
- Arden B, Klein J. Biochemical comparison of major histocompatibility complex molecules from different subspecies of Mus musculus: evidence for trans-specific evolution of alleles. Proc Natl Acad Sci USA. 1982;79:2342–2346. doi: 10.1073/pnas.79.7.2342. [DOI] [PMC free article] [PubMed] [Google Scholar]
- Bingulac-Popovic J, Figueroa F, Sato A, Talbot WS, Johnson SL, Gates M, Postlethwait JH, Klein J. Mapping of mhc class I and class II regions to different linkage groups in the zebrafish, Danio rerio. Immunogenetics. 1997;46:129–134. doi: 10.1007/s002510050251. [DOI] [PubMed] [Google Scholar]
- Edwards SV, Gasper J, March M. Genomics and polymorphism of Agph-DAB1, an Mhc class II B gene in red-winged blackbirds (Agelaius phoeniceus) Mol Biol Evol. 1998;15:236–250. doi: 10.1093/oxfordjournals.molbev.a025921. [DOI] [PubMed] [Google Scholar]
- Edwards SV, Hess CM, Gasper J, Ganigan D. Toward an evolutionary genomics of the avian Mhc. lmmunol Rev. 1999;167:119–132. doi: 10.1111/j.1600-065x.1999.tb01386.x. [DOI] [PubMed] [Google Scholar]
- Felsenstein J. 1993 PHYLIP Phylogeny inference package. Available from: ( http://evolution.genetics.washington.edu/phylip/) [Google Scholar]
- Freeland JR, Boag PT. The mitochondrial and nuclear genetic homogeneity of the phenotypically diverse Darwin’s ground finches. Evolution. 1999a;53:1553–1563. doi: 10.1111/j.1558-5646.1999.tb05418.x. [DOI] [PubMed] [Google Scholar]
- Freeland JR, Boag PT. Phylogenetics of Darwin’s finches: paraphyly in the tree finches, and two divergent lineages in the warbler finch. Auk. 1999b;116:577–587. [Google Scholar]
- Grant PR. Ecology and evolution of Darwin’s finches. Princeton (NJ): Princeton University Press; 1986. [Google Scholar]
- Grant PR, Grant BR. Phenotype and genetic effects of hybridization in Darwin’s finches. Evolution. 1994;48:297–316. doi: 10.1111/j.1558-5646.1994.tb01313.x. [DOI] [PubMed] [Google Scholar]
- Grant PR, Grant BR, Markert JA, Keller LF. Convergent evolution of Darwin’s finches caused by hybridization and selection. Evolution. 2004;58:1588–1599. doi: 10.1111/j.0014-3820.2004.tb01738.x. [DOI] [PubMed] [Google Scholar]
- Helm-Bychowski KM, Wilson AC. Rates of nuclear DNA evolution in pheasant-like birds: evidence from restriction maps. Proc Natl Acad Sci U S A. 1986;83:688–692. doi: 10.1073/pnas.83.3.688. [DOI] [PMC free article] [PubMed] [Google Scholar]
- Hess CM, Gasper J, Hoekstra HE, Hill CE, Edwards SV. MHC class II pseudogene and genomic signature of a 32-kb cosmid in the house finch (Carpodacus mexicanus) Genome Res. 2000;10:613–623. doi: 10.1101/gr.10.5.613. [DOI] [PMC free article] [PubMed] [Google Scholar]
- Hosomichi K, Shiina T, Suzuki S, et al. (11 co-authors) The major histocompatibility complex (Mhc) class IIB region has greater genomic structural flexibility and diversity in the quail than the chicken. BMC Genomics. 2006;21(7):322. doi: 10.1186/1471-2164-7-322. [DOI] [PMC free article] [PubMed] [Google Scholar]
- Kaufman J, Milne S, Göbel TW, Walker BA, Jacob JP, Auffray C, Zoorob R, Beck S. The chicken B locus is a minimal essential major histocompatibility complex. Nature. 1999;401:923–925. doi: 10.1038/44856. [DOI] [PubMed] [Google Scholar]
- Kelley J, Walter L, Trowsdale J. Comparative genomics of major histocompatibility complexes. Immunogenetics. 2005;56:683–695. doi: 10.1007/s00251-004-0717-7. [DOI] [PubMed] [Google Scholar]
- Klein D, Ono H, O’hUigin C, Vincek V, Goldschmidt T, Klein J. Extensive MHC variability in cichlid fishes of Lake Malawi. Nature. 1993;364:330–334. doi: 10.1038/364330a0. [DOI] [PubMed] [Google Scholar]
- Klein J. Generation of diversity at MHC loci: implications for T-cell receptor repertoires. In: Fougereau M, Dausset J, editors. Immunology. Vol. 80. London: Academic Press; 1980. pp. 239–253. [Google Scholar]
- Klein J, Hořejší V. Immunology. 2nd ed. Oxford: Blackwell; 1997. pp. 146–149. [Google Scholar]
- Klein J, O'hUigin C. Class II B Mhc motifs in an evolutionary perspective. Immunol Rev. 1995;143:89–111. doi: 10.1111/j.1600-065x.1995.tb00671.x. [DOI] [PubMed] [Google Scholar]
- Klein J, Sato A, Nikolaidis N. MHC, TSP, and the origin of species: from immunogenetics to evolutionary genetics. Annu Rev Genet. 2007;41:281–304. doi: 10.1146/annurev.genet.41.110306.130137. [DOI] [PubMed] [Google Scholar]
- Klicka J, Burns K, Spellman GM. Defining a monophyletic Cardinalini: a molecular perspective. Mol Phylogenet Evol. 2007;45:1014–1032. doi: 10.1016/j.ympev.2007.07.006. [DOI] [PubMed] [Google Scholar]
- Kulski JK, Shiina T, Anzai T, Kohara S, Inoko H. Comparative genomic analysis of the MHC: the evolution of class I duplication blocks, diversity and complexity from shark to man. Immunol Rev. 2002;190:95–122. doi: 10.1034/j.1600-065x.2002.19008.x. [DOI] [PubMed] [Google Scholar]
- Lack D. Darwin’s finches. Cambridge (MA): Cambridge University Press; 1947. [Google Scholar]
- Ohno S. Evolution by gene duplication. Berlin (Germany): Springer-Verlag; 1970. [Google Scholar]
- Petren K, Grant BR, Grant PR. A phylogeny of Darwin’s finches based on microsatellite DNA variation. Proc R Soc Lond B Biol Sci. 1999;266:321–329. [Google Scholar]
- Petren K, Grant PR, Grant BR, Keller LF. Comparative landscape genetics and the adaptive radiation of Darwin’s finches: the role of peripheral isolation. Mol Ecol. 2005;14:2943–2957. doi: 10.1111/j.1365-294X.2005.02632.x. [DOI] [PubMed] [Google Scholar]
- Robinson J, Mistry K, McWilliam H, Lopez R, Marsh SG. IPD—the Immuno Polymorphism Database. Nucleic Acids Res. 2010;38(Database issue):D863–D869. doi: 10.1093/nar/gkp879. [DOI] [PMC free article] [PubMed] [Google Scholar]
- Samonte IE, Satta Y, Sato A, Tichy H, Takahata N, Klein J. Gene flow between species of Lake Victoria haplochromine fishes. Mol Biol Evol. 2007;24:2069–2080. doi: 10.1093/molbev/msm138. [DOI] [PubMed] [Google Scholar]
- Sato A, Figueroa F, Mayer WE, Grant PR, Grant BR, Klein J. Mhc class II genes of Darwin’s finches: divergence by point mutations and reciprocal recombination. In: Kasahara M, editor. Major histocompatibility complex: evolution, structure, and function. Tokyo (Japan): Springer; 2000. pp. 518–541. [Google Scholar]
- Sato A, Mayer WE, Tichy H, Grant PR, Grant BR, Klein J. Evolution of Mhc class II B genes in Darwin’s finches and their closest relatives: birth of a new gene. Immunogenetics. 2001b;53:792–801. doi: 10.1007/s00251-001-0393-9. [DOI] [PubMed] [Google Scholar]
- Sato A, O'hUigin C, Figueroa F, Grant PR, Grant BR, Tichy H, Klein J. Phylogeny of Darwin’s finches as revealed by mtDNA sequences. Proc Natl Acad Sci USA. 1999;96:5101–5106. doi: 10.1073/pnas.96.9.5101. [DOI] [PMC free article] [PubMed] [Google Scholar]
- Sato A, Tichy H, O'hUigin C, Grant PR, Grant BR, Klein J. On the origin of Darwin’s finches. Mol Biol Evol. 2001a;18:299–311. doi: 10.1093/oxfordjournals.molbev.a003806. [DOI] [PubMed] [Google Scholar]
- Sibley CG, Ahlquist JE. Phylogeny and classification of birds: a study in molecular evolution. New Haven (CT): Yale University Press; 1990. [Google Scholar]
- Swofford DL. PAUP: phylogenetic analysis using parsimony. Version 4. Sunderland (MA): Sinauer; 1998. [Google Scholar]
- Tamura K, Dudley J, Nei M, Kumar S. MEGA4: Molecular Evolutionary Genetics Analysis (MEGA) software version 4.0. Mol Biol Evol. 2007;24:1596–1599. doi: 10.1093/molbev/msm092. [DOI] [PubMed] [Google Scholar]
- Thompson JD, Higgins DG, Gibson TJ. CLUSTAL W: improving the sensitivity of progressive multiple sequence alignment through sequence weighting, position-specific gap penalties and weight matrix choice. Nucleic Acids Res. 1994;22:4673–4680. doi: 10.1093/nar/22.22.4673. [DOI] [PMC free article] [PubMed] [Google Scholar]
- Vincek V, O'hUigin C, Satta Y, Takahata N, Boag PT, Grant PR, Grant BR, Klein J. How large was the founding population of Darwin’s finches? Proc R Soc Lond. 1997;264:111–118. [Google Scholar]
Associated Data
This section collects any data citations, data availability statements, or supplementary materials included in this article.