Abstract
Oral mucosa progenitor/stem cells reside as a small-sized cell population that eventually differentiates concurrently with an increase in cell size. Activation of the mammalian target of rapamycin (mTOR) leads to an increase in cell size. We hypothesized that rapamycin, a specific inhibitor of mTOR, will maintain primary human oral keratinocytes as a small-sized, undifferentiated cell population capable of retaining their proliferative capacity. Primary, rapamycin-treated (2 nM, 20 nM) oral keratinocytes showed a diminished cell size that correlated with a higher clonogenicity, a longer-term proliferative potential, and a slower cycling cell population concurrent with decreased expression of a differentiation marker when compared with untreated cells. Only the 2-nM rapamycin-treated oral keratinocytes maintained their ability to regenerate oral mucosa in vitro after 15 weeks of culture. Rapamycin, a Food and Drug Administration-approved drug, may have applicability for use in creating a highly proliferative cell population for use in regenerative medicine.
Keywords: oral keratinocyte, progenitor/stem cell, mTOR, rapamycin
Introduction
We have identified a population of adult human oral mucosa progenitor/stem cells that are small-sized and have the capacity to form, ex vivo, human oral mucosa (Izumi et al., 2003, 2007). Others have shown the importance of adult stem cells in gene therapy (Garlick and Fenjves, 1996) and regenerative medicine (Mooney and Vandenburgh, 2008) requiring the isolation and/or identification and amplification of a progenitor/stem cell population. Investigators have successfully created tagged or genetically modified long-term oral keratinocyte cell lines for investigational use (Kirschner et al., 2006; Kim et al., 2007); however, the modified cells do not pass the regulatory guidelines of the Food and Drug Administration (FDA) because of their questionable safety. The best approach to the culture and expansion of progenitor/stem cells for therapeutic use under FDA regulatory guidelines would be either physical separation and/or pharmacologic manipulation (Nakashima et al., 2004). In this study, we show expansion and maintenance of progenitor/stem cell proliferative capability through pharmacologic manipulation.
The mammalian target of rapamycin (mTOR) can control cell proliferation and size (growth) (Inoki et al., 2005; Wullschleger et al., 2006). Inhibition of mTOR activity by rapamycin, a specific inhibitor of mTOR, gives rise to a significant reduction in the size of a variety of mammalian cells in culture (Fingar et al., 2002; Raslova et al., 2006; Lamouille and Derynck, 2007). We have shown that mTOR activity is innately inhibited in the basal layer cells of normal keratinized oral mucosal epithelium by the absence of the expression of phosphorylated-ribosomal S6 protein (p-S6) (Fig 1A), which is phosphorylated in the superficial layers of differentiated cells, indicating an activation of the mTOR pathway. We hypothesized that rapamycin, via its inactivation of mTOR, will maintain primary cultured normal human oral keratinocytes (NHOK) as a small-sized, undifferentiated cell population capable of retaining their proliferative capacity. We examined cell size, proliferative capacity, differentiation marker expression, and regenerative ability of rapamycin-treated NHOK.
Figure 1.
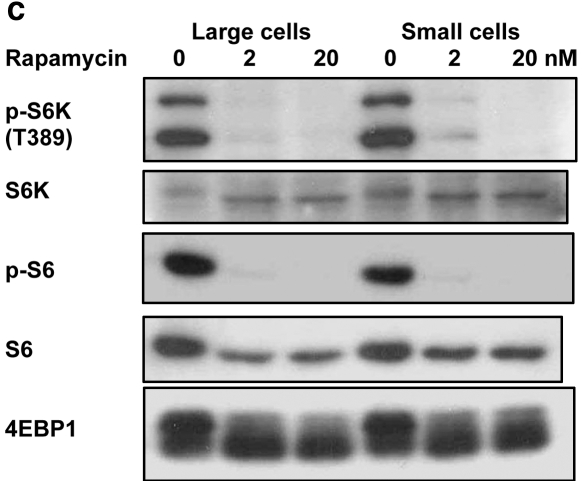
In vivo expression of phosphorylated-ribosomal S6 protein (p-S6) (A) and ribosomal S6 protein (S6) (B) in the epithelial layer of keratinized oral mucosa (palate). (A) At the bottom half of the rete ridge, p-S6 expression was absent in the basal cell layer as well as in the cells a few layers above the basal cells. At the top half of the rete ridge, several basal cells expressed p-S6, but the others did not. P-S6 expression was present in the rest of the suprabasal layer cells except the superficial keratinized layer. (B) S6 was expressed in all of the epithelial cells except the superficial keratinized layer. (C) Western blotting: Phosphorylated-ribosomal protein S6 kinase (p-S6K) and p-S6 were inhibited by rapamycin treatment (2 and 20 nM) for 5 days in both large and small cells. Eukaryotic initiation factor 4E binding protein 1 (4EBP1) was also inhibited by rapamycin treatment, as determined by electrophoretic mobility. S6K: ribosomal protein S6 kinase.
Materials & Methods
Procurement of Human Oral Mucosa
Discarded keratinized oral mucosa was collected from individuals undergoing minor oral surgery procedures. The Institutional Review Board approved use of the mucosa, and donors provided informed consent for research use.
Immunohistochemistry
We used paraffin-embedded keratinized oral mucosal tissue, using rabbit monoclonal p-S6 and ribosomal S6 protein (S6) antibodies (1:200) (Cell Signaling Technology, Danvers, MA, USA) (details in Appendix 1). Human breast carcinoma served as the positive control, while omission of primary antibodies was the negative control.
Primary Oral Keratinocytes and Serial Cultures
Primary oral keratinocyte cultures were established and cells serially subcultured as described previously (Izumi et al., 2007). Serial subcultured, harvested cells were counted by microscopy, with trypan blue used to exclude non-viable cells, then re-plated at a density of 0.6-1.0 x 10⁴ cells/cm2 with Epilife® supplemented with growth factors and 0.06 mM Ca2+ (INVITROGEN Co., Carlsbad, CA, USA). Cells from passages 2-4 (25-35 days in culture) were used for sorting.
Gravity-assisted Cell Sorting (GACS)
We used a serial passive filtration system consisting of nylon filters of two different pore sizes (Millipore, Billerica, MA, USA) to sort an oral keratinocyte progenitor/stem cell population efficiently. NHOKs were sorted into a “small cells” group, which was enriched in progenitor/stem cells that passed through both 30-μm and 20-μm filters, while “large cells” were trapped by a 30-μm filter (details in Appendix 2). The 30-μm filter removed the differentiated cells, while the 20-μm filter allowed the “putative” progenitor/stem cells to pass through, since their size was less than 20 μm (Barrandon and Green, 1987).
Post-GACS Serial Passage to Determine Long-term Proliferative Potential (LTPP)
Large and small cells were plated into 3 wells (1 x 10⁵ cells/well) of 6-well plates. After 24 hrs, cells were fed with medium containing 3 different concentrations of rapamycin (LC Laboratories, Woburn, MA, USA), 0 [vehicle control (0.1% absolute ethanol)], 2, or 20 nM. Medium was changed every 3 days. When 1 well reached 80% confluence, all were simultaneously harvested. Quantities of cells (1x10⁵) from 6 groups were re-plated, and serial passage continued in the same manner until cell proliferation was exhausted. Exhaustion was determined when (1) viable cell number was under 5 x 10⁴, (2) cell numbers decreased in 2 consecutive passages, or (3) cells did not reach 50% confluence after 28 days in culture. Cumulative population-doublings from ten individuals were calculated during serial passages.
Colony-forming Efficiency (CFE)
CFE was performed as described previously (Izumi et al., 2007) with the following modifications: plating density of 1 x 10³ cells/well (in triplicate, 6-well plate) and 14 days in culture. CFE was performed at 2 different times, immediately after GACS and after 12-16 days’ treatment of GACS cells with rapamycin.
Antibodies and Immunoblotting
To assess the efficacy of inhibition of mTOR with rapamycin, we obtained anti-phosphorylated-ribosomal protein S6 kinase (p-S6K), ribosomal protein S6 kinase (S6K), p-S6, S6, and eukaryotic initiation factor 4E binding protein (4EBP)1 rabbit monoclonal antibodies from Cell Signaling Technology Inc. Cells underwent lysis in buffer (10 mM Tris-HCl [pH 7.5], 100 mM sodium chloride, 1% NP-40, 50 mM sodium fluoride, 2 mM EDTA, 1 mM dithiothreitol, 10 μg/mL leupeptin, and aprotinin). Lysates were centrifuged at 11,000 g for 10 min at 4°C. Ten or 12.5% SDS-polyacrylamide gel and immunoblots (1:1000) were performed on protein fractions, and bands were visualized with a chemiluminescence reagent (Pierce, Rockford, IL, USA).
Fluorescence-activated Cell-sorting (FACS) Analysis
Peroxisome proliferator-activated receptor gamma (PPARγ) is directly associated with epithelial differentiation (Westergaard et al., 2003). Cells harvested from 6 different groups and cultured for 16-26 days without or with rapamycin were fixed with 70% ice-cold ethanol. The percentage of PPARγ expressed cells and DNA content were determined as described previously (Izumi et al., 2007). It has been reported (Kaur, 2006) that stem and transit-amplifying cell populations from freshly isolated skin keratinocytes expressed the differential patterns of CD71low and CD71high with integrin α6high. To analyze those surface markers, we incubated oral keratinocytes, 9-16 days in culture, with FITC-conjugated anti-integrin α6 (BD Biosciences, San Diego, CA, USA), followed by phycoerythrin (PE)-conjugated anti-CD71 (Santa Cruz Biotechnology, Santa Cruz, CA, USA) antibodies. We used 7-amino actinomycin D (BD Biosciences) to eliminate non-viable cells before analysis. Isotope-matched normal rat IgG2a-FITC and mouse IgG1-PE were used as negative controls. FACSCalibur, FACSVantage, CellQuest (BD Biosciences, Mountain View, CA, USA), and ModFit software (Verity Software House, Topsham, ME, USA) was used for analysis.
Regenerative Ability
Cells cultured for 4 wks (number of samples [N] = 3) without rapamycin and for 4 (N = 3), 9 (N = 2), and 15 (N = 1) wks with rapamycin were examined for their regenerative ability by the fabrication of an ex vivo-produced oral mucosa equivalent (EVPOME). 1.25 x 10⁵ cells were seeded onto the basement membrane side of a circular piece of AlloDerm® (1 cm2) (LifeCell Corp., Branchburgh, NJ, USA) with 1.2 mM Ca2+ culture medium and cultured submerged for 4 days. After 24 hrs of culture, rapamycin was added to the medium in rapamycin-treated cells in cell groups that had either been untreated or previously treated with rapamycin. EVOPMEs were then raised to the air-liquid interface, cultured for another 7 days, and fixed with 10% formalin. 5-μm paraffin-embedded sections of EVPOMEs were cut and stained with hematoxylin and eosin for histological examination.
Statistical Analysis
Statistical analysis was undertaken with Stata 9.2 (StataCorp LP, College Station, TX, USA), with the linear mixed-effects model to account for the repeating nature of the data.
Results
In vivo Expression Patterns of mTOR Downstream Substrates
P-S6 was expressed only in the suprabasal layer of keratinized oral mucosa (Fig. 1A). In contrast, S6 was expressed in all layers of the epithelium (Fig. 1B).
Western Blotting
We determined mTOR activity by monitoring the phosphorylation status of S6 kinase, S6, and 4EBP1. Rapamycin treatment (2, 20 nM) inhibited mTOR activity in large and small cells (Fig. 1C). Inhibition of 4EBP1 phosphorylation was indicated by changes in electrophoretic mobility.
LTPP with Rapamycin-treated and Untreated (control) Cells
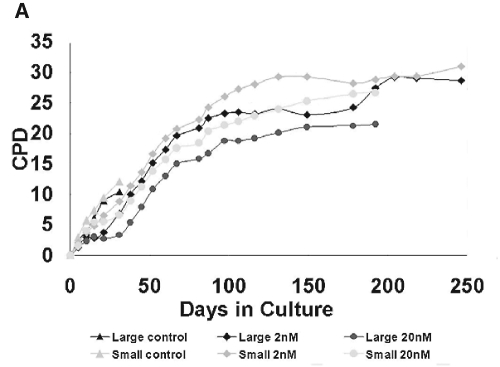
During the first passage, the small control cells produced the highest LTPP among the 6 groups (Appendix Fig. 3A). During the second passage, the rapamycin-treated cell population equaled the control cell number. By the fourth passage, all 4 rapamycin-treated cell groups outnumbered both the control large and small cells, and showed a decrease in cell size (Appendix Fig. 3B). A representative proliferation curve is shown in Fig. 2A. All 4 rapamycin-treated cells showed a LTPP and enhanced replicative lifespan over those of control cell populations (Appendix Table 1).
Figure 2.
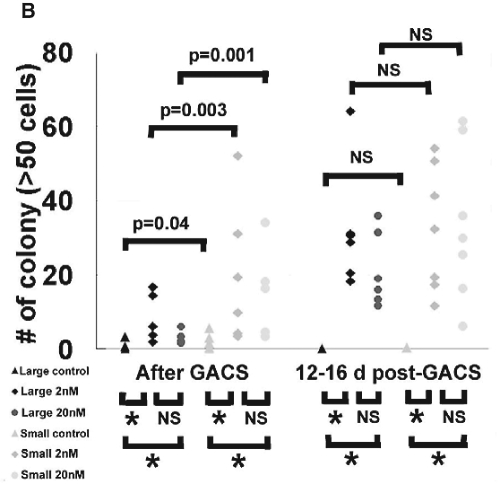
Functional assays of human oral keratinocyte progenitor/stem cells. (A) Representative proliferation curve during serial passages. Rapamycin-treated cells (2, 20 nM), both large and small, showed a significantly longer lifespan while having a short “lag phase” of proliferation during the first 2-4 passages. In contrast, control cells of both cell sizes proliferated faster than rapamycin-treated cells. However, after certain days in culture, their proliferation was unable to catch up to that of rapamycin-treated cells and eventually became exhausted. (B) Distribution of number of colonies consisting of greater than 50 cells in control and rapamycin-treated cells of large and small sizes. Colony-forming Efficiency (CFE) began immediately after Gravity-assisted Cell Sorting (GACS) (left) and after 12-16 days’ treatment of GACS cells with rapamycin (right) (number of samples [N] = 7). *Indicates that p value is equal to or smaller than 0.001. NS indicates non-significant. Differences in the colony number were determined by linear mixed model. Compared with control cells, the number of colonies in large and small cells with rapamycin treatment (2, 20 nM) was markedly larger at two different times. Compared with LG cells, colony numbers of both rapamycin-untreated and -treated cells were significantly larger in small cells when CFE began immediately after GACS, but this significance disappeared when CFE began at 12-16 days after GACS. Compared with CFE begun immediately after GACS, the number of colonies increased in large and small cells with rapamycin treatment when CFE began at 12-16 days after GACS, while it decreased in control cells.
Colony-forming Efficiency (CFE)
Results showed a highly significant capacity of all 4 rapamycin-treated cell groups to give rise to a greater number of larger colonies (Fig. 2B). The difference in clonogenicity normally seen between the large and small cells was eliminated by rapamycin treatment. Cells also showed a higher clonogenicity with rapamycin treatment for 12-16 days before the start of CFE.
FACS Analysis
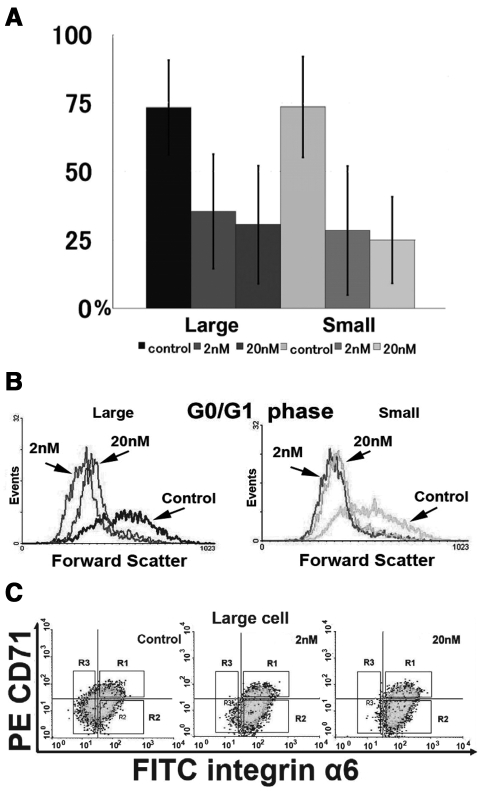
PPARγ expression was significantly lower in 4 groups of rapamycin-treated cells (Fig. 3A), and the ratios of all 4 rapamycin-treated cell groups in the G0/G1 and G2/M phases were significantly different (Appendix Table 2) compared with those of control cells. The effect of rapamycin on cell size was determined by shifts in forward scattering. All 4 rapamycin-treated cell groups significantly diminished the sizes of cells in the G0/G1 phase (p < 0.001) (Fig. 3B). This effect was not due to an alteration in cell cycle, because rapamycin diminished the sizes of cells in the G2/M phase. The surface marker analysis revealed an approximately two-fold increase in the proportion of α6bri/CD71dim cells (gate R2) by rapamycin treatment (Fig. 3C).
Figure 3.
FACS analyses of rapamycin-treated normal human oral keratinocytes. (A) The percentages of control and rapamycin-treated (2- and 20-nM) cells that expressed PPARγ (N = 7). Error bar indicates standard deviation. There was statistical significance between control cells and both 2- and 20-nM rapamycin-treated cells in each cell size group on PPARγ expression (p < 0.001), while there was no statistical significance between 2- and 20-nM rapamycin-treated cells in each cell size group. (B) Representative histogram of cell size as determined by FACS analysis. The size of the cells in the G0/G1 phase is shown. Rapamycin treatment (2, 20 nM) for 16-26 days in both large and small cells showed a significant decrease in cell size. (C) Representative FACS analysis (N = 4) for expression of integrin α6 and CD71 in control and rapamycin-treated (2 and 20 nM) large cells (N = 4). The gates of R1, R2, and R3 represent the subpopulations of α6bri/CD71dim, α6bri/CD71dim, and α6dim, respectively. In large control cells, the α6bri/CD71dim cell subpopulation accounts for 28.9% (gate R2). The α6bri/CD71dim subpopulation (gate R2) increased to 58.3% with 2 nM rapamycin treatment and to 57.6% with 20 nM rapamycin treatment.
Regenerative Ability
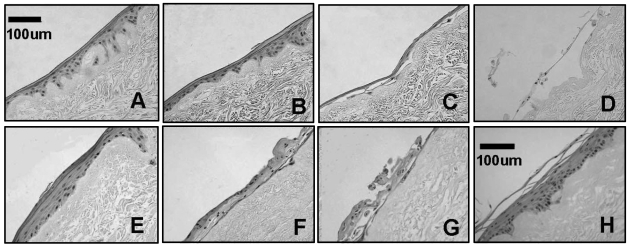
Large cells treated with 2 and 20 nM rapamycin for 4 wks formed a well-organized, highly differentiated epithelial layer (Figs. 4A, 4B). In contrast, large control cells either developed a poorly stratified layer (Fig. 4C) or failed to regenerate a mucosa (Fig. 4D), indicating that rapamycin treatment after seeding onto AlloDerm® did not restore regenerative ability. All 4 rapamycin-treated groups cultured for 9 wks showed a well-stratified mucosa (not shown). 2-nM rapamycin treatment for 15 wks still resulted in a well-structured epithelial layer on AlloDerm® (Fig. 4E), although cells with 20-nM rapamycin treatment for 15 wks appeared to develop a basal layer on AlloDerm®, but the stratification was disrupted (Figs. 4F, 4G). Small cells showed similar histological findings (not shown). A representative EVPOME produced by unsorted, passage 2 cells is shown in Fig. 4H.
Figure 4.
Histology of day 11 EVPOME fabricated by large cells without or with rapamycin treatment. Hematoxylin-eosin staining. EVPOME histology of small cells similar to those is not shown. (A) 2-nM rapamycin treatment for 4 wks in a monolayer culture condition + 11days at an air-liquid (A/L) interface without rapamycin treatment. (B) 20-nM rapamycin treatment for 4 wks + 11 days at A/L interface without rapamycin treatment. (C) No rapamycin treatment (control) for 4 wks + 11 days at A/L interface without rapamycin treatment. (D) No rapamycin treatment (control) for 4 wks + 11 days at A/L interface with 20-nM rapamycin treatment. (E) 2-nM rapamycin treatment for 15 wks + 11 days at A/L interface without rapamycin treatment. (F) 20-nM rapamycin treatment for 15 wks + 11 days at A/L interface without rapamycin treatment. (G) 20-nM rapamycin treatment for 15 wks + 11 days at A/L interface with 20-nM rapamycin treatment. (H) Representative histology of day 11 EVPOME produced by unsorted, passage 2 cells (13 days + 11 days at A/L interface).
Discussion
What initially led to our hypothesis was the observation that the keratinized oral mucosa basal cells, which are small, lacked expression of p-S6, a putative regulator of cell size (Lee et al., 2007). Because the basal cells are small and are thought to harbor or contain progenitor/stem cells, activation of mTOR may be directly correlated with the state of cell differentiation as well as with its size (Potten and Booth, 2002). We tested this hypothesis by treating primary NHOK cells with rapamycin, a specific inhibitor of mTOR.
Our present study showed inhibition of phosphorylation of S6K, S6, and 4EBP1 on cultured NHOK by 2- and 20-nM doses of rapamycin, the classic mTOR inhibitor, for 5 days. This result indicated that mTOR activity was blocked, which is consistent with the in vivo expression pattern. Inhibition by rapamycin led to a significant decrease in cell size of the rapamycin-treated cell population, while the control population showed a range of cell sizes, a greater portion consisting of larger-sized cells. Analysis of our data shows that rapamycin induced small-sized populations with decreased proliferative rates during the first few passages. Others have reported that the reduction of protein synthesis by rapamycin treatment resulted in prolongation of the G1 phase in cells, followed by a gradual adjustment in cell size over several cycles (Dolznig et al., 2004). Thus, the slow proliferation seen in rapamycin-treated cells in our studies can be explained by the smaller cells in an extended G1 phase, requiring longer to reach a critical size to enter the S phase. This conclusion is supported by our cell-cycle analysis.
The CFE confirmed that rapamycin-treated cells exhibited an increase in clonogenicity when compared with control cells, resulting in similar behavior in both large and small cells. The longer the cells were rapamycin-treated, the higher the clonogenic capacity, and the longer the life-span, secondary to an increase in cell-proliferative capacity. The proliferation rate in all 4 rapamycin-treated cell groups was slowed, but not suppressed, which is consistent with the study demonstrating a slow rate of proliferation in rapamycin-treated small-size Jurkat cells (Fumarola et al., 2005).
PPARγ expression, a keratinocyte differentiation marker, remained low in all 4 rapamycin-treated cell groups. This is similar to adipose tissue, where rapamycin prevents adipocyte differentiation in fat metabolism by inhibiting PPARγ expression (Kim and Chen, 2004).
Regeneration of an EVPOME with 2 nM rapamycin-treated cells showed an increased capacity to form an intact stratified epithelium with a more pronounced ability to regenerate an oral mucosa. In the 20-nM treatment group cultured for 15 wks, there was a disruption in the stratification of the cells, but they still maintained a basal-like layer consistent with normal tissue. 20-nM rapamycin treatment might have had an effect on epithelial differentiation by inhibition of the phosphoinositide 3-kinase/Akt pathway, through a feedback mechanism initiated by mTOR inhibition, thereby resulting in cell death in keratinocytes during stratification (Calautti et al., 2005; Wullschleger et al., 2006).
It would be ideal to isolate and expand, in vitro, a population of progenitor/stem cells to create cell-based devices such as EVPOMEs (Bianco and Robey, 2001). This is complicated, because cells grown in vitro exist in a wounding-like state, abrogating the in vivo stem cell niche (Lavker and Sun, 2000; Morrison and Spradling, 2008). In vitro growth of cells is usually a result of an increase in the transit-amplifying cell population, which can reconstitute a functional tissue (Potten and Booth, 2002; Parenteau et al., 2004). Thus, the rapamycin-treated cells could be transit-amplifying cells that have maintained their proliferative potential and ability to reconstitute an EVPOME. However, rapamycin-treated cells possessed the α6bri/CD71dim subpopulation, which suggests a “stem cell”-like phenotype (Youn et al., 2004; Croagh et al., 2007; Hayashi et al., 2008). Because NHOKs are grown in culture, not freshly isolated, this could represent an increase in a slow-cycling, young transit-amplifying cell population with progenitor/stem cell markers as a result of rapamycin treatment.
Our results appear to be contrary to those from recent molecular-targeted treatments in which rapamycin analogues were designed as anti-cancer drugs (Le Tourneau et al., 2007). The anti-proliferative effects in a head and neck squamous cell carcinoma (HNSCC) cell line were induced with a rapamycin micromolar dosage higher than that used in our study (Aissat et al., 2008). In contrast, a recent study revealed that a nanomolar dose of rapamycin did not have an anti-proliferative effect on HNSCC cell lines in vitro, but did induce apoptosis of cancer cells in vivo by the anti-angiogenic effects of rapamycin (Amornphimoltham et al., 2008).
In conclusion, rapamycin-treated NHOKs showed slower cell-cycling, an inhibition of differentiation, an increase in clonogenic capacity and LTPP, and a sustained ability to regenerate an oral mucosa in vitro. These findings may implicate the use of rapamycin in the pharmacologic manipulation of NHOK to retain them as a population of progenitor/stem cells.
Supplementary Material
Acknowledgments
We thank Junying Wang for technical assistance, Myra Kim for statistical analysis, and David Adams and Martin White for FACS operation.
Footnotes
A supplemental appendix to this article is published electronically only at http://jdr.sagepub.com/supplemental.
This work was supported by the National Institute of Dental and Craniofacial Research, Grant #DE 13417 (S.E.F).
References
- Aissat N, Le Tourneau C, Ghoul A, Serova M, Bieche I, Lokiec F, et al. (2008). Antiproliferative effects of rapamycin as a single agent and in combination with carboplatin and paclitaxel in head and neck cancer cell lines. Cancer Chemother Pharmacol 62:305-313 [DOI] [PubMed] [Google Scholar]
- Amornphimoltham P, Patel V, Leelahavanichkul K, Abraham RT, Gutkind JS. (2008). A retroinhibition approach reveals a tumor cell-autonomous response to rapamycin in head and neck cancer. Cancer Res 68:1144-1153 [DOI] [PMC free article] [PubMed] [Google Scholar]
- Barrandon Y, Green H. (1987). Three clonal types of keratinocyte with different capacities for multiplication. Proc Natl Acad Sci USA 84:2302-2306 [DOI] [PMC free article] [PubMed] [Google Scholar]
- Bianco P, Robey PG. (2001). Stem cells in tissue engineering. Nature 414:118-121 [DOI] [PubMed] [Google Scholar]
- Calautti E, Li J, Saoncella S, Brissette JL, Goetinck PF. (2005). Phosphoinositide 3-kinase signaling to Akt promotes keratinocyte differentiation versus death. J Biol Chem 280:32856-32865 [DOI] [PubMed] [Google Scholar]
- Croagh D, Phillips WA, Redvers R, Thomas RJ, Kaur P. (2007). Identification of candidate murine esophageal stem cells using a combination of cell kinetic studies and cell surface markers. Stem Cells 25:313-318 [DOI] [PubMed] [Google Scholar]
- Dolznig H, Grebien F, Sauer T, Beug H, Müllner EW. (2004). Evidence for a size-sensing mechanism in animal cells. Nat Cell Biol 6:899-905 [DOI] [PubMed] [Google Scholar]
- Fingar DC, Salama S, Tsou C, Harlow E, Blenis J. (2002). Mammalian cell size is controlled by mTOR and its downstream targets S6K1 and 4EBP1/eIF4E. Genes Dev 16:1472-1487 [DOI] [PMC free article] [PubMed] [Google Scholar]
- Fumarola C, La Monica S, Alfieri RR, Borra E, Guidotti GG. (2005). Cell size reduction induced by inhibition of the mTOR/S6K-signaling pathway protects Jurkat cells from apoptosis. Cell Death Differ 12:1344-1357 [DOI] [PubMed] [Google Scholar]
- Garlick JA, Fenjves ES. (1996). Keratinocyte gene transfer and gene therapy. Crit Rev Oral Biol Med 7:204-221 [DOI] [PubMed] [Google Scholar]
- Hayashi R, Yamato M, Saito T, Oshima T, Okano T, Tano Y, et al. (2008). Enrichment of corneal epithelial stem/progenitor cells using cell surface markers, integrin alpha6 and CD71. Biochem Biophys Res Commun 367:256-263 [DOI] [PubMed] [Google Scholar]
- Inoki K, Ouyang H, Li Y, Guan KL. (2005). Signaling by target of rapamycin proteins in cell growth control. Microbiol Mol Biol Rev 69:79-100 [DOI] [PMC free article] [PubMed] [Google Scholar]
- Izumi K, Feinberg SE, Iida A, Yoshizawa M. (2003). Intraoral grafting of an ex vivo produced oral mucosa equivalent: a preliminary report. Int J Oral Maxillofac Surg 32:188-197 [DOI] [PubMed] [Google Scholar]
- Izumi K, Tobita T, Feinberg SE. (2007). Isolation of human oral keratinocyte progenitor/stem cells. J Dent Res 86:341-346 [DOI] [PubMed] [Google Scholar]
- Kaur P. (2006). Interfollicular epidermal stem cells: identification, challenges, potential. J Invest Dermatol 126:1450-1458 [DOI] [PubMed] [Google Scholar]
- Kim JE, Chen J. (2004). Regulation of peroxisome proliferator-activated receptor-gamma activity by mammalian target of rapamycin and amino acids in adipogenesis. Diabetes 53:2748-2756 [DOI] [PubMed] [Google Scholar]
- Kim RH, Kang MK, Shin KH, Oo ZM, Han T, Baluda MA, et al. (2007). Bmi-1 cooperates with human papillomavirus type 16 E6 to immortalize normal human oral keratinocytes. Exp Cell Res 313:462-472 [DOI] [PubMed] [Google Scholar]
- Kirschner M, Montazem A, Hilaire HS, Radu A. (2006). Long-term culture of human gingival keratinocyte progenitor cells by down-regulation of 14-3-3 sigma. Stem Cells Dev 15:556-565 [DOI] [PubMed] [Google Scholar]
- Lamouille S, Derynck R. (2007). Cell size and invasion in TGF-beta-induced epithelial to mesenchymal transition is regulated by activation of the mTOR pathway. J Cell Biol 178:437-451 [DOI] [PMC free article] [PubMed] [Google Scholar]
- Lavker RM, Sun TT. (2000). Epidermal stem cells: properties, markers, and location. Proc Natl Acad Sci USA 97:13473-13475 [DOI] [PMC free article] [PubMed] [Google Scholar]
- Le Tourneau C, Faivre S, Siu LL. (2007). Molecular targeted therapy of head and neck cancer: review and clinical development challenges. Eur J Cancer 43:2457-2466 [DOI] [PubMed] [Google Scholar]
- Lee CH, Inoki K, Guan KL. (2007). mTOR pathway as a target in tissue hypertrophy. Annu Rev Pharmacol Toxicol 47:443-467 [DOI] [PubMed] [Google Scholar]
- Mooney DJ, Vandenburgh H. (2008). Cell delivery mechanisms for tissue repair. Cell Stem Cell 2:205-213 [DOI] [PubMed] [Google Scholar]
- Morrison SJ, Spradling AC. (2008). Stem cells and niches: mechanisms that promote stem cell maintenance throughout life. Cell 132:598-611 [DOI] [PMC free article] [PubMed] [Google Scholar]
- Nakashima K, Colamarino S, Gage FH. (2004). Embryonic stem cells: staying plastic on plastic. Nat Med 10:23-24 [DOI] [PubMed] [Google Scholar]
- Parenteau NL, Rosenberg L, Hardin-Young J. (2004). The engineering of tissues using progenitor cells. Curr Top Dev Biol 64:101-139 [DOI] [PubMed] [Google Scholar]
- Potten CS, Booth C. (2002). Keratinocyte stem cells: a commentary. J Invest Dermatol 119:888-899 [DOI] [PubMed] [Google Scholar]
- Raslova H, Baccini V, Loussaief L, Comba B, Larghero J, Debili N, et al. (2006). Mammalian target of rapamycin (mTOR) regulates both proliferation of megakaryocyte progenitors and late stages of megakaryocyte differentiation. Blood 107:2303-2310 [DOI] [PubMed] [Google Scholar]
- Westergaard M, Henningsen J, Johansen C, Rasmussen S, Svendsen ML, Jensen UB, et al. (2003). Expression and localization of peroxisome proliferator-activated receptors and nuclear factor kappaB in normal and lesional psoriatic skin. J Invest Dermatol 121:1104-1117 [DOI] [PubMed] [Google Scholar]
- Wullschleger S, Loewith R, Hall MN. (2006). TOR signaling in growth and metabolism. Cell 124:471-484 [DOI] [PubMed] [Google Scholar]
- Youn SW, Kim DS, Cho HJ, Jeon SE, Bae IH, Yoon HJ, et al. (2004). Cellular senescence induced loss of stem cell proportion in the skin in vitro. J Dermatol Sci 35:113-123 [DOI] [PubMed] [Google Scholar]
Associated Data
This section collects any data citations, data availability statements, or supplementary materials included in this article.


