

Abstract
The purpose of this study was to determine the role of saliva-derived biomarkers and periodontal pathogens during periodontal disease progression (PDP). One hundred human participants were recruited into a 12-month investigation. They were seen bi-monthly for saliva and clinical measures and bi-annually for subtraction radiography, serum and plaque biofilm assessments. Saliva and serum were analyzed with protein arrays for 14 pro-inflammatory and bone turnover markers, while qPCR was used for detection of biofilm. A hierarchical clustering algorithm was used to group study participants based on clinical, microbiological, salivary/serum biomarkers, and PDP. Eighty-three individuals completed the six-month monitoring phase, with 44 exhibiting PDP, while 39 demonstrated stability. Participants assembled into three clusters based on periodontal pathogens, serum and salivary biomarkers. Cluster 1 members displayed high salivary biomarkers and biofilm; 82% of these individuals were undergoing PDP. Cluster 2 members displayed low biofilm and biomarker levels; 78% of these individuals were stable. Cluster 3 members were not discriminated by PDP status; however, cluster stratification followed groups 1 and 2 based on thresholds of salivary biomarkers and biofilm pathogens. The association of cluster membership to PDP was highly significant (p < 0.0002). The use of salivary and biofilm biomarkers offers potential for the identification of PDP or stability (ClinicalTrials.gov number, CT00277745).
Keywords: periodontal disease, pro-inflammatory biomarkers, saliva, periodontal pathogens, diagnosis, salivary diagnostics
Introduction
Periodontal disease is a mixed oral infection initiated by a milieu of virulent subgingival bacteria. Once exposed to pathogenic bacteria and their by-products, host-derived local inflammatory mediators are triggered and overexpressed (Darveau, 2010). In turn, a cascade of events leading to the clinical signs and deleterious effects of periodontal disease is activated (Kornman, 2008). Currently, periodontal diagnostic methods are limited to the evaluation of only parameters assessing periodontal destruction. Despite their ease of use, these parameters fail to provide a real-time assessment of the disease and offer limited, if any, prognostic value (Giannobile et al., 2009).
Supplemental qualitative and quantitative diagnostic assessment tools have been developed using saliva for disease recognition and prediction. Oral-fluid-based tests have detected the presence of periodontopathogens and their associated host-derived enzymes, inflammatory mediators, and tissue breakdown products (Eley and Cox, 1996; Loesche et al., 1997; Bassim et al., 2008). However, given the complex nature of periodontal disease, it is unlikely that a sole biomarker exists for disease detection and disease prediction (Taba et al., 2005; Loo et al., 2010). Our group recently identified and reported clusters of salivary analytes that have the capability to differentiate disease status accurately (Ramseier et al., 2009).
Despite advancements made in the areas of periodontal disease diagnosis, only limited longitudinal studies have been conducted to identify biomarkers that predict disease progression (PDP) prior to radiographic and clinical manifestations. The objective of this investigation was to determine the release profile of saliva-derived biomarkers and periodontal pathogens during PDP longitudinally in a cohort of individuals with periodontitis. A secondary objective was to determine the ability of the saliva and serum biomarkers to identify sites associated with PDP.
Materials & Methods
Study Population and Measures of Periodontal Disease Progression
This clinical trial was approved by the University of Michigan Health Sciences Institutional Review Board and was registered with the NIH clinical trials registry (ClinicalTrials.gov NCT00277745). After they provided written consent, 100 individuals aged 18 yrs and older were evaluated at the Michigan Center for Oral Health Research between 2005 and 2007. The baseline characteristics of this population have been previously reported (Ramseier et al., 2009).All individuals possessed at least 20 teeth and had not received periodontal treatment or antibiotic therapy for medical or dental reasons for 3 mos prior to the investigation. Individuals were excluded if they possessed a history of metabolic bone diseases, autoimmune diseases, unstable diabetes, or post-menopausal osteoporosis. Pregnant or lactating women were excluded from participating in the study (Appendix Table 1).
Participants were enrolled into either a healthy/gingivitis ora periodontitis group. The healthy/gingivitis population exhibited < 3 mm of clinical attachment loss (CAL), no probing depth (PD) of > 4 mm, and no radiographic alveolar bone loss. Individuals with periodontitis exhibited a minimum of 4 sites with evidence of radiographic bone loss, a minimum of 4 sites with CAL > 3 mm, and a minimum of 4 sites with PD > 4 mm. Participants were further divided into subgroups based on clinical parameters. Within the low-risk group, individuals with bleeding upon probing (BOP) ≤ 20% were categorized as healthy, and those with BOP > 20% were considered to have gingivitis. Individuals in the disease-susceptible group with ≤ 30% of sites with CAL > 3 mm were classified as having mild chronic periodontitis, and those with > 30% of sites with CAL> 3 mm were considered to have moderate-severe periodontitis (Armitage, 1999; Tonetti and Claffey, 2005).
Participants were seen bi-monthly over a 12-month period (Fig. 1). To identify disease progression, we collected data during two phases; the disease-monitoring phase (baseline to 6 mos) and the disease-recovery phase (6-12 mos). During the disease-monitoring phase, no periodontal treatment was provided. Individuals in the low-risk group received a maintenance prophylaxis and OHI at 6 and 12 mos. Those in the disease-susceptible group received scaling and root planing and OHI at 6 mos and maintenance prophylaxis at each of the remaining study visits. Tobacco cessation was not provided during the study. Rescue therapy consisting of localized scaling and root planing was provided at any study visit if a site underwent an increase in clinical attachment loss of > 2 mm from the baseline measures. Clinical and radiographic measures, as well as calibration and training protocols for these measures, are described in the Appendix.
Figure 1.
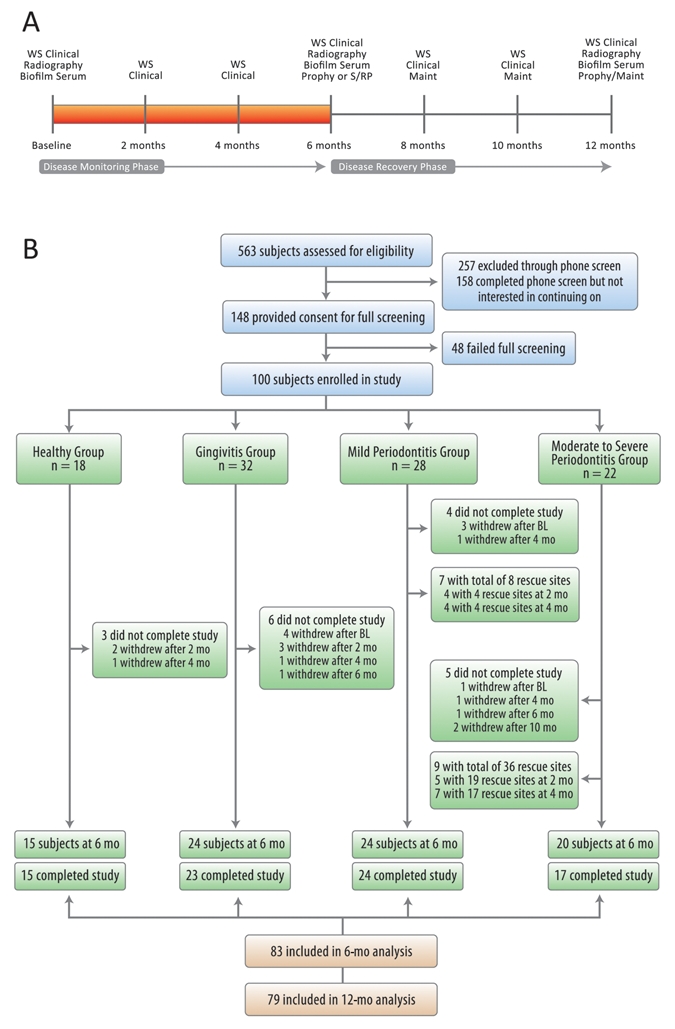
Study timeline and recruitment/enrollment activities of the study. (A) Study timeline. (B) The study population was stratified into four groups.
Whole Saliva Collection and Analysis
Unstimulated whole saliva was collected at each study visit via passive drooling into sterile plastic tubes from all participants (Mandel and Wotman, 1976). Samples were placed on ice, supplemented with a proteinase inhibitor combination of 1% aprotinin and 0.5% phenylmethylsulphonylfluoride, and aliquotted prior to storage at -80°C. Specific information regarding individual protein arrays and ELISA assessment of saliva and serum (below) biomarkers associated with matrix destruction, inflammation, host response, and bone turnover are described in the Appendix.
Serum Collection and Analysis
A 20-mL quantity of whole blood was collected at baseline and 6 and 12 mos. Once collected, samples were allowed to clot at room temperature for 30 min, then centrifuged for 15 min at 2600 rpm. Serum was stored at -80°C until analysis. The analysis of the identified serum biomarkers used for analysis and their measurements are described in the Appendix.
Quantitative Polymerase Chain-reaction (qPCR) Microbial Plaque Biofilm Analysis
Subgingival plaque biofilm was collected from the mesiobuccal aspect of all teeth at baseline, 6, and 12 mos as described previously (Shelburne et al., 2008). The detection of Porphyromonas gingivalis, Prevotella intermedia, Tannerella forsythia, Fusobacterium nucleatum, Treponema denticola, and Campylobacter rectus was quantified by qPCR as described previously (Mullally et al., 2000). Samples were pooled, after which we calculated the percentage of the total flora for each species by dividing the number of target organisms by the total number of bacteria as determined by qPCR, using 16S rRNA primers that reacted with all bacterial species. Data were represented on a participant-based assessment.
Statistical Analysis
Participant characteristic differences (Appendix Table 2) by initial periodontal health were assessed with a Kruskal-Wallis test for continuous characteristics and a chi-squared test of association for binary characteristics. Clinical periodontal measures were first averaged within-mouth before being analyzed. Longitudinal patterns of clinical periodontal measures, biofilm pathogen levels, and salivary and serum biomarkers were summarized by means and standard errors at each time-point. The (robust) standard errors for each time-point were adjusted for within-subject correlation (repeated measures) through the use of generalized estimating equations (GEE) with a working independence correlation matrix. Further explanation of the statistical methods used is provided in the Appendix.
Results
Study timeline and recruitment/enrollment activities of the study are shown in Fig. 1. In total, 148 individuals were screened. Forty-eight failed the clinical screening, leaving 100 participants who were stratified into four groups according to their clinical criteria. During disease progression analysis, 83 participants completed the study, with 44 exhibiting PDP during the disease-monitoring period, while 39 demonstrated stability.
Characteristics of individuals at baseline were previously presented (Ramseier et al., 2009), and those completing the investigation are described in Appendix Table 2. Clinical data were significantly different among the four groups for mean number of teeth, BOP, % GRI, % sites with plaque, mean PD, % sites PD > 4 mm, mean CAL, and mean BL (all p ≤ 0.001). The prevalence of smoking was significantly higher in participants with mild and moderate-severe chronic periodontitis (38% and 80%, respectively) compared with healthy individuals and those with gingivitis (0% and 21%, respectively). Between-group differences were significant at p < 0.001. The percentage of males in each of the study groups ranged from 35% to 60% (p = 0.325). In addition, the percentage of Caucasian participants in the study groups ranged from 67% to 87% (p = 0.489). Furthermore, the mean age of the study population ranged from 46 to 54 yrs (p = 0.735) (Appendix Table 2).
Periodontal data are shown in Fig. 2. To identify disease progression, we collected data at two different phases: the disease-monitoring phase (baseline-6 mos) and the disease-recovery phase (6-12 mos). During the disease-monitoring phase, there were no significant changes regarding periodontal disease measurements. However, during the disease-recovery phase, participants with periodontal disease showed a significant mean PD reduction at 12 mos compared with baseline (p < 0.01). Furthermore, those with gingivitis and periodontitis demonstrated significant gains in CAL and % sites with BOP (p < 0.01) at 12 mos. Participants with mild chronic periodontitis revealed significant radiographic bone gain at 12 mos compared with baseline (p < 0.05). During the disease-monitoring phase, rescue therapy was provided to seven participants (8 sites) in the mild periodontitis group and nine (36 sites) in the moderate-severe periodontitis group.
Figure 2.
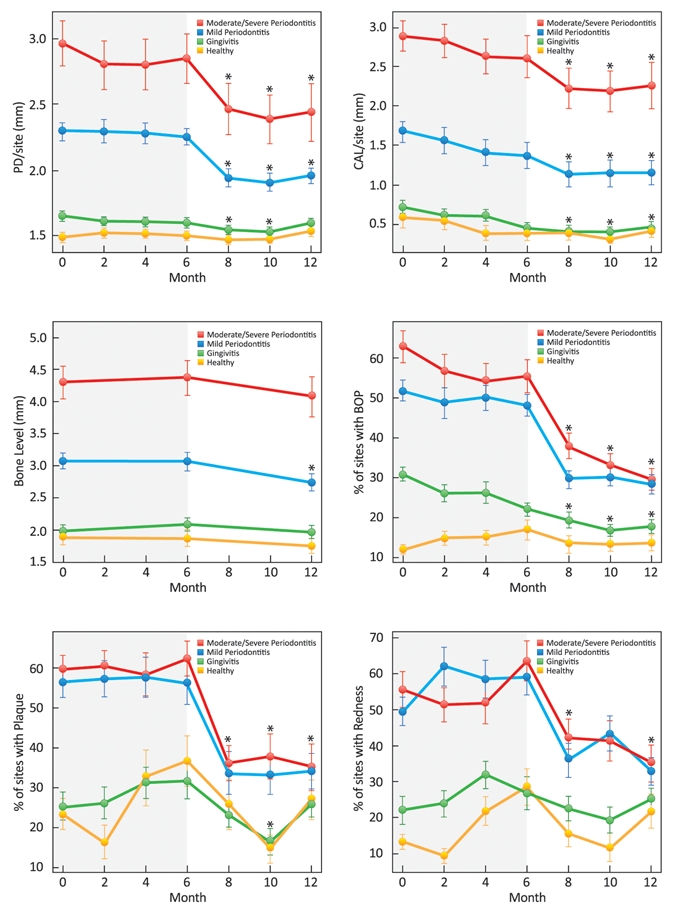
Longitudinal plots of mean (± SD) clinical periodontal measures stratified by initial category of periodontal health. Compared with baseline, individuals in the mild and moderate/severe periodontitis groups showed significant mean PD reductions at 8, 10, and 12 mos; those in the gingivitis group had significant mean PD reductions at 8 and 10 mos (p < 0.05). Compared with baseline CAL, gingivitis and periodontitis groups had significant gains at 8, 10, and 12 mos; individuals in the healthy group had significant gains in CAL at 8 and 10 mos (p < 0.05). Significant radiographic bone gain was achieved in the mild periodontitis group at 12 mos compared with baseline (p < 0.05). Compared with baseline, significant percent reductions in the percent of sites with bleeding upon probing were seen in the gingivitis and periodontitis groups at 8, 10, and 12 mos (p < 0.05). Significant reductions in the percent of sites with plaque were observed in the periodontitis groups at 8, 10, and 12 mos compared with baseline; healthy individuals and those in the gingivitis group had significant reductions at 10 mos compared with baseline (p < 0.05). Significant reductions in the percent of sites with redness were achieved by individuals in the periodontitis groups at 8 and 12 mos compared with baseline; those in the healthy group had significant increases in the percent of redness at 12 mos compared with baseline (p < 0.05).
The longitudinal plots of salivary biomarker levels found among the four groups over 12 mos are shown in Fig. 3. During the disease-monitoring phase, the salivary biomarker levels did not reveal significant differences compared with baseline. During the disease-recovery phase, individuals with moderate-severe periodontitis demonstrated reduction of salivary biomarker levels at 12 mos compared with baseline, specifically, MMP-8, MMP-9, OPG, and IL-1β (p < 0.05). Healthy individuals and those with periodontitis demonstrated significant increases in calprotectin at 12 mos compared with baseline (p < 0.05). Regarding serum biomarker expression, all participants demonstrated a reduced expression of MMP-8 and MMP-9 (p < 0.05) and a significant increase of serum OPG and calprotectin (p < 0.05) at 12 mos compared with baseline (Appendix Fig. 1).
Figure 3.
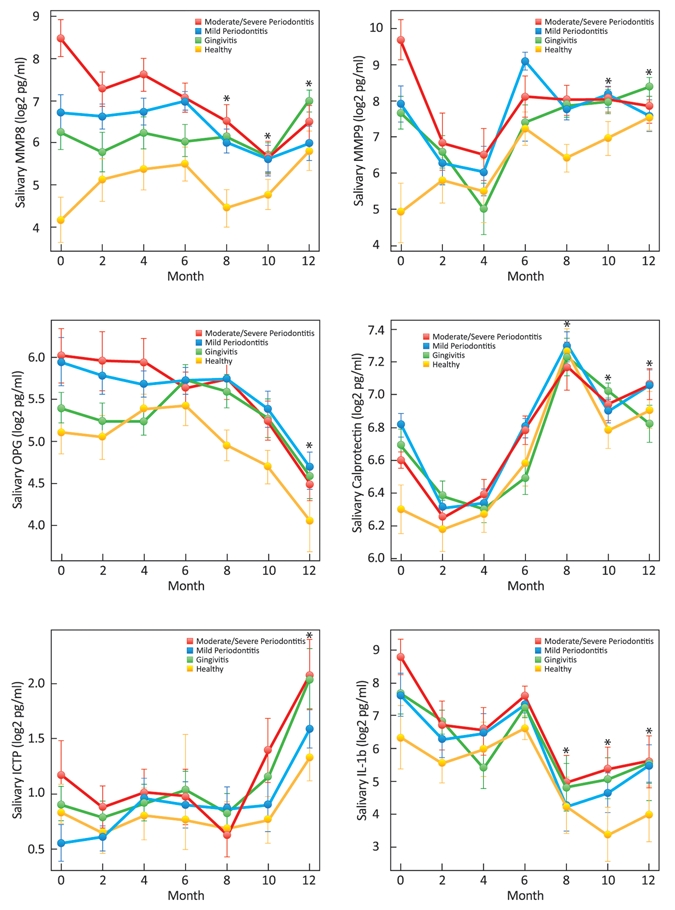
Longitudinal plots of mean (± SD) salivary biomarker levels stratified by initial category of periodontal health. Compared with baseline, significant reductions in salivary MMP-8 were seen in the moderate/severe periodontitis group at 8, 10, and 12 mos; those in the healthy group showed significant increases in MMP-8 levels at 12 mos (p < 0.05). Participants in the moderate/severe periodontitis group had significant reductions in MMP-9 at 10 and 12 mos compared with baseline; those in the healthy group had significant increases in MMP-9 at 10 and 12 mos compared with baseline (p < 0.05). Individuals in the periodontitis group had significant reductions in salivary OPG levels at 12 mos compared with baseline (p < 0.05). Compared with baseline levels of calprotectin, participants in the moderate/severe periodontitis group showed significant increases at 8, 10, and 12 mos; those in the mild periodontitis group had increases at 8 and 12 mos; those in the gingivitis group had increases at 8 and 10 mos; and those in the healthy group had increases at 8, 10, and 12 mos (p < 0.05). Significant increases in salivary ICTP were observed in the mild periodontitis and gingivitis groups at 12 mos compared with baseline (p < 0.05). Compared with baseline, significant decreases in IL-1β levels were seen in the periodontitis groups at 8, 10, and 12 mos, in the gingivitis group at 8 and 10 mos, and in the healthy group at 10 mos (p < 0.05).
Regarding the percentage of periodontal pathogens found among the four groups over 12 mos, there were no significant findings during the disease-monitoring phase. However, during the disease-recovery phase, participants with chronic periodontitis demonstrated a significant reduction of all periodontal pathogens at 12 mos compared with baseline (p < 0.05). In addition, healthy individuals and those with gingivitis showed significant reductions in F. nucleatum (p < 0.001) at 12 mos (Appendix Fig. 2).
The hierarchical clustering used to determine the role of periodontal pathogens, salivary, and serum biomarkers on PDP is presented in Fig. 4. PDP was defined as at least 2 sites with > 2 mm of CAL loss during the disease-monitoring phase. Participants were divided into three clusters (progression, indeterminate, and stable) based on the disease progression evaluated during the disease-monitoring phase. Thirty-four individuals were classified under the progression cluster. Periodontal pathogens and salivary and serum biomarkers were able to predict PDP for 24 of these 34 individuals categorized by clinical disease progression. Regarding the stable cluster, periodontal pathogens and salivary and serum biomarkers were able to predict clinical stability for 25 of 34 individuals. Sixteen individuals were assigned to the ‘indeterminate’ cluster. To elucidate the significance of periodontal pathogens and salivary and serum biomarkers on the indeterminate cluster, we performed an additional hierarchical clustering (Appendix Fig. 3). Analysis of Cluster 3 demonstrated that individuals were further divided into similar subdivisions as Clusters 1 and 2, but simply the thresholds of change for saliva and plaque biomarkers were lower (Appendix Fig. 3).
Figure 4.
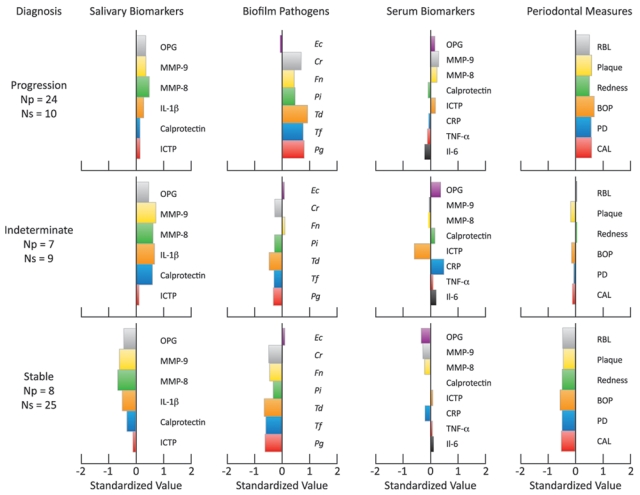
Barplots displaying three clusters based on levels of salivary biomarkers, biofilm, serum biomarkers, and clinical measures. Within each cluster, the number of participants undergoing disease progression (≥ 2 sites demonstrating > 2 mm of CAL loss over 6 mos) is indicated. Np = number of participants within each group experiencing disease progression. Ns = number of participants within each group without disease progression.
Discussion
Periodontitis is a chronic disease composed of a group of inflammatory conditions affecting the supporting structures of the dentition (Armitage, 1999). Traditional periodontal diagnostic methods are limited to the evaluation of parameters that assess only periodontal destruction. Development of innovative diagnostic tests enabling active phases of periodontal disease to be detected and identifying individuals at risk for future disease occurrence is the focus of numerous clinical investigations.
As previously described by our group, analysis of our data identified putative biomarkers from saliva and anaerobic pathogens that were strongly related to disease status (Ramseier et al., 2009). Among the salivary biomarkers, IL-1β, MMP-8, MMP-9, and OPG demonstrated the highest correlation with disease status. Further, the use of multiple time-points of two-month intervals of saliva biomarkers allows for an improved understanding of biomarker fluctuations over time.
During periodontal disease, host inflammatory cells are recruited, and inflammatory cytokines, such as IL-1β, IL-6, and TNF-α, are released from fibroblasts, macrophages, connective tissue, and junctional epithelial cells. As a result, host-derived enzymes, such as MMP-8, MMP-9, and calprotectin, are released by PMNs and osteoclasts, leading to connective tissue and alveolar bone degradation.
Currently, studies have demonstrated the association of host-response salivary biomarkers and periodontal pathogens with periodontal disease (Herr et al., 2007; Gursoy et al., 2009; Ramseier et al., 2009; Teles et al., 2010. However, there is a gap in the literature regarding longitudinal studies in this area. To the best of our knowledge, this study is unique in that it provides a longitudinal analysis ofhost-response biomarkers and periodontal pathogens during the course of periodontal disease progression and recovery.
Analysis of data from a cross-sectional study demonstrated elevated concentrations of IL-1β and MMP-8 from whole saliva of participants with periodontal disease compared with healthy control individuals (Christodoulides et al., 2007). Recently, Fine et al. longitudinally evaluated PDP on children at risk for aggressive periodontitis and reported that IL-1β demonstrated a high specificity and sensitivity to predict alveolar bone loss (Fine et al., 2009).
Regarding biofilm pathogens, analysis of our data revealed that periodontal pathogens, specifically the “red complex” pathogens (Socransky et al., 1998), were able to predict PDP. Our findings are supported by a recent report demonstrating an association of periodontal pathogens, inflammatory biomarkers, and periodontal disease (Teles et al., 2010). Results demonstrated a positive correlation among mean levels of IL-1β, IL-8, and MMP-8, and the proportions of periodontal pathogenic bacteria in individuals with periodontitis (Teles et al., 2010).
Although serum biomarkers have been studied by several authors (Tonetti et al., 2007; Renvert et al., 2009), our study demonstrated that they did not appear to be good predictors of PDP. Interestingly, no significant changes on serum biomarkers after non-surgical periodontal treatment in pregnant women with periodontitis were shown (Michalowicz et al., 2009). Furthermore, it has also been reported that analysis of serum biomarkers was inconsistent across individuals and largely not sustainable (Behle et al., 2009).
Our results support the concept of combining clusters of salivary biomarkers and periodontal pathogens for prediction of future disease progression. The use of panels of host biomarkers and pathogens for disease diagnosis may hold promise (Ramseier et al., 2009). Among the indicators for PDP, the elevated presence of “red complex” pathogens, F. nucleatum, C. rectus, and P. intermedia, demonstrated the ability to predict PDP for 82% of individuals. Salivary biomarkers, specifically MMP-8, MMP-9, OPG, and IL-1β, present in low concentrations were able to predict stability for 78% of individuals who were clinically stable during disease monitoring. Interestingly, a selected group of individuals was classified as indeterminate regarding their clinical disease progression. A second cluster analysis within this specific group showed that those undergoing clinical disease progression also had high concentrations of periodontal pathogens. In addition, those who demonstrated stability tended to have low levels of salivary biomarkers, as did those initially considered stable. Offenbacher et al. proposed a diagnostic periodontal disease classification scheme called the “biologic systems model” (Offenbacher et al., 2007). This model is based on medical and dental findings and contributory biologic phenotypes. Underlying “biologic phenotypes” consider the biofilm and the host inflammatory and immune response to be at the biofilm-gingival interface. As a whole, the biologic system model is built on a framework of components, starting with the recognition of subject-level exposures interacting with genetic and epigenetic factors, and including cellular and molecular processes and inflammatory biomarkers to define different clinical phenotypes of periodontal disease detection and prediction. Limitations of this investigation with the sample evaluated include measurement error of PDP indices, the lack of body mass index assessments, serum cotinine levels, and analysis of the smoking contributions to biomarker assessments. Future investigations in larger populations may provide greater insights into these risk factors that may have confounded some of the results in the study sample evaluated.
In summary, this investigation supports the use of microbial and host-response biomarkers as indicators for periodontal disease progression. The use of saliva and biofilm biomarkers offers potential for the prediction of periodontal disease progression or stability to potentially determine periodontal signatures of disease in larger patient populations.
Supplementary Material
Acknowledgments
This work was supported by NIH (U01–DE014961), NCRR (UL RR000042), and the Swiss Society of Periodontology. Drs. Herr, Shelburne, Braun, Singh, and Giannobile hold intellectual property related to this article. The authors appreciate the clinical assistance of Amy Kim, Noah Smith, and Tina Huffman. We appreciate the assistance of Mr. Chris Jung for the figures in the article.
Footnotes
A supplemental appendix to this article is published electronically only at http://jdr.sagepub.com/supplemental.
References
- Armitage GC. (1999). Development of a classification system for periodontal diseases and conditions. Ann Periodontol 4:1-6 [DOI] [PubMed] [Google Scholar]
- Bassim CW, Redman RS, DeNucci DJ, Becker KL, Nyler ES. (2008). Salivary procalcitonin and periodontitis in diabetes. J Dent Res 87:630-4 [DOI] [PubMed] [Google Scholar]
- Behle JH, Sedaghatfar MH, Demmer RT, Wolf DL, Celenti R, Kebschull M, et al. (2009). Heterogeneity of systemic inflammatory responses to periodontal therapy. J Clin Periodontol 36:287-294 [DOI] [PMC free article] [PubMed] [Google Scholar]
- Christodoulides N, Floriano PN, Miller CS, Ebersole JL, Mohanty S, Dharshan P, et al. (2007). Lab-on-a-chip methods for point-of-care measurements of salivary biomarkers of periodontitis. Ann NY Acad Sci 1098:411-428 [DOI] [PubMed] [Google Scholar]
- Darveau RP. (2010). Periodontitis: a polymicrobial disruption of host homeostasis. Nat Rev Microbiol 8:481-490 [DOI] [PubMed] [Google Scholar]
- Eley BM, Cox SW. (1996). Correlation between gingivain/gingipain and bacterial dipeptidyl peptidase activity in gingival crevicular fluid and periodontal attachment loss in chronic periodontitis patients. A 2-year longitudinal study. J Periodontol 67:703-716 [DOI] [PubMed] [Google Scholar]
- Fine DH, Markowitz K, Furgang D, Fairlie K, Ferrandiz J, Nasri C, et al. (2009). Macrophage inflammatory protein-1alpha: a salivary biomarker of bone loss in a longitudinal cohort study of children at risk for aggressive periodontal disease? J Periodontol 80:106-113 [DOI] [PubMed] [Google Scholar]
- Giannobile WV, Beikler T, Kinney JS, Ramseier CA, Morelli T, Wong DT. (2009). Saliva as a diagnostic tool for periodontal disease: current state and future directions. Periodontol 2000 50:52-64 [DOI] [PMC free article] [PubMed] [Google Scholar]
- Gursoy UK, Kononen E, Uitto VJ, Pussinen PJ, Hyvarinen K, Suominen-Taipale L, et al. (2009). Salivary interleukin-1beta concentration and the presence of multiple pathogens in periodontitis. J Clin Periodontol 36:922-927 [DOI] [PubMed] [Google Scholar]
- Herr AE, Hatch AV, Throckmorton DJ, Tran HM, Brennan JS, Giannobile WV, et al. (2007). Microfluidic immunoassays as rapid saliva-based clinical diagnostics. Proc Natl Acad Sci USA 104:5268-5273 [DOI] [PMC free article] [PubMed] [Google Scholar]
- Kornman KS. (2008). Mapping the pathogenesis of periodontitis: a new look. J Periodontol 79(8 Suppl):1560S-1568S [DOI] [PubMed] [Google Scholar]
- Loesche WJ, Kazor CE, Taylor GW. (1997). The optimization of the BANA test as a screening instrument for gingivitis among subjects seeking dental treatment. J Clin Periodontol 24:718-726 [DOI] [PubMed] [Google Scholar]
- Loo JA, Yan W, Ramachandran P, Wong DT. (2010). Comparative human salivary and plasma proteomes. J Dent Res 89:1016-23 [DOI] [PMC free article] [PubMed] [Google Scholar]
- Mandel ID, Wotman S. (1976). The salivary secretions in health and disease. Oral Sci Rev 8:25-47 [PubMed] [Google Scholar]
- Michalowicz BS, Novak MJ, Hodges JS, DiAngelis A, Buchanan W, Papapanou PN, et al. (2009). Serum inflammatory mediators in pregnancy: changes after periodontal treatment and association with pregnancy outcomes. J Periodontol 80:1731-1741 [DOI] [PMC free article] [PubMed] [Google Scholar]
- Mullally BH, Dace B, Shelburne CE, Wolff LF, Coulter WA. (2000). Prevalence of periodontal pathogens in localized and generalized forms of early-onset periodontitis. J Periodontal Res 35:232-241 [DOI] [PubMed] [Google Scholar]
- Offenbacher S, Barros SP, Singer RE, Moss K, Williams RC, Beck JD. (2007). Periodontal disease at the biofilm-gingival interface. J Perio-dontal 78:1911-25 [DOI] [PubMed] [Google Scholar]
- Ramseier CA, Kinney JS, Herr AE, Braun T, Sugai JV, Shelburne CA, et al. (2009). Identification of pathogen and host-response markers correlated with periodontal disease. J Periodontol 80:436-446 [DOI] [PMC free article] [PubMed] [Google Scholar]
- Renvert S, Lindahl C, Roos-Jansaker AM, Lessem J. (2009). Short-term effects of an anti-inflammatory treatment on clinical parameters and serum levels of C-reactive protein and proinflammatory cytokines in subjects with periodontitis. J Periodontol 80:892-900 [DOI] [PubMed] [Google Scholar]
- Shelburne CE, Shelburne PS, Dhople VM, Sweier DG, Giannobile WV, Kinney JS, et al. (2008). Serum antibodies to Porphyromonas gingivalis chaperone HtpG predict health in periodontitis susceptible patients. PLoS One 3:e1984. [DOI] [PMC free article] [PubMed] [Google Scholar]
- Socransky SS, Haffajee AD, Cugini MA, Smith C, Kent RL., Jr (1998). Microbial complexes in subgingival plaque. J Clin Periodontol 25:134-144 [DOI] [PubMed] [Google Scholar]
- Taba M, Jr, Kinney J, Kim AS, Giannobile WV. (2005). Diagnostic biomarkers for oral and periodontal diseases. Dent Clin North Am 49:551-571, vi [DOI] [PMC free article] [PubMed] [Google Scholar]
- Teles R, Sakellari D, Teles F, Konstantinidis A, Kent R, Socransky S, et al. (2010). Relationships among gingival crevicular fluid biomarkers, clinical parameters of periodontal disease, and the subgingival microbiota. J Periodontol 81:89-98 [DOI] [PMC free article] [PubMed] [Google Scholar]
- Tonetti MS, Claffey N. (2005). Advances in the progression of periodontitis and proposal of definitions of a periodontitis case and disease progression for use in risk factor research. Group C consensus report of the 5th European Workshop in Periodontology. J Clin Periodontol 32(Suppl 6):210-213 [DOI] [PubMed] [Google Scholar]
- Tonetti MS, D’Aiuto F, Nibali L, Donald A, Storry C, Parkar M, et al. (2007). Treatment of periodontitis and endothelial function. N Engl J Med 356:911-920 [DOI] [PubMed] [Google Scholar]
Associated Data
This section collects any data citations, data availability statements, or supplementary materials included in this article.