Abstract
Background
Metabolic imaging is of interest in esophageal cancer, however, the usefulness of initial standardized uptake value (iSUV) of positron emission tomography (PET) is unknown in patients with esophageal or gastroesophageal carcinoma (E-GEC) treated with definitive chemoradiotherapy. We hypothesized that iSUV would correlate with patient outcome.
Methods
We retrospectively analyzed E-GEC patients who had a baseline PET and endoscopic ultrasonography (EUS) in addition to other routine staging. All patients received definitive chemoradiotherapy. Multiple statistical methods were employed.
Results
We analyzed 209 consecutive E-GEC patients treated with definitive chemoradiation for outcome; of these 179 had baseline PET for additional analyses. The median overall survival (OS) for all patients was 20.7 months (95% confidence interval; 18.8, 26.3 months). Patients with clinical complete response (cCR) lived longer than those with <cCR (p=<0.0001). The median iSUV was 12.7 (range, 0–51). Higher iSUV was associated with longer tumors (p=0.0001), higher T stage (p=<0.0001), positive N (p=0.0001), higher overall stage (P=<0.0001), lack of cCR (p=0.0002), and squamous cell histology (p=<0.0001). In the univariate analysis, iSUV was associated with OS (Cox model, P=0.016; log-rank test, P=0.002). In the multivariate analysis, iSUV dichotomized by the median value (P=0.024) and tumor grade (p=0.016) were independent OS prognosticators. Median iSUV for cCR patients was 10.2 compared to 15.3 for <cCR patients (p=0.0058).
Conclusions
Our data indicate that a higher iSUV is associated with poorer OS in patients with E-GEC receiving definitive chemoradiation. Upon validation, baseline PET may become a useful stratification factor in randomized trials and for individualizing therapy.
Introduction
Esophageal and gastroesophageal carcinomas (E-GEC) are highly aggressive malignancies. Approximately 482,000 new cases and 407,000 deaths were estimated in the world in 20081. The incidence of E-GEC adenocarcinoma has been increasing on a consistent basis for more than 30 years in the western countries2, 3. Obesity, gastroesophageal reflux disease, and Barrett's metaplasia are associated with the rapid increase in the incidence of adenocarcinoma of the E-GEC4. Surgery is still a commonly recommended primary therapy, however, prognosis following resection is poor.5 In North America, the use of preoperative chemoradiotherapy (trimodality therapy) is common and preferred over preoperative chemotherapy to improve patients' prognosis6, 7. This approach has been substantiated by the positive results reported by a recent and the largest trial in its class.8
Definitive chemoradiotherapy (bimodality therapy) has also been established as an important approach for patients with locally advanced esophageal carcinoma9. Bimodality therapy is appropriate for patients who do not want surgery or in whom surgery is not possible as a result of technical or medical reasons. Recent studies reported that in those patients with high thoracic squamous cell carcinoma, bimodality therapy might be a preferred option10, 11.
Heterogeneity in patient's outcome is frequently noted even if similarly staged patients receive same therapy. This heterogeneity in patient outcome could be related to differing molecular biology of individual esophageal cancer responsible for various levels of sensitivity to chemotherapy and radiotherapy and its metastatic potential12. The challenge is to identify patients who can benefit from a specific therapy and also identify those who will not benefit. Some advances have been made in metabolic imaging through positron emission tomography (PET).13-23
Interesting results have been reported with initial SUV (iSUV) and its correlation with overall survival (OS) in surgically managed E-GEC patients who did not receive any preoperative therapy. Lower iSUV was associated with longer OS.24, 25 In patients who received trimodality therapy, iSUV did not correlate with OS13, 26, 27. In one of our studies,19 higher iSUV tended to be associated with improved OS in patients who received trimodality therapy. The association between iSUV and prognosis of patients treated with bimodality therapy has not been reported.
In this paper, we report our retrospective experience in patients with E-GEC treated with BM therapy. We hypothesized that iSUV would correlate with outcome of bimodality patients. We also reviewed the importance of clinical complete response after chemoradiation.
Materials and Methods
Patient Selection
We studied 209 consecutive patients with biopsy-proven E-GEC who were treated with bimodality therapy between 2002 and early 2008. iSUV was available for analysis in 179 patients. Bimodality therapy was recommended based on the evaluation of patient's cancer staging and other appropriate evaluations by the multidisciplinary team that included medical oncologists, gastroenterologists, radiation oncologists, pathologist, radiologists, and thoracic oncologic surgeons. There were some patients who were recommended trimodality therapy but did not want surgery (reasons are given below).
Pretreatment investigations included a complete blood count, measurement of serum electrolytes, chest radiograph, computed tomography scan of the chest and abdomen, barium swallow radiography, upper gastroesophageal endoscopy with endoscopic ultrasound (EUS) and a PET (when feasible).
Study Design
Our objective was to perform two analyses: 1) to assess the effectiveness of the bimodality therapy at our institution in consecutive patients (n=209) and 2) to correlate iSUV (n=179) with clinical parameters including OS and relapse-free survival (RFS).
Definitive chemoradiotherapy (BM therapy)
All patients received concurrent chemotherapy with radiotherapy. Before definitive chemoradiotherapy, 84 patients (40.2%) received up to 8 weeks of induction chemotherapy. The total radiation dose delivered was either 45 grays (Gy) in 25 fractions or 50.4 Gy in 28 fractions, at 1.8 Gy per fraction delivered once a day, 5 days a week. All patients received a fluoropyrimidine (iv or oral) and either a taxane or a platinum compound as the second cytotoxic agent during radiation. Five to six weeks after the completion of chemoradiation, all patients underwent comprehensive re-staging that included complete blood count, measurement of serum electrolytes, upper gastroesophageal endoscopy with biopsies, and imaging studies of the chest and abdomen including a PET.
SUV Calculations
The maximum SUV was calculated with the following equation: SUV = A/(ID/BW), in which A is the decay-corrected mean activity in tissue (measured in millicuries per milliliter), ID is the injected dose of FDG (measured in millicuries), and BW is the patient's body weight (measured in grams). At our institution, we follow the National Cancer Institute guidelines for image preparation, acquisition, and analysis.28
Imaging
PET-CT in 179 patients was performed before any therapy as a baseline study in all patients. PET-CT images were acquired with an integrated PET-CT device (Discovery ST-8; GE Medical System, Milwaukee, Wisconsin), and the whole-body mode was implemented as the standard software. Before PET-CT, patients fasted for at least 6 hours. All patients were tested to confirm that their glucose level was within the normal range (80-120 mg/dl) before FDG administration. Before PET, unenhanced CT was performed from the base of the skull to the upper thigh according to a standardized protocol performed with the following settings: transverse 3.75 mm section thickness, 140-kilovolt peak, 120 mA, and 13.5-mm table speed. Emission scans were obtained 60 minutes after the intravenous administration of FDG (15 to 20 milliCuries or 555 to 740 megabecquerels [MBq]). The acquisition time was 3 minutes per bed position in the 2-dimensional mode. Images were reconstructed with attenuation-weighted ordered-subset expectation maximization with and without attenuation correction. These have been described in detail elsewhere.19-22
Assessments after chemoradiation
Upon completion of all post-chemoradiation staging, each patient was assigned to one of two categories: (1) clinical complete response (cCR) or (2) less than cCR. cCR was defined as having no cancer cells in the post-chemoradiation biopsy in all patients. This was coupled with having a physiologic level of SUV max on post-chemoradiation PET (Figures 1a and 1b) or when SUV max was higher than normal but was distributed in the esophagitis pattern (Figures 2a and 2b). This is a working definition at our institution and we acknowledge that there is no agreed upon standard definition for cCR.
Figure 1.
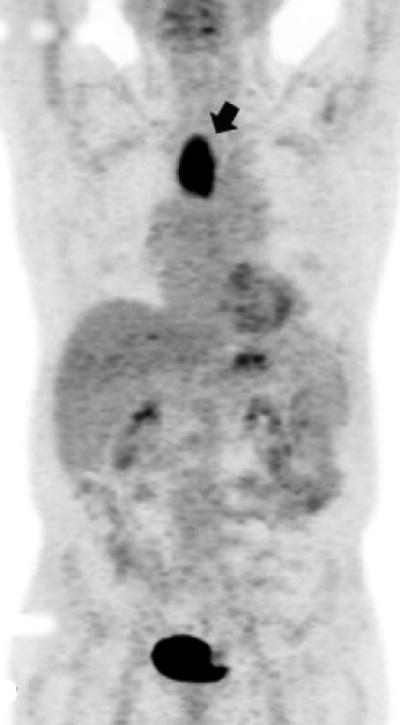
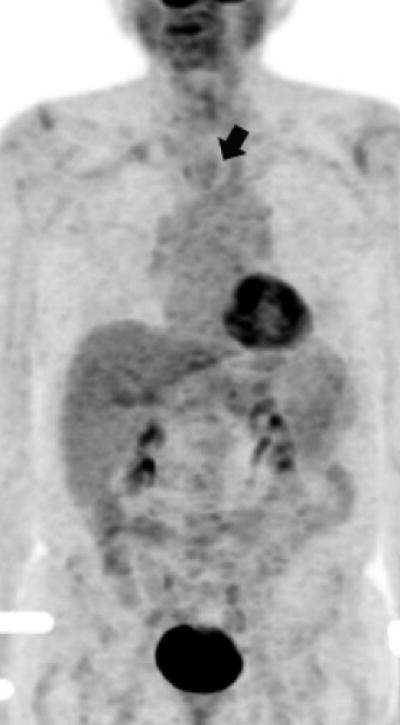
Figure 1a. Upper thoracic esophageal cancer with an FDG glucose uptake on a PET portion of the PET-CT examination.
Figure 1b. Upper thoracic esophageal cancer with evidence of complete resolution of FDG glucose uptake on a PET portion of the PET-CT examination after chemoradiation.
Figure 2.
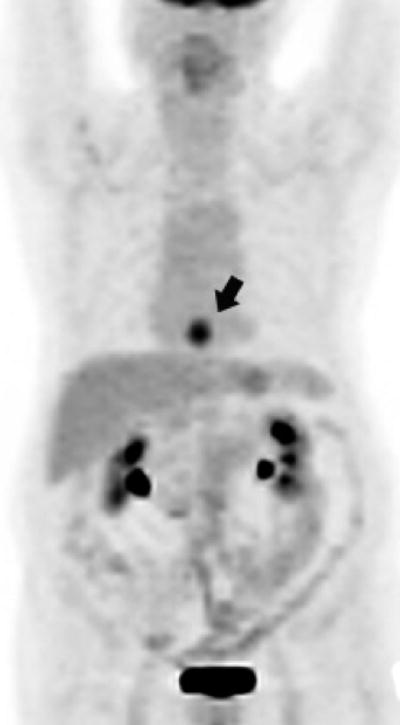
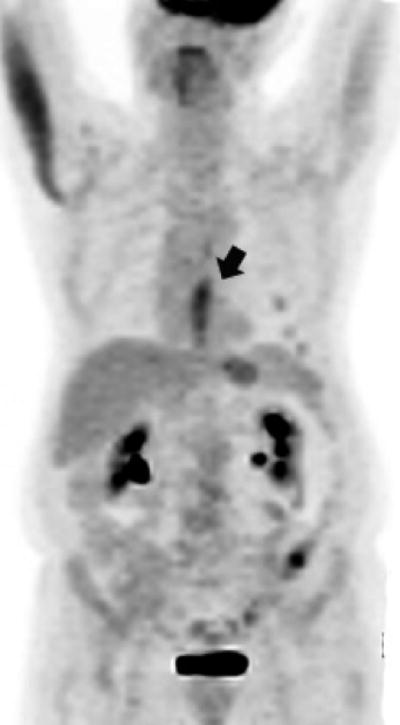
Figure 2a. Lower thoracic esophageal cancer with evidence of FDG glucose uptake on a PET portion of the PET-CT examination.
Figure 2b. Lower thoracic esophageal cancer with FDG glucose uptake on a PET portion of the PET-CT examination that is indicative of esophagitis after chemoradiation (since post-chemoradiation biopsy was negative, this patient was classified as having achieved a cCR)
Follow-up and Survival
Patients were followed periodically until 5 years or until death. Follow-up data were obtained from MDACC tumor registry and the hospital records or social security database.
Statistical Methods
Continuous variables were summarized using descriptive statistics such as mean, standard deviation, median and range. Categorical variables were tabulated by frequency and percentage.
Kaplan-Meier method was used to estimate the probability of OS and RFS, Log rank test, and Cox proportional hazards regression analysis were employed to determine the association of OS and RFS with clinical and demographic parameters including iSUV values. Multivariate analysis was applied to determine the association of iSUV with OS after adjusting the effects of other covariates. First a base Cox proportional hazards model for OS was established. To build the base model, initially a full model was fitted, including all variables with p value less than 0.15 in the univariate analysis. Then a backward selection procedure was used to remove one variable at a time, until all variables retained in the model were at the 0.05 significance level. After that a model including iSUV and variables in the base model was fit in order to evaluate the prognostic effect of iSUV or its changes on OS after adjusting the effects of the covariates in the base model. iSUV was dichotomized based the median value for assessment but we also performed the recursive partitioning and regression tree analyses29 for OS and RFS to identify an optimum cut-point for iSUV.
Fisher's exact test and Wilcoxon rank sum test were employed to compare the patient characteristics.
Results
Patient Characteristics
Characteristics of the 209 patients who received definitive chemoradiotherapy (without surgery) are shown in Table 1. White men and adenocarcinoma histology dominated. Among these 209 patients, 73 (34.9%) had significant co-morbid conditions, 69 (33.0%) patients had technically unresectable tumor, and 45 patients (21.5%) elected not to undergo surgery (but were recommended surgery). During chemoradiotherapy, 24 patients (11.5%) had severe adverse events and they were considered too high-risk (estimated mortality >10%) for surgery.
Table 1. Patient characteristics (n=209).
| Covariate | Frequency (%) |
|---|---|
| Gender | |
| Male | 181 (86.6) |
| Female | 28 (13.4) |
| Age | |
| Average | 66.6 |
| SD | 10.3 |
| Race | |
| Asian | 6 (2.9) |
| Black | 11 (5.3) |
| Hispanic | 10 (4.8) |
| White | 182 (87.1) |
| Tumor Length | |
| Average (cm) | 5.3 |
| SD | 2.5 |
| Histology | |
| Adenocarcinoma | 158 (75.6) |
| Squamous cell carcinoma | 51 (24.4) |
| Tumor Grade | |
| G1 well diff. | 2 (1.0) |
| G2 moderately diff. | 96 (45.9) |
| G3 poorly diff. | 110 (52.6) |
| GX undetermined | 1 (0.5) |
| Reasons for no surgery | |
| Poor medical condition | 73 (34.9) |
| Technically unresectable | 69 (33.0) |
| Patient's choice | 45 (21.5) |
| Deterioration after chemoradiation | 22 (10.5) |
SD denotes standard devition;
Survival and Relapse (n=209)
The median follow up time is 38.1 months (95 % confidence interval [CI]; 30, 43.1 months). The estimated median survival time for all 209 patients was 20.7 months (95% CI; 18.8, 26.3 months) and median RFS time was 11.15 months (95 % CI; 9.44, 14.34). The estimated OS and RFS rates at 3 years were 35.7 % (95 % CI; 29.0, 43.9%) and 24.8% (95 % CI; 19.1, 32.1%), respectively.
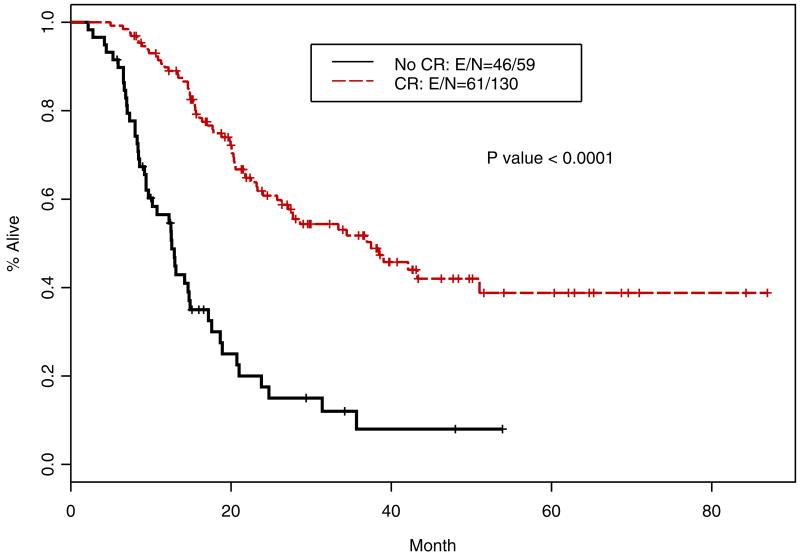
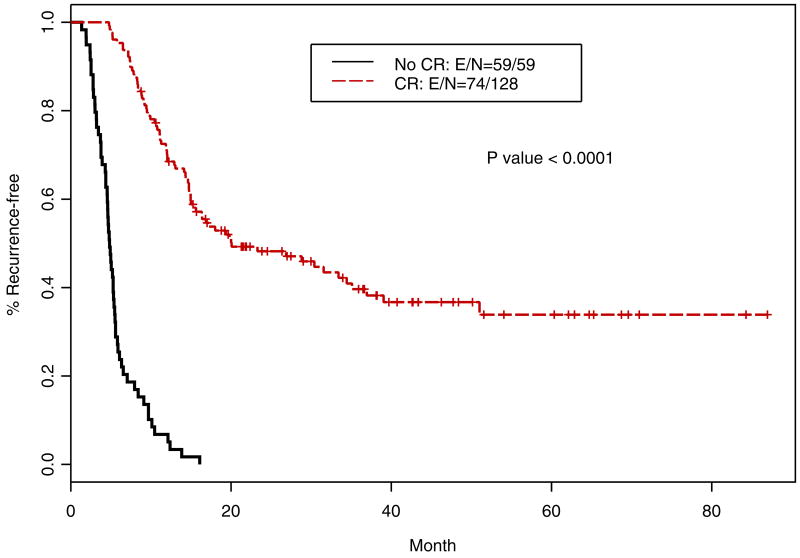
Following definitive chemoradiotherapy, 130 patients (62.2%) had a cCR. The median OS of patients with cCR was 37.47 months (95% CI; 27.14, not reached in months) and that for patients with <cCR was 12.6 months (95% CI; 12.27, 23.78 months); this difference was highly significant (p<0.0001; Figure 3). Similarly, RFS for patients with cCR was 20.07 months (95% CI; 15.48, 36.94 months) compared to 4.84 months (95% CI; 4.54, 5.49 months); this difference was highly significant (p<0.0001; Figure 4).
Figure 3.
Kaplan-Meier overall survival curves for patients with cCR and <cCR (n=209)
Figure 4.
Kaplan-Meier relapse-free survival curves for patients with cCR and <cCR (n=209)
Cancer recurrence or persistence cancer was documented in 151 of 209 patients (72.2%). In addition, 125 patients (59.8%) had died at the time of this analysis.
iSUV and OS (all iSUV data are in 179 patients)
Table 2 presents the results of fitting univariate Cox for continuous variables. The results suggested that higher iSUV was associated a higher chance of death (HR=1.02, p=0.016). In Table 3, the Log rank test shows that OS was significantly associated with T-stage status (p=0.001), N-stage status (p=0.007), overall stage (p=0.006), tumor grade (p=<0.0001), iSUV (dichotomized by the median value; p=0.002), and if the patients had cCR or not (p=<0.0001). Location of the primary30, tumor histology, induction chemotherapy, and type of cytotoxics administered were not associated with OS.
Table 2. Univariate Cox proportional hazards model to determine the association of OS with iSUV used as a continuous variable (iSUV data on 179 patients).
| Variable | HR (95 % CI) | P-value |
|---|---|---|
| Age | 0.993 (0.977, 1.01) | 0.44 |
| Length of tumor (cm) | 1.07 (0.993, 1.14) | 0.077 |
| Baseline BMI | 0.984 (0.952, 1.02) | 0.35 |
| iSUV (continuous) | 1.02 (1, 1.04) | 0.016 |
CI denotes confidence interval; BMI denotes body mass index; iSUV denotes initial standardized uptake value.
Table 3.
Log rank test on OS for categorical variables (n=209) (CI denotes confidence interval; *primary site by Siewert's classification30; staging by AJCC 6th Edition37.
| Level | Frequency (%) | Median OS time (95 % CI) (month) | P-value |
|---|---|---|---|
| Primary Site* | |||
| Esophagus | 50 (23.9) | 20.36 (16.05, NA) | 0.173 |
| AEG 1 | 93 (44.5) | 18.82 (15.3, 23.78) | |
| AEG 2 | 61 (29.2) | 33.39 (20.07, NA) | |
| AEG 3 | 5 (2.4) | 20.43 (6.51, NA) | |
| Tumor Status | |||
| T1 | 10 (4.8) | 39.05 (39.05, NA) | 0.001 |
| T2 | 17 (8.1) | NA (34.44, NA) | |
| T3 | 166 (79.4) | 20.30 (17.11, 23.78) | |
| T4 | 14 (6.7) | 15.53 (12.27, NA) | |
| TX | 2 (1.0) | 7.73 (6.58, NA) | |
| Lymph Node Status | |||
| N0 | 61 (29.2) | 37.47 (25.76, NA) | 0.007 |
| N+ | 146 (69.9) | 18.91 (15.53, 21.71) | |
| NX | 2 (1.0) | 11.10 (9.7, NA) | |
| Metastatic Status | |||
| M0 | 161 (77.0) | 21.02 (17.17, 27.7) | 0.773 |
| M1A | 22 (10.5) | 23.98 (18.82, NA) | |
| M1B | 26 (12.4) | 17.80 (14.74, NA) | |
| Stage | |||
| I | 8 (3.8) | 39.05 (39.05, NA) | 0.006 |
| IIA | 48 (23.0) | 37.47 (25.76, NA) | |
| IIB | 9 (4.3) | 43.26 (34.44, NA) | |
| III | 96 (45.9) | 14.90 (13.12, 20.3) | |
| IVA | 22 (10.5) | 23.98 (18.82, NA) | |
| IVB | 26 (12.4) | 17.80 (14.74, NA) | |
| Tumor Histology | |||
| Adenocarcinoma | 158 (75.6) | 21.02 (18.82, 27.73) | 0.744 |
| Squamous cell carcinoma | 51 (24.4) | 19.70 (15.53, NA) | |
| Tumor Grade | |||
| G1 well diff. | 2 (1.0) | 3.37 (1.48, NA) | <0.0001 |
| G2 moderately diff. | 96 (45.9) | 34.44 (21.78, NA) | |
| G3 poorly diff. | 110 (52.6) | 19.93 (14.87, 21.71) | |
| GX undetermined | 1 (0.5) | 23.78 (NA, NA) | |
| Induction chemotherapy | |||
| Yes | 84 (40.2) | 18.82 (16.05, 27.7) | 0.984 |
| No | 125 (59.8) | 21.78 (19.8, 34.44) | |
| Chemoradiotherapy Agents | |||
| Platinum + Fluoropyrimidine | 56 (26.8) | 21.02 (17.17, 43.26) | 0.197 |
| Taxane + Fluoropyrimidine | 115 (55.0) | 22.50 (19.93, 35.66) | |
| Others | 34 (16.3) | 17.07 (14.01, NA) | |
| Unknown | 4 (1.9) | 8.29 (7.34, NA) | |
| Clinical CR after chemoradiation | |||
| Achieved | 130 (68.8) | 37.47 (27.14, NA) | <0.0001 |
| Not achieved | 59 (31.2) | 12.6 (9.7, 17.17) | |
| iSUV (dichotomized) | |||
| < 12.7 (median) | 89 (49.4) | 33.39 (21.71, NA) | 0.002 |
| >= 12.7 (median) | 91 (50.6) | 17.11 (12.27, 23.78) |
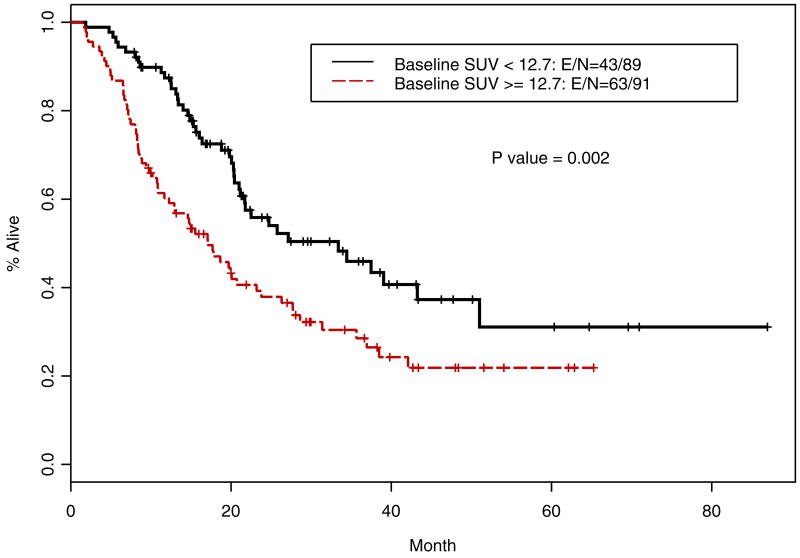
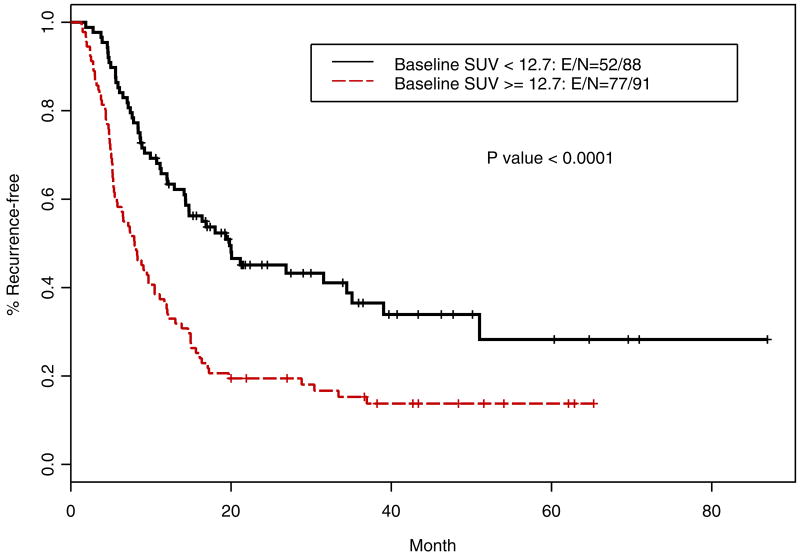
Table 4 shows the multivariate analysis using dichotomized iSUV (by the median as the cut off), after adjusting for the effect of lymph node status and tumor grade, iSUV was significantly associated with OS (p=0.024) and the grade of the tumor was also an independent prognosticator (p=0.016). Patients with a higher iSUV (>/=12.7) had a higher risk death (HR=1.61; p=0.024). Patients with lower than the median value of SUV had a longer OS (Figure 5; p=0.002) and improved RFS (Figure 6, p<0.001) compared with those with a higher iSUV.
Table 4. Multivariate analysis for iSUV (dichotomized by the median value) and OS after adjusting the effect of initial N and tumor grade.
| variable | HR (95% CI) | P-value | |
|---|---|---|---|
| Lymph Node Status | N+/NX vs. N0 | 1.53 (0.918, 2.54) | 0.1 |
| Tumor Grade | G3/GX vs. G1/G2 | 1.65 (1.100, 2.45) | 0.016 |
| iSUV | >= 12.7 vs. < 12.7 | 1.61 (1.065, 2.41) | 0.024 |
| iSUV (by optimal cut-point) | >6 vs. <=6 | 3.19 (1.57, 6.46) | 0.0013 |
CI denotes confidence interval; iSUV denotes initial standardized uptake value.
Figure 5.
Kaplan-Meier overall survival curves for patients with high iSUV vs low iSUV (n=179)
Figure 6.
Kaplan-Meier relapse-free survival curves for patients with high iSUV vs low iSUV (n=179)
Table 5 lists the results of Wilcoxon rank sum test for continuous variables, and Table 6 summarizes the Fisher's exact test result to compare categorical patient characteristics between the iSUV low and high groups. Wilcoxon rank sum test indicated that longer tumors were associated with higher iSUV (p=0.0001). Fisher's exact test indicated that iSUV was significantly associated with primary site (p<0.0001), T-stage status (p<0.0001), N-status status (p=0.0001), overall stage (p<0.0001), and tumor histology (p<0.0001). For example, 80.5% of squamous cell carcinoma patients had iSUV >/=12.7, while only 40.9% of adenocarcinoma patients had iSUV >/=12.7.
Table 5. Wilcoxon rank sum test to determine the association between iSUV (dichotomized by the median value [12.7]) and clinical parameters (n=179).
| Covariate and iSUV | N | Mean +/- std, median (range) | P-value |
|---|---|---|---|
| Age | |||
| Low (<12.7) | 89 | 66.3 +/- 10.2, 68 (30 - 84) | 0.8336 |
| High (>=12.7) | 91 | 66.4 +/- 10.3, 68 (34 - 85) | |
| Length of Tumor (cm) | |||
| Low (<12.7) | 83 | 4.5 +/- 2.4, 4 (0 - 11) | 0.0001 |
| High (>=12.7) | 89 | 6.1 +/- 2.3, 6 (2 - 13) | |
| Baseline BMI | |||
| Low (<12.7) | 89 | 27.9 +/- 6.3, 26.6 (19 - 63.9) | 0.6725 |
| High (>=12.7) | 91 | 27.7 +/- 5.6, 27.6 (15 - 43.4) |
iSUV denotes standardized unit value; std denotes standard; BMI denotes body mass index
Table 6. Fisher's exact test result to compare categorical patient characteristics between iSUV low and high groups (n=179).
| iSUV | |||
|---|---|---|---|
| Low (<12.7) | High (>=12.7) | P-value | |
| Primary Site | |||
| Esophagus | 9(21.4%) | 33(78.6%) | <0.0001 |
| AEG1 | 40(50.6%) | 39(49.4%) | |
| AEG2 | 39(70.9%) | 16(29.1%) | |
| AEG3 | 1(25%) | 3(75%) | |
| Baseline Tumor Status | |||
| T1 | 9(100%) | 0(0%) | <0.0001 |
| T2 | 14(93.3%) | 1(6.7%) | |
| T3 | 63(44.4%) | 79(55.6%) | |
| T4 | 3(25%) | 9(75%) | |
| TX | 0(0%) | 2(100%) | |
| Baseline Lymph node Status | |||
| N0 | 38(71.7%) | 15(28.3%) | 0.0001 |
| N+ | 50(39.7%) | 76(60.3%) | |
| NX | 1(100%) | 0(0%) | |
| Metastatic Status | |||
| M0 | 75(54.3%) | 63(45.7%) | 0.0590 |
| M1a | 6(31.6%) | 13(68.4%) | |
| M1b | 8(34.8%) | 15(65.2%) | |
| Baseline Stage | |||
| I | 7(100%) | 0(0%) | <0.0001 |
| IIA | 29(69%) | 13(31%) | |
| IIB | 7(87.5%) | 1(12.5%) | |
| III | 32(39.5%) | 49(60.5%) | |
| IVA | 6(31.6%) | 13(68.4%) | |
| IVB | 8(34.8%) | 15(65.2%) | |
| Tumor Histology | |||
| Adenocarcinoma | 80(58%) | 58(42%) | <0.0001 |
| Squamous cell carcinoma | 9(21.4%) | 33(78.6%) | |
| Tumor Grade | |||
| G1 well diff. | 1(50%) | 1(50%) | 0.8249 |
| G2 moderately diff. | 38(47.5%) | 42(52.5%) | |
| G3 poorly diff. | 50(51.5%) | 47(48.5%) | |
| GX undetermined | 0(0%) | 1(100%) | |
| Induction Chemotherapy | |||
| Yes | 36(50%) | 36(50%) | 1.0 |
| No | 53(49.1%) | 55(50.9%) | |
| Chemoradiotherapy Agents | |||
| Platinum + Fluoropyrimidine | 23(51.1%) | 22(48.9%) | 0.9133 |
| Taxane + Fluoropyrimidine | 51(50.5%) | 50(49.5%) | |
| Others | 14(45.2%) | 17(54.8%) | |
| Unknown | 1(33.3%) | 2(66.7%) | |
| Clinical CR after chemoradiation | |||
| Achieved | 70 (60.3%) | 46 (39.7%) | 0.0002 |
| Not achieved | 13 (27.7%) | 34 (72.3%) | |
iSUV denotes standardized uptake value;
Recursive Partitioning and Regression Tree Analysis (iSUV)
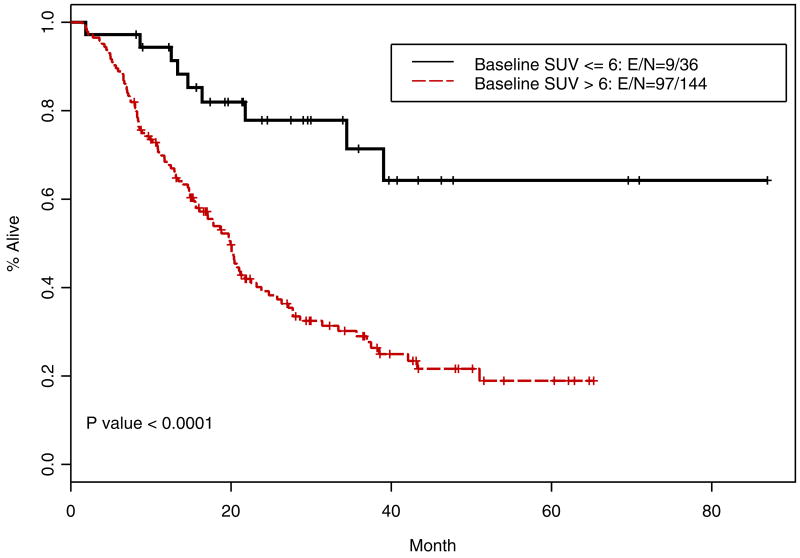
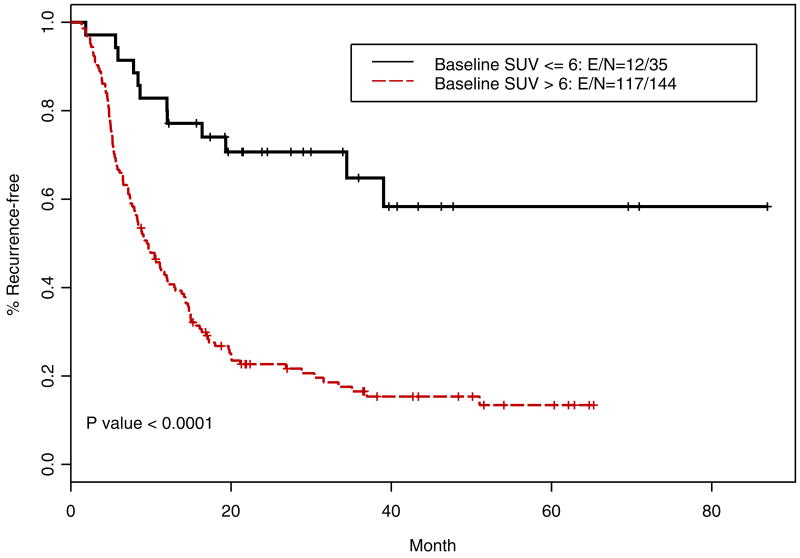
Recursive partitioning and regression tree analyses were carried out to find optimal cut-point for iSUV. We identified cut-point of 6 and when this cut-point was used to dichotomize the iSUV results, it correlated similarly to the median cut-point for OS (p=<0.0001; Figure 7) and RFS (p=<0.0001; Figure 8). The cut-point of 6 was also an independent prognosticator in the multivariate analysis for OS (p=0.0013) and RFS (p=0.007). Approximately, 20% of patients had iSUV <6.
Figure 7.
Kaplan-Meier overall survival curves for patients with iSUV cut-point of 6 identified by recursive partitioning and regression tree analysis (n=179)
Figure 8.
Kaplan-Meier relapse-free survival curves are shown for patients with high initial standardized uptake value (SUV) versus low initial SUV. E/N indicates event (death or relapse)/number.
Patients who achieved a cCR had a median iSUV of 10.2 (range, 0-43.8) compared to those with <cCR had a median iSUV of 15.3 (range, 0-51); this difference was statistically significant (p=0.0058).
Discussion
Patients who receive bimodality therapy usually have the following features: (1) unresectable tumor because of unresectable T4 stage or distribution or size of the enlarged nodes, (2) severe co-morbid conditions resulting prohibitive risk of death from surgery, and or (3) patients personal choice to decline surgery. In 209 patients treated at our institution, 164 patients (77.8 %) had inoperable conditions and 45 patients (21.5 %) could undergo surgery but declined. Definitive chemoradiotherapy is the best alternative therapy for such patients and this approach has been systematically studied in controlled trials9, 31, 32. One issue remains that patients undergoing BM therapy have variable outcomes but currently we are not able to discriminate between the groups of patients who are likely to do well and those whose prognosis is likely to be extremely poor. Imaging with PET has shown some promise but has not been applied to baseline PET. We elected to study the value of baseline PET and also combine post-chemoradiation PET results with post-chemoradiation biopsy to determine if the subgroups can emerge.
Our data indicate that pretreatment PET scan results correlate with OS and RFS. 18[F]-FDG PET is an assessment of glucose consumption by various normal and abnormal tissues. The well-known Warburg effect suggests that most tumors are hypermetabolic and switch from oxidative to glucose metabolism as the main substrate for energy even in the presence of oxygen. The FDG PET has a number of shortcomings but most importantly it is not a direct measure of cell proliferation.33, 34 Energy produced by glycolysis creates an acidic microenvironment. It has been proposed that increased extracellular acid production may be the underlying the basis for cancer cell survival and progression in the context of the 6 hallmarks of cancer; self-sufficiency in growth signals, insensitivity to antigrowth signals, evasion of apoptosis, limitless replicative potential, sustained angiogenesis, and tissue invasion and metastasis35. For these reasons, iSUV measured by PET may be associated with aggressive clinical behavior and shorter OS.
This is the first study in bimodality patients to demonstrate that iSUV as an independent prognostic variable for OS in a multivariate analysis. Patients with low iSUV had better prognosis than those with high iSUV. In 1998, Fukunaga et al. reported 48 Japanese patients' data in that iSUV was associated with OS in patients with esophageal squamous cell carcinoma who were treated with surgery alone24. From Memorial Slone-Kettering Cancer Center, Rizk et al. reported similar results in 50 esophageal adenocarcinoma patients25. Those two sets of data suggest that high iSUV is associated with poor prognosis in patients treated with surgery alone. Those two studies also suggest, in conjuction with this report, that when single modality (such as surgery) or bimodality (definitive chemoradiation) is used, high iSUV leads to poor patient outcome and most likely reflects aggressive tumor behavior. In contrast, we previously observed that 161 patients who received trimodality therapy, high iSUV was associated with prolonged OS.19 A clear explanation for these intriguing and contradicting observations is lacking but we speculate that surgery plays an important role following chemoradiation and overcomes the adverse influence of high iSUV as a manifestation of tumor's aggressive behavior. Additional investigations are clearly warranted and should include prospective strategies.
In this report, we analyzed clinical staging after chemoradiation and its influence of patient outcome. We were interested in assessing critical determinants (post-chemoradiation PET results and post-chemoradiation endoscopic biopsies) that seem to segregate patients in a good or poor prognostic group. In addition, we analyzed the influence of iSUV (n=179) to assess if it alone can correlate with cCR or lack of it. Our findings suggest that iSUV max value (by either median value as the cut-point or identified optimal cut-point) correlates significantly with the achievement of cCR, OS, and RFS. We also found that the combination of post-chemoradiation PET and endoscopic biopsy is useful in separating “cCR” patients from “<cCR” patients and the OS rates of these two groups are dramatically different. This observation may be of considerable value in patients who decline surgery but have high iSUV and achieve <cCR following chemorardiation; these variables can be discussed with patients to further persuade them to undergo surgery. Our data can form a basis for developing novel therapeutic strategies for patients who have chemoradiation resistant (<cCR) tumors.
Our data demonstrate considerable differences in the emerging variables between the univariate and multivariate analyses. Multivariate analysis variables are more robust than the univariate variables because multivariate analysis selects for variables that are not totally interdependent.
We acknowledge several weaknesses in our analyses and these include: (1) it is a retrospective analysis, (2) single institution experience and may not be representative of all practices in North America, (3) although most investigators are reporting on SUV max, the ideal measure is still not known and it may be that the global tumor glycolysis36 might represent the biology more accurately than SUVmax, and (4) these results are not confirmed by others. In addition, all the weaknesses ingrained in the PET assessments of individual patient (example, those with diabetes) apply. The strengths of our results include: (1) first report in BM therapy patients, (2) large series, (3) novel findings regarding iSUV's ability to classify patients and establishment of the post-chemoradiation cCR category that combines biopsy with PET results.
In conclusion, our data suggest that iSUV has a prognostic value in patients with E-GEC patients treated with BM therapy. The results also suggest that following BM therapy, patients can be classified in two groups: (1) those with good prognosis after having achieved a cCR and (2) those with poor prognosis after having a chemoradition resistant cancer (<cCR). Further studies are warranted to validate these observations.
Acknowledgments
Supported in part by Dallas, Park, Sultan, Smith, and Cantu Family funds and by the Reivercreek and Schecter Private Foundations and Kevin and Frazier Funds. Also supported by the Multidisciplinary Research Program Grant from UT M. D. Anderson Cancer Center, and the NCI Grants (CA142072, CA127672, and CA129906)
We also acknowledge invaluable patient care contributions of Dr. William A. Ross, Dr. David C. Rice, Dr. Ara A. Vaporciyan, Dr. Garrett Walsh, Dr. Ritsuko Komaki, Dr. Zhongzing Liao, Dr. Eric Rohren, Dr. Alexander Dekovich, Dr. Linus Ho, Dr. Jeremy Erasmus.
Bibliography
- 1.Ferlay J, Shin HR, Bray F, Forman D, Mathers C, Parkin DM. Estimates of worldwide burden of cancer in 2008: GLOBOCAN 2008. Int J Cancer. doi: 10.1002/ijc.25516. [DOI] [PubMed] [Google Scholar]
- 2.Pohl H, Welch HG. The role of overdiagnosis and reclassification in the marked increase of esophageal adenocarcinoma incidence. J Natl Cancer Inst. 2005;97(2):142–6. doi: 10.1093/jnci/dji024. [DOI] [PubMed] [Google Scholar]
- 3.Brown LM, Devesa SS, Chow WH. Incidence of adenocarcinoma of the esophagus among white Americans by sex, stage, and age. J Natl Cancer Inst. 2008;100(16):1184–7. doi: 10.1093/jnci/djn211. [DOI] [PMC free article] [PubMed] [Google Scholar]
- 4.Brown LM, Swanson CA, Gridley G, Swanson GM, Schoenberg JB, Greenberg RS, et al. Adenocarcinoma of the esophagus: role of obesity and diet. J Natl Cancer Inst. 1995;87(2):104–9. doi: 10.1093/jnci/87.2.104. [DOI] [PubMed] [Google Scholar]
- 5.Rice TW, Rusch VW, Apperson-Hansen C, Allen MS, Chen LQ, Hunter JG, et al. Worldwide esophageal cancer collaboration. Dis Esophagus. 2009;22(1):1–8. doi: 10.1111/j.1442-2050.2008.00901.x. [DOI] [PubMed] [Google Scholar]
- 6.Ajani JA, Barthel JS, Bekaii-Saab T, Bentrem DJ, D'Amico TA, Fuchs CS, et al. Esophageal cancer. J Natl Compr Canc Netw. 2008;6(9):818–49. [PubMed] [Google Scholar]
- 7.Kleinberg L, Forastiere AA. Chemoradiation in the management of esophageal cancer. J Clin Oncol. 2007;25(26):4110–7. doi: 10.1200/JCO.2007.12.0881. [DOI] [PubMed] [Google Scholar]
- 8.Gaast AV, van Hagen P, Hulshof M, Richel D, van Berge Henegouwen MI, Nieuwenhuijzen GA, Plukker JT, Bonenkemp JJ, Steyerberg EW, Tilanus HW. Effect of preoperative concurrent chemoradiotherapy on survival of patients with resectable esophageal or esophagogastric junction cancer Results from a multicenter randomized phase III study. Am Soc Clin Oncol. 2010;28:15s. [Google Scholar]
- 9.Cooper JS, Guo MD, Herskovic A, Macdonald JS, Martenson JA, Jr, Al-Sarraf M, et al. Chemoradiotherapy of locally advanced esophageal cancer: long-term follow-up of a prospective randomized trial (RTOG 85-01). Radiation Therapy Oncology Group. Jama. 1999;281(17):1623–7. doi: 10.1001/jama.281.17.1623. [DOI] [PubMed] [Google Scholar]
- 10.Stahl M, Wilke H, Stuschke M, Walz MK, Fink U, Molls M, et al. Clinical response to induction chemotherapy predicts local control and long-term survival in multimodal treatment of patients with locally advanced esophageal cancer. J Cancer Res Clin Oncol. 2005;131(1):67–72. doi: 10.1007/s00432-004-0604-5. [DOI] [PMC free article] [PubMed] [Google Scholar]
- 11.Boige V, Pignon J, Saint-Aubert B, Lasser P, Conroy T, Bouché O, et al. Final results of a randomized trial comparing preoperative 5-fluorouracil (F)/cisplatin (P) to surgery alone in adenocarcinoma of stomach and lower esophagus (ASLE): FNLCC ACCORD07-FFCD 9703 trial. 2007 ASCO Annual Meeting Proceedings; 2007. p. 4510. Part I. [Google Scholar]
- 12.Wu X, Gu J, Wu TT, Swisher SG, Liao Z, Correa AM, et al. Genetic variations in radiation and chemotherapy drug action pathways predict clinical outcomes in esophageal cancer. J Clin Oncol. 2006;24(23):3789–98. doi: 10.1200/JCO.2005.03.6640. [DOI] [PubMed] [Google Scholar]
- 13.Swisher SG, Erasmus J, Maish M, Correa AM, Macapinlac H, Ajani JA, et al. 2-Fluoro-2-deoxy-D-glucose positron emission tomography imaging is predictive of pathologic response and survival after preoperative chemoradiation in patients with esophageal carcinoma. Cancer. 2004;101(8):1776–85. doi: 10.1002/cncr.20585. [DOI] [PubMed] [Google Scholar]
- 14.Ott K, Herrmann K, Lordick F, Wieder H, Weber WA, Becker K, et al. Early Metabolic Response Evaluation by Fluorine-18 Fluorodeoxyglucose Positron Emission Tomography Allows In vivo Testing of Chemosensitivity in Gastric Cancer: Long-term Results of a Prospective Study. Clin Cancer Res. 2008;14(7):2012–18. doi: 10.1158/1078-0432.CCR-07-0934. [DOI] [PubMed] [Google Scholar]
- 15.Wieder HA, Ott K, Lordick F, Becker K, Stahl A, Herrmann K, et al. Prediction of tumor response by FDG-PET: comparison of the accuracy of single and sequential studies in patients with adenocarcinomas of the esophagogastric junction. Eur J Nucl Med Mol Imaging. 2007;34(12):1925–32. doi: 10.1007/s00259-007-0521-3. [DOI] [PubMed] [Google Scholar]
- 16.Blackstock AW, Farmer MR, Lovato J, Mishra G, Melin SA, Oaks T, et al. A prospective evaluation of the impact of 18-F-fluoro-deoxy-D-glucose positron emission tomography staging on survival for patients with locally advanced esophageal cancer. Int J Radiat Oncol Biol Phys. 2006;64(2):455–60. doi: 10.1016/j.ijrobp.2005.07.959. [DOI] [PubMed] [Google Scholar]
- 17.Ott K, Weber WA, Lordick F, Becker K, Busch R, Herrmann K, et al. Metabolic imaging predicts response, survival, and recurrence in adenocarcinomas of the esophagogastric junction. J Clin Oncol. 2006;24(29):4692–8. doi: 10.1200/JCO.2006.06.7801. [DOI] [PubMed] [Google Scholar]
- 18.Weber WA, Ott K, Becker K, Dittler HJ, Helmberger H, Avril NE, et al. Prediction of response to preoperative chemotherapy in adenocarcinomas of the esophagogastric junction by metabolic imaging. J Clin Oncol. 2001;19(12):3058–65. doi: 10.1200/JCO.2001.19.12.3058. [DOI] [PubMed] [Google Scholar]
- 19.Javeri H, Xiao L, Rohren E, Komaki R, Hofstetter W, Lee JH, et al. Influence of the baseline 18F-fluoro-2-deoxy-D-glucose positron emission tomography results on survival and pathologic response in patients with gastroesophageal cancer undergoing chemoradiation. Cancer. 2009;115(3):624–30. doi: 10.1002/cncr.24056. [DOI] [PubMed] [Google Scholar]
- 20.Javeri H, Xiao L, Rohren E, Lee JH, Liao Z, Hofstetter W, et al. The higher the decrease in the standardized uptake value of positron emission tomography after chemoradiation, the better the survival of patients with gastroesophageal adenocarcinoma. Cancer. 2009;115(22):5184–92. doi: 10.1002/cncr.24604. [DOI] [PubMed] [Google Scholar]
- 21.Patnana SV, Murthy SB, Xiao L, Rohren E, Hofstetter WL, Swisher SG, et al. Critical role of surgery in patients with gastroesophageal carcinoma with a poor prognosis after chemoradiation as defined by positron emission tomography. Cancer. 116(19):4487–94. doi: 10.1002/cncr.25431. [DOI] [PubMed] [Google Scholar]
- 22.Murthy SB, Patnana SV, Xiao L, Rohren E, Hofstetter WL, Swisher SG, Liao Z, Lee JH, Bhutani MS, Macapinlac HA, Wang X, Ajani JA. The standardized uptake value of 18-fluoro-deoxy glucose positron emission tomography after chemoradiation and clinical outcome in patients with localized gastroesophageal carcinoma. Oncology. 2010 doi: 10.1159/000319938. in press. [DOI] [PubMed] [Google Scholar]
- 23.Monjazeb AM, Riedlinger G, Aklilu M, Geisinger KR, Mishra G, Isom S, et al. Outcomes of Patients With Esophageal Cancer Staged With [18F]Fluorodeoxyglucose Positron Emission Tomography (FDG-PET): Can Postchemoradiotherapy FDG-PET Predict the Utility of Resection? J Clin Oncol. doi: 10.1200/JCO.2010.30.7702. [DOI] [PMC free article] [PubMed] [Google Scholar]
- 24.Fukunaga T, Okazumi S, Koide Y, Isono K, Imazeki K. Evaluation of esophageal cancers using fluorine-18-fluorodeoxyglucose PET. J Nucl Med. 1998;39(6):1002–7. [PubMed] [Google Scholar]
- 25.Rizk N, Downey RJ, Akhurst T, Gonen M, Bains MS, Larson S, et al. Preoperative 18[F]-fluorodeoxyglucose positron emission tomography standardized uptake values predict survival after esophageal adenocarcinoma resection. Ann Thorac Surg. 2006;81(3):1076–81. doi: 10.1016/j.athoracsur.2005.09.063. [DOI] [PubMed] [Google Scholar]
- 26.Ott K, Weber W, Siewert JR. The importance of PET in the diagnosis and response evaluation of esophageal cancer. Dis Esophagus. 2006;19(6):433–42. doi: 10.1111/j.1442-2050.2006.00617.x. [DOI] [PubMed] [Google Scholar]
- 27.Hong D, Lunagomez S, Kim EE, Lee JH, Bresalier RS, Swisher SG, et al. Value of baseline positron emission tomography for predicting overall survival in patient with nonmetastatic esophageal or gastroesophageal junction carcinoma. Cancer. 2005;104(8):1620–6. doi: 10.1002/cncr.21356. [DOI] [PubMed] [Google Scholar]
- 28.Shankar LK, Hoffman JM, Bacharach S, Graham MM, Karp J, Lammertsma AA, et al. Consensus recommendations for the use of 18F-FDG PET as an indicator of therapeutic response in patients in National Cancer Institute Trials. J Nucl Med. 2006;47(6):1059–66. [PubMed] [Google Scholar]
- 29.Breiman L, Friedman J, Olshen R, Stone C. Classification and regression trees. New Ed. Taylor & Francis LTD; 1984. [Google Scholar]
- 30.Siewert JR, Stein HJ. Classification of adenocarcinoma of the oesophagogastric junction. Br J Surg. 1998;85(11):1457–9. doi: 10.1046/j.1365-2168.1998.00940.x. [DOI] [PubMed] [Google Scholar]
- 31.Minsky BD, Pajak TF, Ginsberg RJ, Pisansky TM, Martenson J, Komaki R, et al. INT 0123 (Radiation Therapy Oncology Group 94-05) phase III trial of combined-modality therapy for esophageal cancer: high-dose versus standard-dose radiation therapy. J Clin Oncol. 2002;20(5):1167–74. doi: 10.1200/JCO.2002.20.5.1167. [DOI] [PubMed] [Google Scholar]
- 32.Ajani JA, Winter K, Komaki R, Kelsen DP, Minsky BD, Liao Z, et al. Phase II randomized trial of two nonoperative regimens of induction chemotherapy followed by chemoradiation in patients with localized carcinoma of the esophagus: RTOG 0113. J Clin Oncol. 2008;26(28):4551–6. doi: 10.1200/JCO.2008.16.6918. [DOI] [PMC free article] [PubMed] [Google Scholar]
- 33.Haberkorn U, Ziegler SI, Oberdorfer F, Trojan H, Haag D, Peschke P, et al. FDG uptake, tumor proliferation and expression of glycolysis associated genes in animal tumor models. Nucl Med Biol. 1994;21(6):827–34. doi: 10.1016/0969-8051(94)90162-7. [DOI] [PubMed] [Google Scholar]
- 34.Jadvar H, Alavi A, Gambhir SS. 18F-FDG uptake in lung, breast, and colon cancers: molecular biology correlates and disease characterization. J Nucl Med. 2009;50(11):1820–7. doi: 10.2967/jnumed.108.054098. [DOI] [PMC free article] [PubMed] [Google Scholar]
- 35.Hanahan D, Weinberg RA. The hallmarks of cancer. Cell. 2000;100(1):57–70. doi: 10.1016/s0092-8674(00)81683-9. [DOI] [PubMed] [Google Scholar]
- 36.Larson SM, Erdi Y, Akhurst T, Mazumdar M, Macapinlac HA, Finn RD, et al. Tumor Treatment Response Based on Visual and Quantitative Changes in Global Tumor Glycolysis Using PET-FDG Imaging. The Visual Response Score and the Change in Total Lesion Glycolysis. Clin Positron Imaging. 1999;2(3):159–71. doi: 10.1016/s1095-0397(99)00016-3. [DOI] [PubMed] [Google Scholar]
- 37.Greene FPD, Fleming I, Fritz A, Balch C, Haller DG, Morrow M. AJCC cancer staging manual. 6. New York: Springer-Verlag; 2002. [Google Scholar]


