

Abstract
Background
Quality of care delivered in the inpatient and ambulatory settings may be correlated within an integrated health system such as the Veterans Health Administration (VHA). We examined the correlation between stroke care quality at hospital discharge and within 6 months post-discharge.
Methods
Cross-sectional hospital-level correlation analyses of chart-abstracted data for 3467 veterans discharged alive after an acute ischemic stroke from 108 VHA medical centers and 2380 veterans with post-discharge follow-up within 6 months, in fiscal year 2007. Four risk-standardized processes of care represented discharge care quality: prescription of anti-thrombotic and anti-lipidemic therapy, anti-coagulation for atrial fibrillation, and tobacco cessation counseling, along with a composite measure of defect-free care. Five risk-standardized intermediate outcomes represented post-discharge care quality: achievement of blood pressure, low-density lipoprotein (LDL), international normalized ratio (INR), and glycosylated hemoglobin target levels, and delivery of appropriate treatment for post-stroke depression, along with a composite measure of achieved outcomes.
Results
Median risk-standardized composite rate of defect-free care at discharge was 79%. Median risk-standardized post-discharge rates of achieving goal were 56% for blood pressure, 36% for LDL, 41% for INR, 40% for glycosylated hemoglobin, and 39% for depression management and the median risk-standardized composite six-month outcome rate was 44%. The hospital composite rate of defect-free care at discharge was correlated with meeting the LDL goal (r=0.31; p=0.007) and depression management (r=0.27; p=0.03) goal, but was not correlated with blood pressure, INR, or glycosylated hemoglobin goals, nor with the composite measure of achieved post-discharge outcomes (p-values >0.15).
Conclusions
Hospital discharge care quality was not consistently correlated with ambulatory care quality.
MeSH Keywords: Quality of Health Care, Stroke, Acute Treatment, Secondary Prevention
The Institute of Medicine’s landmark reports To Err is Human1 and Crossing the Quality Chasm2 brought national attention to healthcare quality. Several studies have examined the correlation between performance on delivering inpatient processes of care measured by the Centers for Medicare & Medicaid Services (CMS) Hospital Compare program and 30-day clinical outcomes, finding mixed results.3–6 None examined whether quality of care delivered at discharge from the hospital were correlated with quality delivered in the ambulatory care setting. In a fragmented private and public healthcare system, inpatient quality may not be associated with ambulatory care quality, as communication and coordination between settings are frequently disrupted and not sufficiently incentivized through payment policies.7, 8 However, integrated health systems, such as the Veterans Health Administration (VHA), may be more likely to promote better transitions of care between the inpatient and ambulatory care settings, improving quality.9–11 For instance, widespread implementation of information technology and service integration within VHA medical centers (VAMCs) facilitates physician communication and coordination of care.
The VHA Office of Quality and Performance (OQP), in partnership with the VHA Stroke Quality Enhancement Research Initiative (QUERI) Program, recently conducted a nationwide assessment of quality of ischemic stroke care delivered by VAMCs. Data from this project provide a unique opportunity to examine the correlation between hospital-specific stroke care quality at the time of hospital discharge from the inpatient setting with quality of care delivered within 6 months post-discharge in the ambulatory setting within an integrated health system.
MATERIALS AND METHODS
Study Population
As part of the original quality assessment project that was conducted by the VHA OQP and QUERI,12 a retrospective cohort was assembled that included 5721 veterans hospitalized at VAMCs in the United States and Puerto Rico during Fiscal Year (FY) 2007, October 1, 2006 through September 30, 2007, with a primary discharge diagnosis of ischemic stroke, identified using a modified high specificity algorithm of the International Classification of Diseases, Ninth Revision, Clinical Modification (ICD-9-CM) codes. A sample of 5030 medical records was obtained by including all stroke patients at VAMCs with ≤55 and an 80% random sample of patients at VAMCs with >55 ischemic stroke hospitalizations. Medical record abstraction was performed by the West Virginia Medical Institute, VHA’s External Peer Review Program contractor, using remote electronic data. Among the 307 data elements, 90% had an inter-observer reliability ≥70%. Veterans were excluded from the ischemic stroke cohort if the admitting diagnosis of acute ischemic stroke was not confirmed, they were hospitalized for transient ischemic attack or post-stroke rehabilitation, experienced an ischemic stroke after index hospitalization for another condition, or were admitted for carotid endarterectomy, leaving a sample of 3987 veteran patients.
Study Cohort
We assembled two cohorts of patients; the first composed of patients who received acute stroke care in the inpatient setting and were eligible for at least one discharge quality indicator and the second a subset of these discharges who received post-acute stroke care in the outpatient setting within 6 months. For the first sample, we excluded veterans who died during the index hospitalization; were discharged to hospice; had a code status of comfort care during the inpatient period; left the index hospitalization against medical advice; had an unknown discharge disposition; or were ineligible for all of the discharge quality indicators. In addition, in order to ensure sufficient sample size for the calculation of hospital performance, we excluded patients who were hospitalized or received post-discharge care at a VAMC with <10 ischemic stroke hospitalizations in FY2007 (Figure 1). For the second sample, we created a subset of the first sample limited only to patients who had care in the VHA during the 6-months post-discharge. Thus, we further limited our sample by excluding veterans who died within 30 days of discharge, were readmitted to a VAMC within 30 days of discharge, or did not receive care at a VAMC within 6 months post-discharge.
Figure 1.
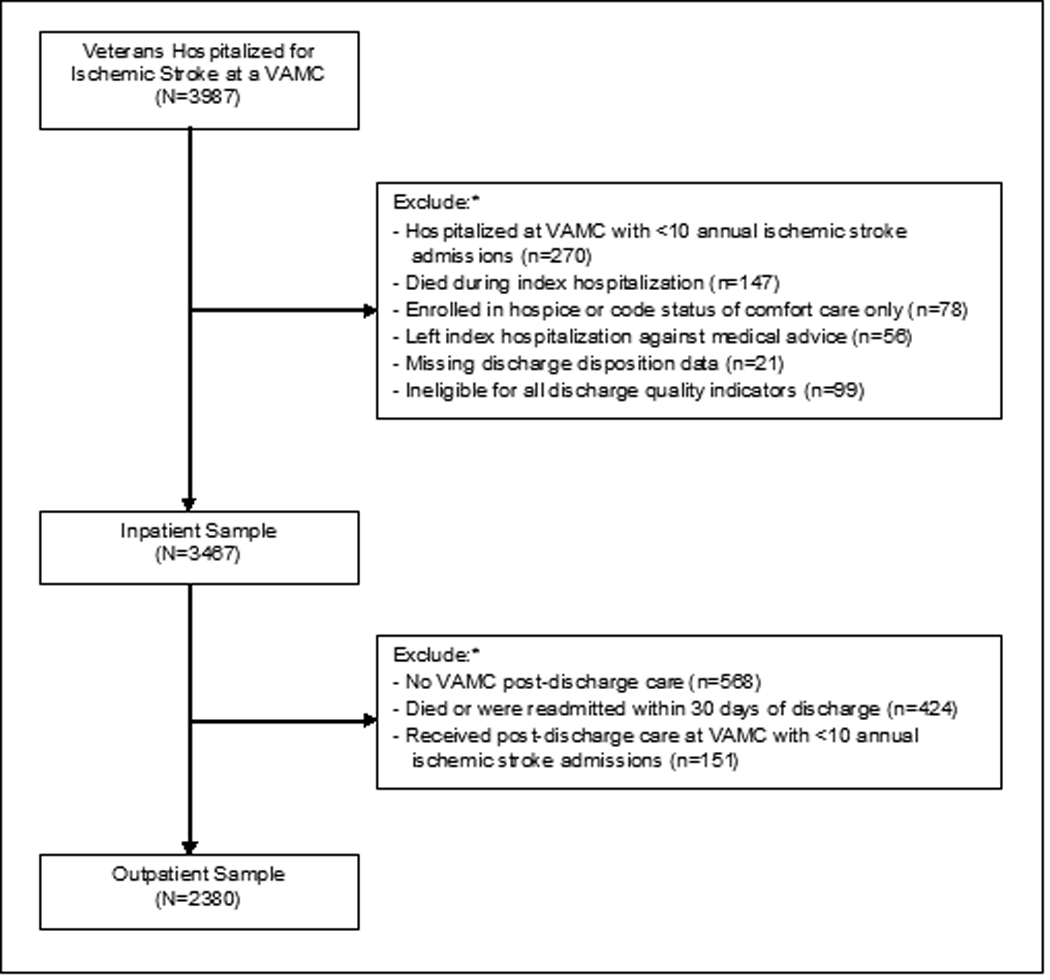
Study sample inclusion and exclusion flow chart.
Note: VAMC=Veterans Affairs Medical Center.
* Exclusion categories are not mutually exclusive.
Quality of Care Measures
Four processes of care were available to study discharge care quality: prescription of anti-thrombotic and anti-lipidemic therapy for all patients; prescription of anti-coagulation therapy for veterans with atrial fibrillation; and tobacco cessation counseling for current tobacco users. Because VAMCs provided generally high rates of these four processes of care to eligible patients, we constructed a composite indicator measuring defect free care at discharge: the proportion of patients who received all processes of care for which they were eligible. Each patient was eligible for 1 to 4 of the discharge processes of care.
Five intermediate outcomes of care were available to study post-discharge care quality within 6 months: blood pressure measurement of <140/90 mmHg for all patients (for patients with a past medical history of diabetes or kidney disease, a cut-off of 130/80 mmHg was used); serum low-density lipoprotein (LDL) measurement of <100 mg/dl for post-stroke patients with LDL measurement of ≥100 mg/dl or not measured during index hospitalization; serum international normalized ratio (INR) measurement of between 2 and 3 inclusive for post-stroke patients discharged on warfarin; serum glycosylated hemoglobin (HbA1c) measurement of < 8% for post-stroke patients with diabetes who had a HbA1c measurement of ≥7% or not measured during the index hospitalization; and depression screening and appropriate management through counseling or treatment for all post-stroke patients. For patients with multiple measurements of these outcomes during the 6-month post-discharge period, the last measurement was selected for analysis. These five outcomes were then used to create a composite indicator of post-discharge care: the proportion of outcomes of care achieved among eligible patients (i.e., outcome achievement rate). Each patient was eligible for 1 to 5 of the post-discharge outcomes.
Statistical Analysis
We estimated hospital performance on each quality measure (i.e., processes of care and intermediate outcome achievement rates) with hierarchical generalized linear models (HGLM) that account for the clustering of patients within facilities and the problems of estimation error arising from small numbers of patients per facility.13–17 A patient-level model was fit for each quality indicator following procedures employed in prior research.18 Each model included 6 patient-level covariates for risk-standardization: age, past medical history of any cerebrovascular co-morbidity (yes/no) or of any non-cerebral caradiovascular co-morbidity (yes/no) prior to hospitalization, admission stroke severity measured by the retrospective National Institute of Health Stroke Scale (NIHSS), index hospitalization length of stay, and discharge to home or sub-acute facility (e.g., nursing home). The VAMC facility was treated as a random effect to take into account clustering of patients within facilities. The HGLM models produced empirical Bayes estimates of hospital-specific rates for the processes of care and outcomes, adjusted for patient characteristics.19 This technique results in conservative estimates for small facilities and for those facilities at the extremes; scores tend toward the pooled mean for all of the hospitals in the sample.
We used weighted Pearson correlation coefficients to measure the strength of associations between hospital-specific rates of processes of care at discharge and outcomes post-discharge. We calculated six sets of pair-wise correlations using the risk-standardized empirical Bayes estimates of hospital rates for the composite measure of defect free care for processes at discharge and the post-discharge outcomes, including discharge care and each of the five post-discharge outcomes, as well as the post-discharge composite. In addition, because different numbers of patients were eligible for the process and outcome measures at different hospitals, correlation coefficients were weighted by the total number of patients from that hospital who were included in the measure estimate. For each correlation, ρ, we tested the hypothesis that ρ=0, adjusting the P values for multiple comparisons using the Sidak method.
We report both the relevant correlation coefficients and the percentage of the hospital-specific variation in post-discharge outcomes explained by the hospital-specific rates of delivering the processes of care at discharge (i.e., the square of the correlation coefficient, as an indicator of the strength of the associations). Furthermore, as a secondary analysis, we calculated additional pairwise correlations for each risk-standardized measure of hospital-specific rates of delivering discharge processes of care and post-discharge outcomes for exploratory purposes, but did not examine the correlation coefficients with statistical testing. Analyses were conducted using SAS version 9.1 (SAS Institute, Cary, NC) and HLM6 (Scientific Software International, Lincolnwood, III). All reported P values are 2-sided and considered significant at <0.05.
RESULTS
Study Cohort
As described in Figure 1, the first study cohort consisted of 3467 veterans discharged from 108 VAMCs after hospitalization for ischemic stroke and the second study cohort consisted of 2380 veterans who received VAMC outpatient follow-up care within 6 months of discharge, among whom 2301 (96.7%) received the majority of their outpatient follow-up care at the same VAMC where they were initially hospitalized. The majority of veterans hospitalized for stroke were white and male, had an average NIHSS score of 3.9, and more than two-thirds were discharged to home (Table 1). Nearly two-thirds of VAMCS were high-complexity facilities and median annual stroke volume was 43.0.
Table 1.
Veterans Health Administration Medical Center Characteristics (n=108).
| Demographic Characteristics of Patients Hospitalized for Stroke | |
| Mean age (SD) | 67.5 (3.1) |
| Male, % (SD) | 96.6 (10.3) |
| White non-Hispanic, % (SD) | 70.2 (23.1) |
| Index Admission Utilization among Patients Hospitalized for Stroke | |
| Mean length of stay (SD), days | 7.7 (3.7) |
| Discharged to home, % (SD) | 67.7 (15.0) |
| Discharged to nursing home or transferred, % (SD) | 32.2 (15.0) |
| Mean number of ambulatory visits during 6-months post-discharge*(SD) | 4.8 (1.3) |
| Clinical Characteristics of Patients Hospitalized for Stroke, % (SD) | |
| NIH stroke scale on index hospitalization | 3.9 (1.4) |
| Code status DNR/DNI | 8.6 (12.1) |
| PMH of ischemic stroke | 22.6 (10.2) |
| PMH of transient ischemic attack | 7.0 (5.5) |
| PMH of cerebrovascular ischemic disease (ischemic stroke, TIA or prior CEA) | 28.3 (11.0) |
| PMH of non-cerebrovascular ischemic disease (previous myocardial infarction, PMH of CAD or PVD or prior CABG surgery or PTCA) | 37.1 (12.3) |
| PMH of atrial fibrillation | 15.4 (7.2) |
| PMH of hypertension | 78.2 (11.0) |
| PMH of hyperlipidemia | 47.4 (16.9) |
| PMH of coronary artery disease | 27.8 (13.2) |
| Previous myocardial infarction | 11.1 (7.6) |
| PMH of heart failure | 11.4 (6.3) |
| PMH of diabetes | 39.6 (10.7) |
| PMH of chronic kidney disease | 0.9 (1.9) |
| PMH of depression | 16.8 (10.2) |
| Facility Characteristics | |
| Census region, % | |
| Caribbean | 0.9 |
| Northeast | 14.8 |
| Midwest | 25.0 |
| South | 40.7 |
| West | 18.5 |
| Complexity20, % | |
| High | 63.9 |
| Medium | 26.8 |
| Low | 9.3 |
| Median annual stroke volume (25th–75th percentile) | 43 (27–65.5) |
| Median proportion of facility enrollees within 30 minute commute (25th–75th percentile), % | 65 (56–81) |
Notes: SD=Standard Deviation; NIH=National Institutes of Health; DNR =Do Not Resuscitate; DNI=Do Not Intubate; PMH=Past Medical History; TIA=Transient Ischemic Attack; CEA=Carotid Endarterectomy; CAD=Coronary Artery Disease; PVD=Peripheral Vascular Disease; CABG=Coronary Artery Bypass Graft; PTCA=Percutaneous Transluminal Coronary Angioplasty.
Ambulatory visits defined as appointments at a VHA clinic for general internal medicine, cardiology, diabetes, geriatrics, hypertension, infectious disease, nephrology, neurology, pulmonary care, or women’s health; Coumadin care; a telephone appointment with general
Quality of Care
Discharge Processes of Care
Most hospitals delivered the recommended processes of care at discharge at high rates (Table 2). Median risk-standardized rates were 97% for prescription of antithrombotic therapy, 84% for antilipidemic therapy, 69% for anticoagulation therapy for patients with atrial fibrillation, and 97% for provision of tobacco cessation counseling. The median risk-standardized rate of defect free care at discharge was 79% (25th/75th percentiles: 69%, 86%).
Table 2.
Risk-adjusted Veterans Health Administration Hospital Quality of Care for Patients with Ischemic Stroke, Fiscal Year 2007.*
| Stroke Quality of Care Components |
No. of Hospitals |
Median No. of Eligible Patients per VAMC (range) |
Median Hospital Rates, % (25th, 75th Percentile) |
|---|---|---|---|
| Processes of Care at Discharge | |||
| Antithrombotic therapy (n=3417) | 108 | 30 (9–97) | 0.97 (0.96, 0.98) |
| Antilipidemic therapy (n=2949) | 108 | 26 (5–82) | 0.84 (0.79, 0.88) |
| Anticoagulation for atrial fibrillation (n=430) | 101 | 4 (1–10) | 0.69 (0.66, 0.72) |
| Tobacco cessation counseling for smokers (n=1241) | 108 | 9 (1–35) | 0.97 (0.93, 0.99) |
| Composite delivery of defect-free processes of care (n=3467) | 108 | 30 (9–100) | 0.79 (0.69, 0.86) |
| 6-Month Post-Discharge Ambulatory Care Outcomes | |||
| Blood pressure measured and meets goal (n=2380) | 108 | 21 (3–78) | 0.56 (0.55, 0.57) |
| Serum LDL measured and meets goal (n=1651) | 108 | 14 (2–45) | 0.36 (0.35, 0.37) |
| Serum INR measured and meets goal (n=338) | 94 | 3 (1–16) | 0.41 (0.41, 0.41) |
| Serum HbA1c measured and meets goal (n=239) | 79 | 2 (1–16) | 0.40 (0.38, 0.43) |
| Depression screening and appropriate treatment (n=2380) | 108 | 21 (3–78) | 0.39 (0.32, 0.46) |
| Composite achievement of outcomes of care (n=2380) | 108 | 21 (3–78) | 0.44 (0.41, 0.47) |
Notes: VAMC=Veterans Administration Medical Center; SD=Standard Deviation; LDL=Low-Density Lipoprotein; INR=International Normalized Ratio; HbA1c=Glycosylated Hemoglobin.
Hospital rates risk-adjusted for patient characteristics.
Post-Discharge Intermediate Outcomes
Hospitals achieved modestly high rates of intermediate outcomes within 6 months after discharge. Median risk-standardized rates of target achievement were 56% for blood pressure, 36% for LDL, 41% for INR, 40% for HbA1c, and 39% for depression screening and management. The median risk-standardized rate of intermediate outcomes achieved post-discharge was 44% (25th/75th percentiles: 41%, 47%).
Correlation between Discharge Process of Care and Post-Discharge Outcomes
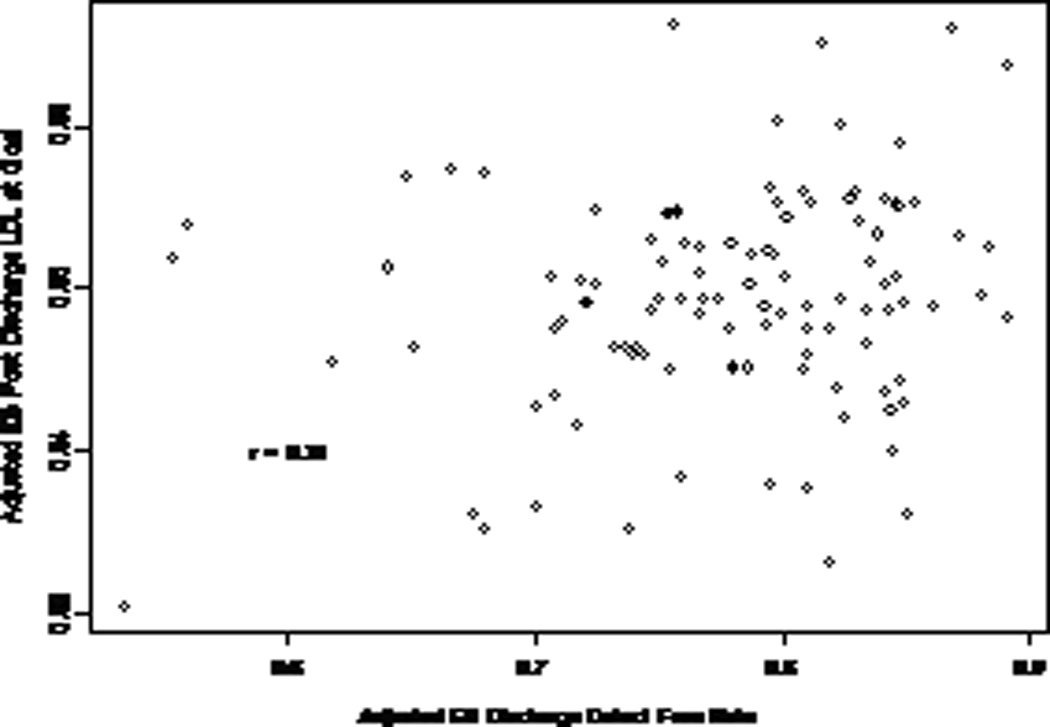
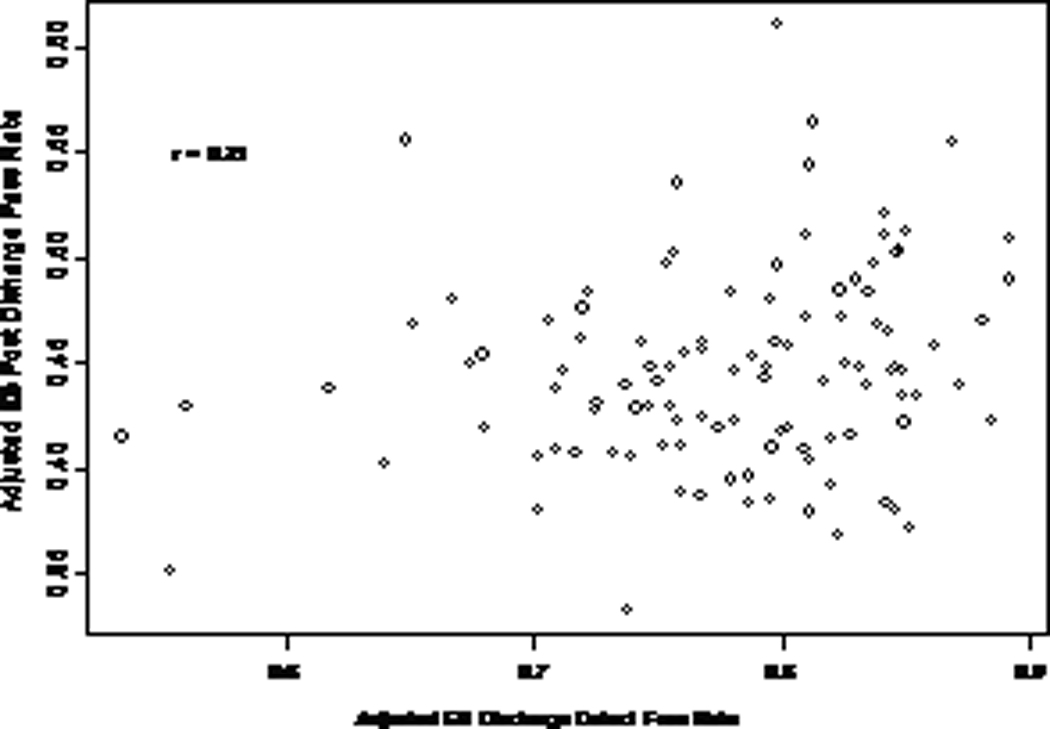
There was a significant correlation between hospital rates of delivering processes of care at discharge, as measured by the composite of defect-free delivery of processes at discharge, and hospital performance on two post-discharge intermediate outcomes: serum LDL meeting goal (r=0.31; p=0.007) and post-stroke depression screening and delivery of appropriate treatment when indicated (r=0.27; p=0.03) (Figures 2b and 3a; Table 3). However, these analyses demonstrated that quality at discharge accounted for only 9.6% and 7.3% of the hospital-level variation in the post-discharge achievement of LDL targets and depression management respectively. There was no significant correlation between quality of care at discharge and hospital post-discharge outcomes for any of the other three intermediate outcomes or the composite achievement of outcomes within 6 months (Figures 2a, 2c, 2d, 3b; p values >0.15).
Figure 2.
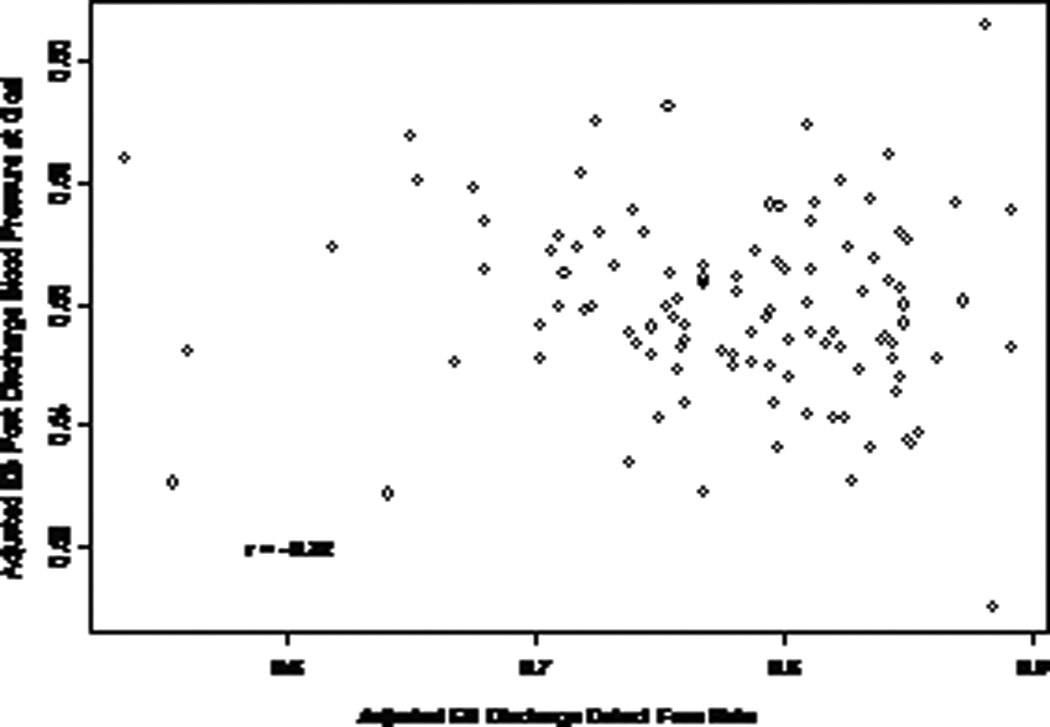
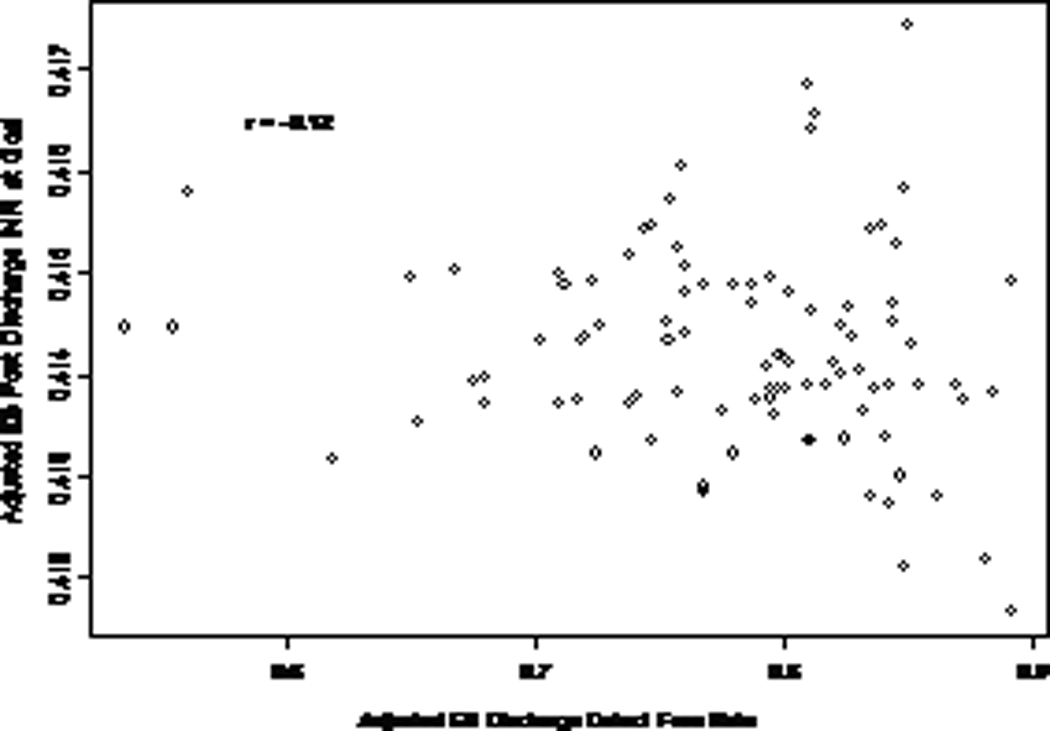
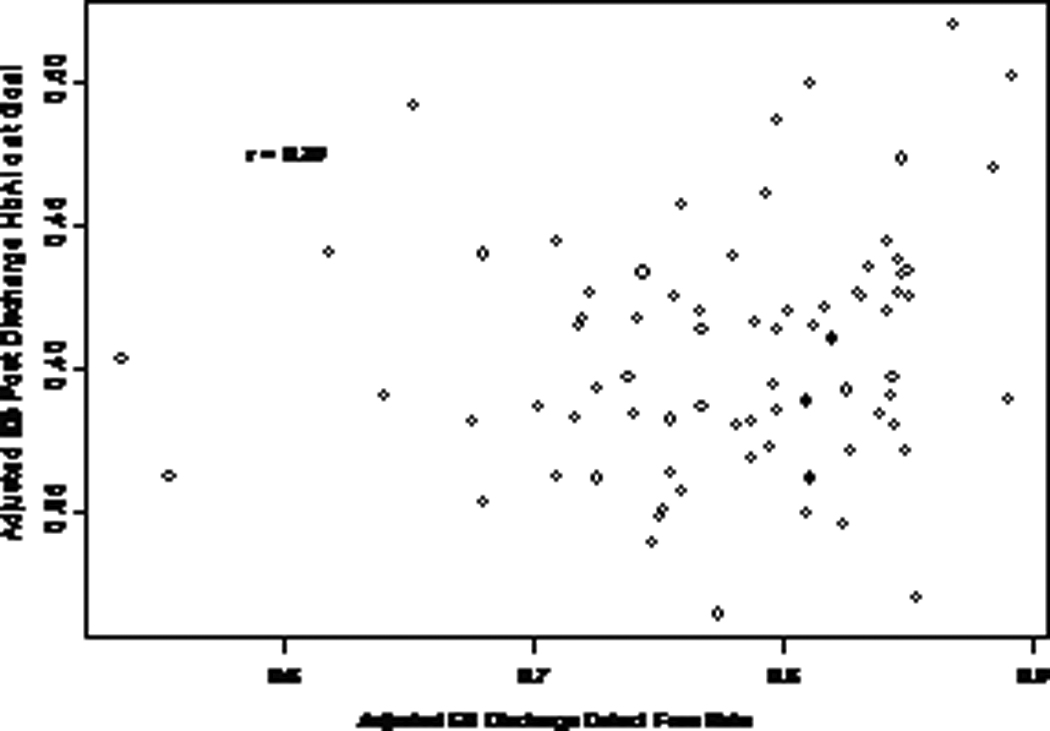
Correlation between hospital rates of delivering care to ischemic stroke patients at discharge and 6 month post-discharge outcomes, specifically achieving target A) blood pressure, B) serum low-density lipoprotein, C) serum international normalized ratio, and D) serum glycosylated hemoglobin.
Figure 3.
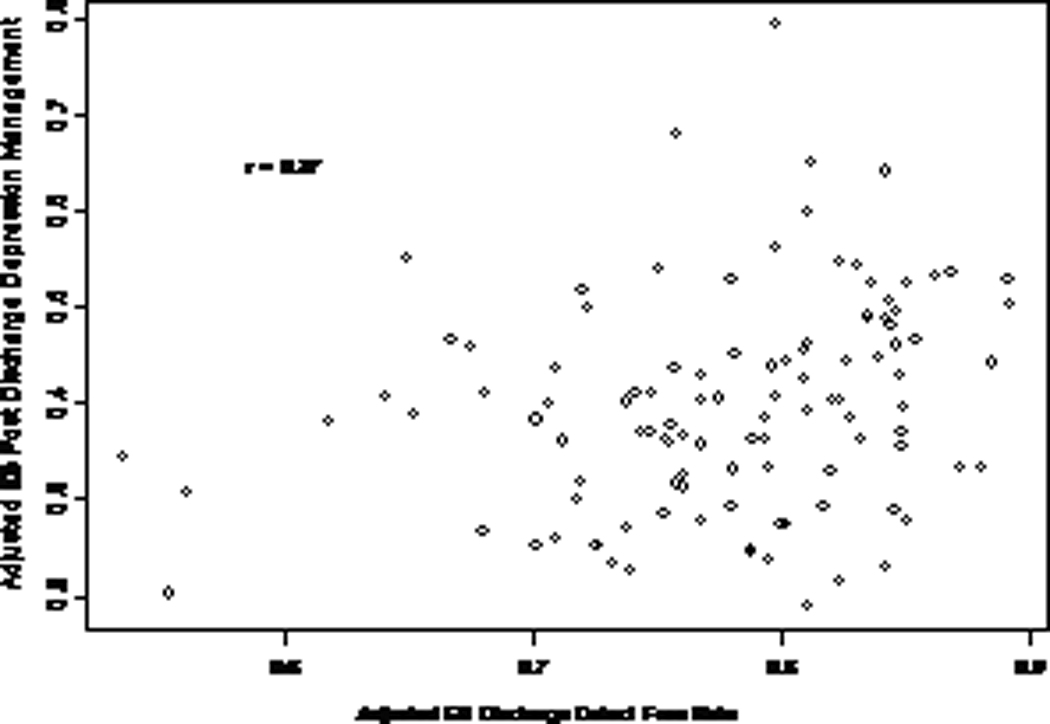
Correlation between hospital rates of delivering care to ischemic stroke patients at discharge and 6 month post-discharge outcomes, specifically A) post-stroke depression screening and management and B) composite achievement of outcomes.
Table 3.
Weighted Pearson’s Correlation Coefficients for Risk-adjusted Veterans Health Administration Hospital Quality of Care for Veterans with Ischemic Stroke, Fiscal Year 2007.*
| Processes of Care at Discharge | 6-Month Post-Discharge Outcomes | ||||||||||
|---|---|---|---|---|---|---|---|---|---|---|---|
| D1 | D2 | D3 | D4 | DComp | PD1 | PD2 | PD3 | PD4 | PD5 | PDComp | |
| D1 | … | 0.30 | 0.18 | 0.01 | 0.47 | −0.04 | 0.16 | −0.04 | 0.27 | 0.27 | 0.27 |
| D2 | … | 0.26 | 0.14 | 0.92 | −0.18 | 0.30 | −0.08 | 0.16 | 0.21 | 0.19 | |
| D3 | … | 0.10 | 0.43 | 0.01 | 0.07 | −0.16 | −0.07 | −0.01 | −0.01 | ||
| D4 | … | 0.32 | −0.08 | −0.14 | 0.05 | 0.07 | 0.13 | 0.00 | |||
| DComp | … | −0.22 | 0.31 | −0.12 | 0.20 | 0.27 | 0.21 | ||||
| PD1 | … | −0.05 | −0.08 | 0.18 | 0.02 | 0.41 | |||||
| PD2 | … | −0.13 | 0.22 | 0.31 | 0.56 | ||||||
| PD3 | … | −0.05 | 0.10 | 0.14 | |||||||
| PD4 | … | 0.35 | 0.51 | ||||||||
| PD5 | … | 0.84 | |||||||||
| PDComp | … | ||||||||||
Notes: D1= Antithrombotic therapy; D2= Antilipidemic therapy; D3= Anticoagulation for atrial fibrillation; D4= Tobacco cessation counseling for smokers; DComp=Composite delivery of defect-free processes at discharge; PD1= Blood pressure measured and meets goal; PD2= Serum low-density lipoprotein measured and meets goal; PD3=Serum international normalized ratio measured and meets goal; PD4=Serum glycosylated hemoglobin measured and meets goal; PD5= Depression screening and appropriate treatment when indicated; PDComp=Composite achievement of outcomes post-discharge.
Hospital rates risk-adjusted for patient characteristics.
DISCUSSION
We found that VHA hospital care quality on delivering recommended processes of care at discharge for ischemic stroke patients, as measured using a composite of defect-free delivery of care, explained only 10% and 7% of the hospital-level variation in the achievement of two intermediate outcomes of care during the 6 month post-discharge period for ischemic stroke patients: meeting LDL goals and appropriate screening and management of depression. However, VHA hospital performance on care at discharge was not associated with three other intermediate outcomes of care for ischemic stroke patients: meeting blood pressure, INR, and HbA1c goals. Nor was VHA hospital performance at discharge associated with a composite measure of these five post-discharge intermediate outcomes of care. These findings suggest that a VHA hospital’s 6 month achievement of important ambulatory care outcomes cannot be reliably inferred from performance on process measures at discharge.
This is the first study, to our knowledge, to have examined whether the quality of care delivered upon discharge from the inpatient setting predicts patient outcomes in the ambulatory care setting. There are several possible reasons for why we did not observe a consistent correlation between delivery of processes of care at discharge and intermediate outcomes post-discharge after hospitalization for ischemic stroke. First, organizationally, we hypothesized that within a facility operating within an integrated health care system, quality would diffuse across areas of the medical center. Unfortunately, our results suggest that excellence in one area of care, (i.e., care at discharge) does not predict quality in another area of care (i.e., ambulatory follow-up care), even if restricted to care for a single condition. Despite physician continuity between the inpatient and outpatient setting for stroke care, there are still transitions between different types of providers, perhaps limiting correlation of performance. Second, clinically, the components of care that were evaluated in this study included discrete aspects of care delivery rather than being a comprehensive assessment of quality. While these processes of care are included in clinical practice guidelines and have been linked to patient outcomes, and despite explicit links between certain processes and intermediate outcomes, such as prescribing antilipidemic therapy and meeting LDL goals, outcomes of care post-discharge are likely influenced by many factors that are independent of these processes of care at discharge. Furthermore, the composite measure of discharge care quality included only a subset of measurable activities for ischemic stroke care at VHA hospitals. Perhaps a measure that included additional processes of care, such as the provision of comprehensive discharge planning that includes patient education and appointment scheduling, would have been correlated with ambulatory care quality.
Another reason for why we may not have observed a consistent correlation is that the processes of care at discharge are principally under the locus of control of providers, whereas achieving better outcomes during post-discharge follow-up, such as adherence to medical therapy or management of blood pressure, is far more complicated and is controlled by neither providers nor patients but requires engaged partnership. For instance, providers are directly responsible for prescribing antithrombotic or antilipidemic therapy or providing tobacco cessation counseling at discharge. However, ensuring that blood pressure or serum markers such as LDL or HbA1c are measured and meet goal requires patients to keep appointments, providers to order the necessary follow-up tests, providers to prescribe proper medical therapy, and patients to adhere to therapy.
There are other considerations. First, our analysis focused on five intermediate outcomes of care and did not include patient-centered outcomes, such as satisfaction or function. For the intermediate outcomes, there is disagreement over target thresholds for complex patients, such as those recently hospitalized with ischemic stroke. However, we deliberately chose conservative thresholds for measurement. Second, our study focused on only one condition, ischemic stroke, and may not be generalizable to other conditions for which quality measurement is more common, such as myocardial infarction. Third, our study was cross-sectional and unable to assess causation. Finally, nearly 6% of patients were excluded from analyses because they had no post-discharge care at a VAMC within 6 months, although it’s unclear whether these patients received appropriate care outside of the VHA or were lost to follow-up.
Summary
In conclusion, hospital discharge care quality was not consistently correlated with ambulatory care quality within the VHA’s integrated health care system. Quality improvement efforts should remain focused on clinically important processes of care, however, quality managers should be aware that there may be only minimal “creep” of high-quality performance from one setting to another. The impact of bundled payments around episodes of care on quality across settings, as well as the medical home model that is now being implemented within VHA and in the private sector, deserve further scrutiny.
Acknowledgements
Funding/Support and Role of the Sponsor
This project was supported by the Veterans Affairs (VA) Office of Quality and Performance (OQP) and the VA Health Services Research and Development (HSR&D) Stroke Quality Enhancement Research Initiative (QUERI) (RRP 09-184). Dr. Ross is currently supported by the National Institute on Aging and by the American Federation of Aging Research through the Paul B. Beeson Career Development Award Program (K08 AG032886).
Footnotes
Publisher's Disclaimer: This is a PDF file of an unedited manuscript that has been accepted for publication. As a service to our customers we are providing this early version of the manuscript. The manuscript will undergo copyediting, typesetting, and review of the resulting proof before it is published in its final citable form. Please note that during the production process errors may be discovered which could affect the content, and all legal disclaimers that apply to the journal pertain.
Conflicts of Interest/Disclosures
No financial conflicts of interest to disclose.
REFERENCES
- 1.Institute of Medicine. To err is human: Building a safer health system. Washington, DC: National Academy Press; 2000. [Google Scholar]
- 2.Institute of Medicine. Crossing the quality chasm: A new health system for the 21st century. Washington, DC: National Academy Press; 2001. [PubMed] [Google Scholar]
- 3.Bradley EH, Herrin J, Elbel B, McNamara RL, Magid DJ, Nallamothu BK, Wang Y, Normand SL, Spertus JA, Krumholz HM. Hospital quality for acute myocardial infarction: Correlation among process measures and relationship with short-term mortality. JAMA. 2006;296:72–78. doi: 10.1001/jama.296.1.72. [DOI] [PubMed] [Google Scholar]
- 4.Peterson ED, Roe MT, Mulgund J, DeLong ER, Lytle BL, Brindis RG, Smith SC, Jr, Pollack CV, Jr, Newby LK, Harrington RA, Gibler WB, Ohman EM. Association between hospital process performance and outcomes among patients with acute coronary syndromes. JAMA. 2006;295:1912–1920. doi: 10.1001/jama.295.16.1912. [DOI] [PubMed] [Google Scholar]
- 5.Werner RM, Bradlow ET. Relationship between medicare's hospital compare performance measures and mortality rates. JAMA. 2006;296:2694–2702. doi: 10.1001/jama.296.22.2694. [DOI] [PubMed] [Google Scholar]
- 6.Jha AK, Orav EJ, Epstein AM. Public reporting of discharge planning and rates of readmissions. N Engl J Med. 2009;361:2637–2645. doi: 10.1056/NEJMsa0904859. [DOI] [PubMed] [Google Scholar]
- 7.Institute of Medicine. Rewarding provider performance: Aligning incentives in medicare. Washington, DC: National Academy Press; 2007. [Google Scholar]
- 8.Medicare Payment Advisory Commission. [Accessed December 20, 2010];Promoting greater efficiency in medicare, report to the congress. http://www.medpac.gov/documents/Jun07_EntireReport.pdf.
- 9.Feussner JR, Kizer KW, Demakis JG. The quality enhancement research initiative (queri): From evidence to action. Med Care. 2000;38:I1–I6. doi: 10.1097/00005650-200006001-00001. [DOI] [PubMed] [Google Scholar]
- 10.Kizer KW. The "New va": A national laboratory for health care quality management. Am J Med Qual. 1999;14:3–20. doi: 10.1177/106286069901400103. [DOI] [PubMed] [Google Scholar]
- 11.Kizer KW, Demakis JG, Feussner JR. Reinventing va health care: Systematizing quality improvement and quality innovation. Med Care. 2000;38:17–16. [PubMed] [Google Scholar]
- 12.Bravata DM, Ordin DL, Vogel WB, Williams LS. The quality of va inpatient ischemic stroke care, fy2007: Final national and medical center results of the vha office of quality and performance (oqp) special study. Washington, DC: Department of Veterans Affairs; 2009. [Google Scholar]
- 13.Austin PC, Tu JV, Alter DA. Comparing hierarchical modeling with traditional logistic regression analysis among patients hospitalized with acute myocardial infarction: Should we be analyzing cardiovascular outcomes data differently? Am Heart J. 2003;145:27–35. doi: 10.1067/mhj.2003.23. [DOI] [PubMed] [Google Scholar]
- 14.Burgess JF, Jr, Christiansen CL, Michalak SE, Morris CN. Medical profiling: Improving standards and risk adjustments using hierarchical models. J Health Econ. 2000;19:291–309. doi: 10.1016/s0167-6296(99)00034-x. [DOI] [PubMed] [Google Scholar]
- 15.Krumholz HM, Wang Y, Mattera JA, Han LF, Ingber MJ, Roman S, Normand S-LL. An administrative claims model suitable for profiling hospital performance based on 30-day mortality rates among patients with an acute myocardial infarction. Circulation. 2006;113:1683–1692. doi: 10.1161/CIRCULATIONAHA.105.611186. [DOI] [PubMed] [Google Scholar]
- 16.Landrum MB, Normand S-LT. Analytical methods for constructing cross-sectional profiles of health providers. Health Services and Outcomes Research Methodology. 2000;1:23–47. [Google Scholar]
- 17.Normand S-LT, Glickman ME, Gatsonis CA. Statistical methods for profiling providers of medical care: Issues and applications. Journal of the American Statistical Association. 1997;92:803–814. [Google Scholar]
- 18.Arling G, Lewis T, Kane RL, Mueller C, Flood S. Improving quality assessment through multilevel modeling: The case of nursing home compare. Health Serv Res. 2007;42:1177–1199. doi: 10.1111/j.1475-6773.2006.00647.x. [DOI] [PMC free article] [PubMed] [Google Scholar]
- 19.Raudenbush SW, Bryk AS. Hierarchical linear models: Applications and data analysis methods. Thousand Oaks, CA: Sage Publications; 2002. [Google Scholar]
- 20.Szabo CR. 2005 facility complexity model. Washington, DC: Veterans Healthcare Administration National Leadership Board Human Resources Committee; 2005. Aug 9, [Google Scholar]