Abstract
Proton beam therapy can deliver high radiation dose to a tumor without significant damage to surrounding healthy tissue or organs. One way of verifying the delivered dose distribution is to image the short-lived positron emitters produced by the proton beam as it travels through the patient. A potential solution to the limitations of PET imaging in proton beam therapy is the development of a high sensitivity, in-situ PET scanner that starts PET imaging almost immediately after patient irradiation while the patient is still lying on the treatment bed. A partial ring PET design is needed for this application in order to avoid interference between the PET detectors and the proton beam, as well restrictions on patient positioning on the couch. A partial ring also allows us to optimize the detector separation (and hence the sensitivity) for different patient sizes. Our goal in this investigation is to evaluate an in-situ PET scanner design for use in proton therapy that provides tomographic imaging in a partial ring scanner design using time-of-flight (TOF) information and an iterative reconstruction algorithm. A GEANT4 simulation of an incident proton beam was used to produce a positron emitter distribution, which was parameterized and then used as the source distribution inside a water-filled cylinder for EGS4 simulations of a PET system. Design optimization studies were performed as a function of crystal type and size, system timing resolution, scanner angular coverage, and number of positron emitter decays. Data analysis was performed to measure the accuracy of the reconstructed positron emitter distribution as well as the range of the positron emitter distribution.
We simulated scanners with varying crystal size (2 to 4 mm) and type (LYSO and LaBr3) and our results indicate that 4-mm wide LYSO or LaBr3 crystals (resulting in 4-5-mm spatial resolution) are adequate; for a full-ring, non-TOF scanner we predict a low bias (< 0.6-mm) and a good precision (< 1-mm) in the estimated range relative to the simulated positron distribution. We then varied the angular acceptance of the scanner ranging from 1/2 to 2/3 of 2π; with a partial ring TOF imaging with good timing resolution (≤ 600ps) is necessary to produce accurate tomographic images. A two-third ring scanner with 300ps timing resolution leads to a bias of 1.0-mm and a precision of 1.4-mm in the range estimate. With a timing resolution of 600ps, the bias increases to 2.0-mm while the precision in the range estimate is similar. For a half ring scanner design, more distortions are present in the image, which is characterized by the increased error in the profile difference estimate. We varied the number of positron decays imaged by the PET scanner by an order of magnitude and we observe some decrease in the precision of the range estimate for lower number of decays, but all partial ring scanner designs studied have a precision ≤ 1.5-mm. The largest number tested, 150M total positron decays, is considered realistic for a clinical fraction of delivered dose, while the range of positron decays investigated in this work covers a variable number of situations corresponding to delays in scan start time and the total scan time. Thus, we conclude that for partial ring systems, an angular acceptance of at least 1/2 (of 2π) together with timing resolution of 300ps is needed to achieve accurate and precise range estimates. With 600ps timing resolution an angular acceptance of 2/3 (of 2π) is required to achieve satisfactory range estimates. These results indicate that it would be feasible to develop a partial-ring dedicated PET scanner based on either LaBr3 or LYSO to accurately characterize the proton dose for therapy planning.
1. Introduction
Conventional radiation therapy (RT) is a localized form of therapy using X-rays to kill tumor cells with a goal of total local tumor remission, which may lead to a lower risk for metastases. Hence, the aim in conventional RT is to provide maximal radiation dose to the tumor and minimal dosage (or damage) to the surrounding tissue or critical organs. Proton therapy, or other forms of hadron therapy, reduces the dose to normal tissue because charged particles deliver most of their energy near the end point as defined by the Bragg peak. The depth of the end point is determined by the beam energy. The delivery of a heavy radiation dose to the tumor cells, however, requires a precise estimation of the beam delivery, since any mis-alignment can cause significant damage to healthy tissue. In particular, inhomogeneities along the beam path (such as the presence of bone or air gaps) can lead to range estimate errors of greater than 10% due to the differences between the X-rays used in CT planning and the charged particles like the hadrons (Mustafa and Jackson, 1983, Alpen et al., 1985). All forms of hadron therapy would therefore benefit from monitoring the range of the incident beam, as well as its lateral spread, when irradiating regions near critical organ(s) in order to achieve tighter margins around the treatment area. The interaction of the fast projectiles (hadrons) with nuclei in the target tissue leads to the generation of β+ emitters through nuclear fragmentation reactions. Positron emission tomographic (PET) imaging of these β+ emitters has therefore been suggested as an important tool in providing a non-invasive, in vivo verification of the treatment delivery in this situation (Oelfke et al., 1996, Pawelke et al., 1997, Litzenberg et al., 1999), where the β+ emitter distribution imaged in the PET scanner can be correlated to the position of the proton Bragg peak.
The β+ emitters generated in proton therapy are mainly 15O (half-life of 122s), 11C (half-life of 1218s), and 13N (half-life of 598s). For every tissue type the relative ratios of these isotopes produced vary, depending upon the stable isotope composition of the tissue and the reaction cross-section. On average, we expect to see the generation of a β+ emitter density in the range of about 0.1 kBq/cc in a patient as shown by Enghardt, et. al. for 11C ions (Enghardt et al., 2004). In contrast, for routine [18F]-fluorodeoxyglucose (FDG) clinical diagnostic imaging studies the background activity concentration in the patient is about 3.7 kBq/cc with a tumor uptake typically much higher than the background level. The low β+ emitter density together with their short half-lives leads to a demand for a high sensitivity PET scanner that can acquire data immediately after the proton beam irradiation. It should be noted, however, that while in 18F-FDG clinical imaging the tumor, or the signal, is located in a background with a lower uptake, the β+ emitters in proton therapy (signal) are located in a low or no background. So while the β+ emitter density is much lower than what is seen in 18F-FDG clinical imaging, one does not need a PET scanner with almost two orders of magnitude higher sensitivity than a clinical PET/CT.
Currently, in some of the hadron therapy facilities where PET is being evaluated for this application, the patient is moved to a different room for imaging in a conventional whole-body PET/CT scanner (delayed, off-line imaging). In this situation mainly the 11C decays (Hishikawa et al., 2002, Parodi et al., 2007) are detected since the short-lived 15O isotopes have already decayed and very little of 13N is produced due to low abundance of 14N in tissue. With a typical delay of 15-20 minutes, this translates into a loss of almost all the 15O decays and about half the 11C decays as well. Assuming that at least an equal number of 15O and 11C isotopes are generated (this is really a function of tissue composition and, as explained above/below, in some situations there are more 15O isotopes produced), this leads to a reduction by at least a factor of four in the number isotope decays that occur once the PET scan begins. Additionally, the limited sensitivity of a state-of-art, whole-body PET/CT scanner will restrict the number of β+ decays detected in delayed, off-line imaging and hence the accuracy of the PET image for proton dose verification will be compromised. Also, patient setup errors and errors due to blood perfusion and biological washout of β+ emitters after the delay in off-line imaging, can lead to a degradation in spatial correlation between the β+ activity and delivered dose (Parodi et al., 2008). This indicates that the current way to test and evaluate proton dose monitoring with delayed PET imaging has limitations that may preclude our ability to determine potential benefits of this technique. Using a clinical PET/CT scanner placed in the beam room can overcome some of the problems of off-line imaging arising due to biological washout, as well as permit imaging a larger fraction of 15O decays. However, the use of a clinical PET/CT with limited sensitivity is still a problem, and the PET image will be susceptible to patient motion since the bed or the patient needs to be moved in order to place the patient within the PET field-of-view (FOV).
A potential solution to the limitations of PET imaging in proton beam therapy is the development of a high sensitivity, in-situ PET scanner that starts PET imaging almost immediately after proton irradiation while the patient is still lying on the treatment bed. At the carbon ion facility at the Gesellschaft für Schwerionenforschung (GSI) in Darmstadt, Germany a partial ring in-beam PET scanner was developed for in-situ monitoring of delivered dose (Enghardt et al., 1999) during beam delivery and has been operational for many years. New experimental planar positron cameras suitable for in-situ imaging have also been developed at HIMAC (Iseki et al., 2003), Kashiwa (Nishio et al., 2006, Nishio et al., 2010), and in Pisa (Attanasi et al., 2008). All these in-situ PET scanners operate with a fixed ring diameter. A major physical restriction on the design of an in-situ PET scanner is the need for an opening in the scanner ring in order avoid interference between the PET detectors and the proton beam, as well as restrictions on patient positioning on the couch. Therefore, all these in-situ PET scanners also operate with a partial detector ring geometry. However, limited angle coverage of the imaging plane due to the partial ring, leads to an incomplete sampling of the in-plane angles and produces artifacts in image reconstruction (Townsend et al., 1980, MacDonald et al., 1982). Without detector rotation to collect all projection data, such a device is limited in its ability to produce tomographic images without artifacts, thus compromising its imaging capabilities. Incorporating detector rotation would make the scanner gantry more complex and expensive, as well as increase the scan time. Alternately, there has been a recent proposal of an in-situ scanner with two complete detector rings with a gap in between to accommodate the beam line (Yamaya et al., 2008).
Our goal in this investigation is to evaluate an in-situ PET scanner design for use in proton therapy that provides tomographic imaging in a partial ring scanner design using time-of-flight (TOF) information and an iterative reconstruction algorithm. Some of our recent work has shown that the number of angular views necessary for an artifact-free image reconstruction is reduced as timing resolution in TOF PET improves (Vandenberghe and Lemahieu, 2007) Application of TOF PET to a dedicated, partial ring breast PET scanner showed significant improvements in the reconstructed images for a partial ring scanner design (Surti and Karp, 2008). In this work we evaluate through Monte Carlo simulations the impact of: (i) crystal size (scanner spatial resolution), (ii) timing resolution and partial ring coverage of the scanner, and (iii) number of β+ decays on the resultant PET image. The reconstructed PET images are compared relative to the simulated β+ distribution in order to quantify the impact of scanner design on its proton dose verification capability.
2. Methods
2.1. Simulation setup
GEANT4 simulations (Agostinelli et al., 2003) were first performed to simulate the generation of positron emitting radio-nuclides in a 30-cm diameter cylindrical, skeletal muscle phantom (ranging from −15-cm to 15-cm as shown in figure 1a) after irradiation by a 4×4-cm2, 125-MeV beam of mono-energetic protons (beam end-point at 11.46-cm inside the phantom). The passage of protons through the phantom was simulated through a series of physical interactions and the distribution of positron emitting isotopes generated was determined. In figure 1b we show the total isotope distribution along the depth direction from GEANT4 simulation as parameterized and subsequently used as the source distribution in the PET scanner design simulations that we have performed with our EGS4 based Monte Carlo simulation tools (Adam et al., 1999, Surti et al., 2004).
Figure 1.
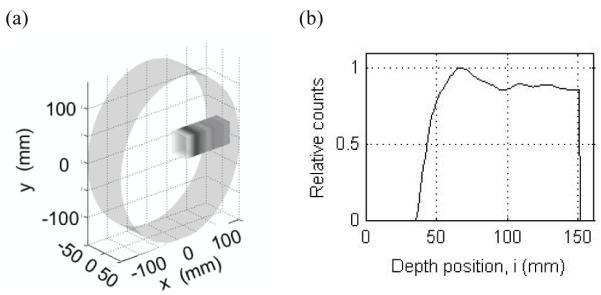
(a) A 3D rendering of the positron emitter distribution generated in GEANT4 for a 30-cm diameter skeletal muscle cylinder after irradiation by a 4×4-cm2, 125-MeV beam of mono-energetic protons. The x coordinate is the depth coordinate i. (b) The total isotope distribution from GEANT4 simulation is parameterized along the depth direction, and used as the source distribution for PET scanner design simulations in EGS4.
We simulated a PET scanner with a ring diameter of 85-cm and an axial field-of-view of 18.7-cm (typical dimensions for a clinical whole-body PET system). The transverse field-of-view was set at 57.6-cm. The proton beam was simulated as being delivered horizontally to the phantom as shown in figure 2a, with a partial ring coverage that allows patient irradiation. In our simulation three PET ring configurations (figure 2b) were evaluated: a full ring which has no gaps and is impractical for use when the patient is scanned while lying on the proton therapy bed, and two partial ring setups that represent practical scanner designs. The two partial ring designs investigated were the two-third ring setup with a 120 degree in-plane angular coverage (instead of the 180 degree in a full ring), and a half ring setup with a 90 degree in-plane angular coverage. It is important to point out that a dedicated partial ring PET scanner (limited angle coverage) would probably have a smaller ring diameter to improve scanner sensitivity, but for this investigation we have fixed the scanner diameter and just varied the angular coverage. The 511 keV photon interactions in the scintillator were based on Compton and photoelectric interaction probabilities of the chosen scintillator type and its length. No depth-of-interaction measurement capability was modeled and so imaging performance will have realistic parallax error limitations. However, for this application where the proton beam enters radially into the patient and the beam end-point is near the center of the scanner, parallax errors will have a negligible impact on the reconstructed positron emitter image. The simulated “patient” was a 30-cm water-filled cylinder which represents the attenuation medium (tissue) present in an average size adult patient (Surti et al., 2007). The isotope distribution was modeled as shown in figure 2a where the profile along the proton beam (depth) direction was modeled from figure 1b, and in the two orthogonal directions it was uniformly distributed for a beam width of 4-cm. The simulation output was a list-mode file with time-of-flight information and included true and scattered coincidences.
Figure 2.
(a) Simulation arrangement of a PET scanner with the incident proton beam from the right. The scanner axial direction is perpendicular to the proton beam and into page as shown here. The sphere shows a 30-cm water phantom and the colored bar indicates the distribution of positron emitters produced within it by the proton beam. The profile of the positron emitters along the beam direction was parameterized as shown in figure 1b. (b) Simulated PET system geometries with partial ring configurations. The angular coverage of the ring studied includes a full ring (left), a two-third ring that corresponds to ±120° angular coverage (middle), and a half ring that corresponds to ±90° angular coverage (right).
2.2. Image generation and parameters studied
For attenuation correction, an analytical calculation was performed for a cylinder phantom with dimensions equal to those of the simulated phantom with water attenuation coefficient at 511-keV. Scatter estimation was performed using a TOF-extended single scatter simulation (Werner et al., 2006, Watson, 2007). Finally, image reconstruction was performed using a list-mode iterative ordered subsets expectation maximization (OSEM) algorithm (Hudson and Larkin, 1994) with a Gaussian TOF kernel, 33 subsets, and all corrections built into the system model (Popescu, 2004). The image reconstruction algorithm has no depth-of interaction information, and it is assumed that the end-points of each line-of-response lie at the center of each crystal. The images were reconstructed into 1×1×1-mm3 voxels, leading to a total of 576×576×187 voxels in the image space.
Simulations were performed and reconstructed images generated for a scanner using 2×2×30-mm3, 3×3×30-mm3, and 4×4×30-mm3 lutetium-yttrium oxyorthosilicate (LYSO) and lanthanum bromide (LaBr3) crystals. We modeled a Non-TOF scanner as well as a TOF scanner with 300, 600 and 1000ps timing resolutions. The number of positron annihilations simulated in the scanner was varied between 150M, 75M, 60M, 30M, and 15M, where 150M corresponds to the total number of positron emitting nuclei produced after a typical clinical dose for one fraction. In our clinic, we normally deliver 1.8-2Gy per fraction but from several fields. In addition, a high statistics simulation corresponding to 6 billion positron emitting nuclei was also simulated to evaluate the impact of crystal type and size, as well as partial ring geometry, on the reconstructed images.
2.3. Data analysis
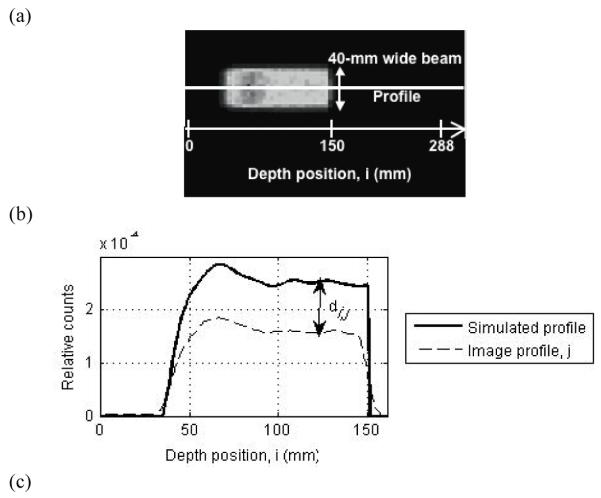
For image evaluation we first added the 40, 1-mm thick transverse image slices to produce a single 40-mm thick transverse image slice (beam is 40-mm wide axially). Next we generated 36, 1-mm wide profiles along the depth direction, i, over the central 36-mm of the beam (see figure 3a). All subsequent analysis was performed on these 36 depth profiles for every image. We chose two different metrics for evaluating these profiles: (i) profile difference estimation metric, and (ii) profile range estimation metric.
Figure 3.
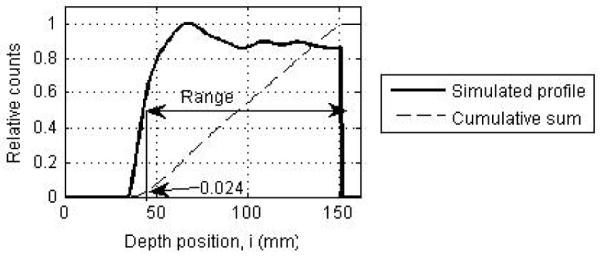
(a) Transverse slice of a reconstructed PET image of the positron emitters produced after a proton beam irradiation. The solid white line shows a depth profile, j, drawn through this image. Since the beam is 40-mm wide orthogonal to the depth direction, 36 central depth profiles were drawn for analysis. (b) Depth profile from the PET image (dashed line) and the depth profile of simulated activity (solid line). Profiles are normalized to total counts in the image. The image profile is shown for a full ring Non-TOF scanner design. (c) Simulated depth profile (solid line) normalized to its peak position and cumulative sum of the profile (dashed line) normalized to total counts in the image. The profile range is defined as the position where the profile has a value of 0.5, which also corresponds to a value of 0.024 on its cumulative sum.
Profile difference estimation
This metric measures the number of misplaced counts in the reconstructed image when compared to the simulated image and represents a measure of reconstructed image fidelity to the simulated distribution. For this metric, we compare each image depth profile, j, to the simulated depth profile, where both profiles are normalized to the total counts in the image. The absolute difference in counts, di,j, along each pixel, i, for profile j is then calculated. Figure 3b shows an example of this measurement performed for on image depth profile. Note that the image profile has reduced relative counts compared to the simulated profile. This is because the counts in the reconstructed image are spread beyond the central 4-cm width of the simulated distribution due to partial volume effects (see Figure 3a). The total relative error, dtotal, mean relative error, dmean, and standard deviation of relative error, dstdev are finally calculated as follows:
Profile range estimation
Traditionally, the depth position where the depth profile reaches a value of 50% relative to its peak has been used as an estimate of the profile range (50% pickoff value). In figure 3a, we show the transverse slice of a reconstructed PET image through which a profile along the depth direction, i, has been drawn as shown by the solid line. A depth profile normalized to its peak value is shown in figure 3c. For fractionated treatment conditions, the number of counts collected in the PET scanner is very low and the image depth profiles are noisy. This leads to an uncertainty in determining the peak of the image depth profile that translates into an error in measuring the 50% peak pickoff value. In order to overcome this disadvantage, we calculate a cumulative sum of each image depth profile and normalize it to the total counts in the image. Using the simulated profile, we empirically determined that the 50% peak pickoff value on the depth profile corresponds to a depth position with a value of 0.024 for this normalized cumulative sum (as shown in figure 3c). We use this technique, to determine the 50% peak pickoff value over the 36 image depth profiles, followed by a calculation of the mean bias in range (relative to the simulated profile range) and its standard deviation over these 36 values. It should be stated that this technique of measuring 50% peak pickoff using the cumulative sum is applicable only in situations where we have a homogeneous material with flat edges. In this work the primary aim is optimization of the PET image relative to the simulated positron emitter distribution where such a simplified distribution is adequate. For correlation of the PET image with the Bragg peak, more complex metrics may be required.
3. Results
3.1. Impact of crystal size and type
Figure 4 selectively shows the reconstructed central transverse slice for a full ring Non-TOF scanner using the different crystal sizes and crystal types. Results are shown for a decay of 6 billion positron-emitting nuclei. Visually, there are no significant differences between all the images for different crystal sizes and types. In figure 5 we show a depth profile measured along the beam direction for three of these images together with the simulated profile. Qualitatively the profile shapes look very similar.
Figure 4.
Reconstructed PET images showing the central transverse slice of isotope distribution in scanners using different crystal sizes and types. The simulated scanner has full ring geometry and operated in Non-TOF mode.
Figure 5.
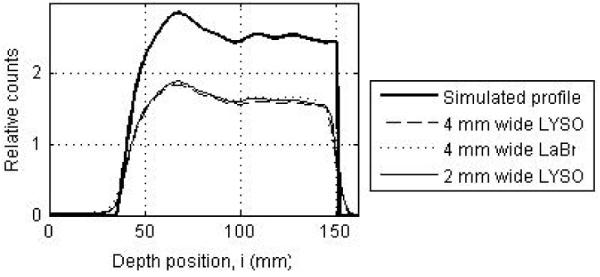
Depth profiles drawn through the central transverse image slices of a full ring Non-TOF scanner using: 4×4-mm2 LYSO crystals (dashed line), 4×4-mm2 LaBr3 crystals (dotted line), and 2×2-mm2 LYSO crystals (thin solid line). For comparison simulated profile is also shown (thick solid line).
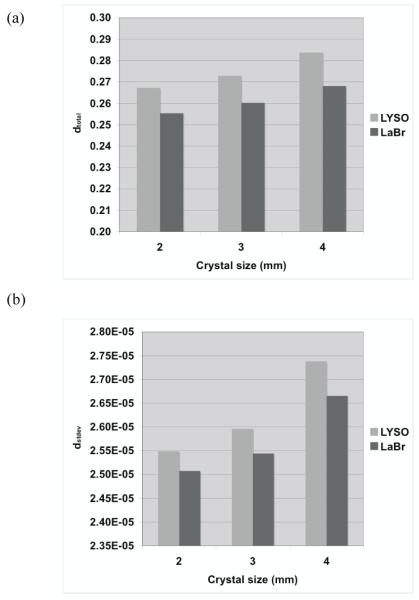
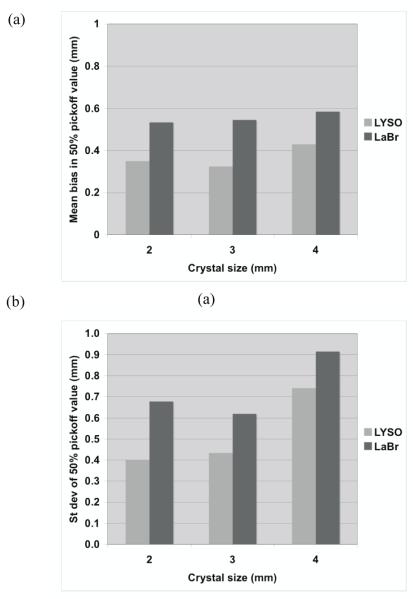
Figure 6 summarizes the total relative error (fraction of total counts misplaced) and its variation (standard deviation) as a function of crystal size and type. The changes in the error are relatively small for all crystals, suggesting that crystal type and size do not significantly affect the profile shape (< 7% difference). In figure 7 we show the bias in range estimation and the standard deviation or precision of the range estimation as a function of crystal size and type. The mean bias in range estimation is < 0.6-mm while the standard deviation of range estimation is < 1-mm for all crystal sizes and type. These results indicate that the range estimation errors are small for both types of crystal with sizes in the range of 2 to 4-mm wide.
Figure 6.
Measured (a) total profile difference (dtotal), and its (b) standard deviation (dstdev) for two different types of crystal and three crystal widths. The simulated scanner has full ring geometry and operated in Non-TOF mode.
Figure 7.
(a) Measured mean bias in the 50% peak pickoff values for a full ring PET scanner using three different crystal sizes and two crystal types. (b) The standard deviation of the range estimate using 50% peak pickoff value. The simulated scanner has full ring geometry and operated in Non-TOF mode.
3.2. Impact of scanner geometry
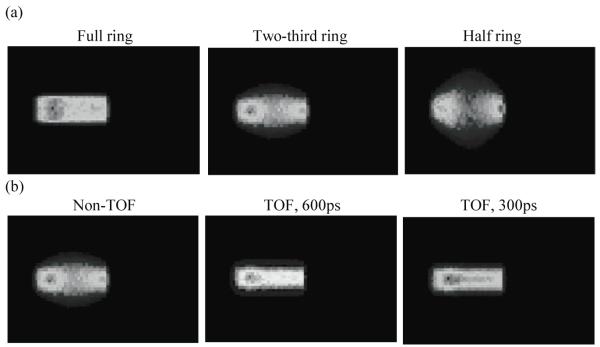
Figure 8a shows the reconstructed central transverse plane for the three scanner ring geometries when operating in Non-TOF mode. Results are shown for a scanner using 4×4×30-mm3 LYSO crystals and decay of 6 billion positron-emitting nuclei. As the ring coverage is reduced significant distortions and artifacts are observed in the reconstructed image. Figure 8b shows the reconstructed central transverse plane for the two-third ring scanner when operating in Non-TOF and TOF modes with varying timing resolutions. With TOF imaging, the image artifacts are visibly reduced as the timing resolution improves. In figure 9 we show image depth profiles for the images shown in figure 8. From figure 9a we observe that while the slope of the image depth profile for partial ring scanners may not be significantly different from the simulated profile, the overall shape of the profile is significantly distorted. With TOF imaging and improved timing resolution the overall shape of partial ring scanners is closer to the simulated profile shape (figure 9b).
Figure 8.
(a) Reconstructed PET images showing the central transverse slice of reconstructed positron emitter distribution in three different scanner geometries operating in a Non-TOF mode. (b) Reconstructed PET images showing the central transverse slice of reconstructed positron emitter distribution in a two-third ring scanner operating in Non-TOF mode, as well as TOF mode with varying timing resolution values. The simulated scanner had 4×4-mm2 LYSO crystals.
Figure 9.
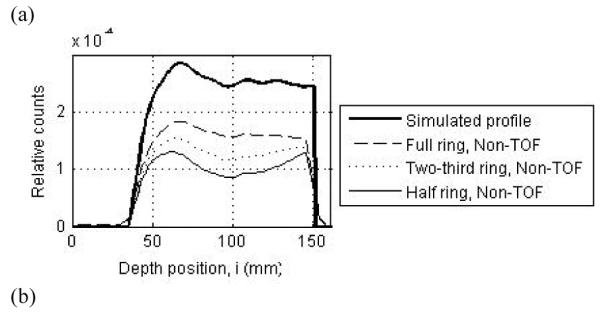
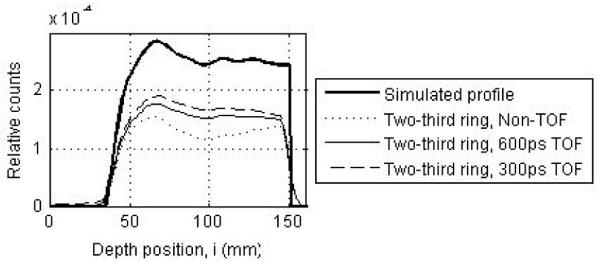
(a) Depth profiles drawn through the central transverse image of Non-TOF scanners with a full (dashed line), two-third ring (dotted line), and half ring (thin solid line). (b) Depth profiles drawn through the central transverse image of a two-third ring scanner operating in a Non-TOF mode (dotted line), and TOF mode with timing resolutions of 300ps (dashed line) and 600ps (thin solid line). For comparison the simulated profile is shown as the thick solid line in both plots. The simulated scanner had 4×4-mm2 LYSO crystals.
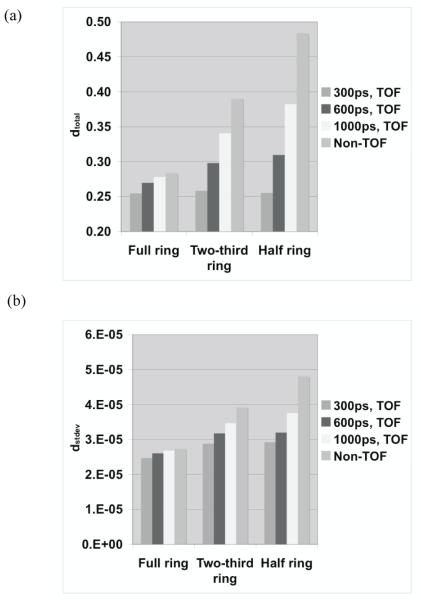
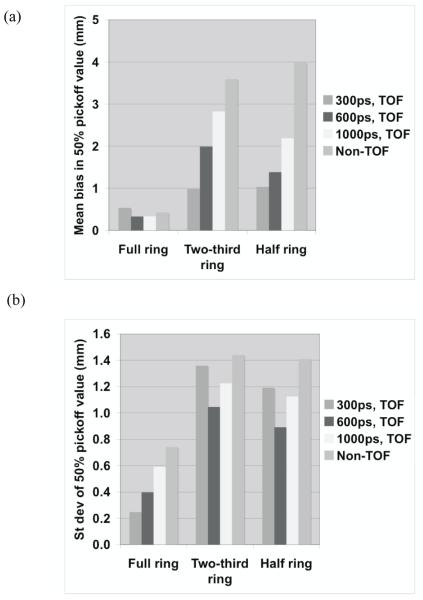
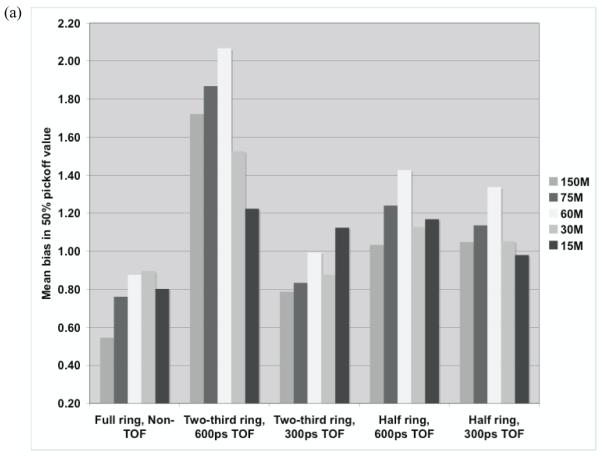
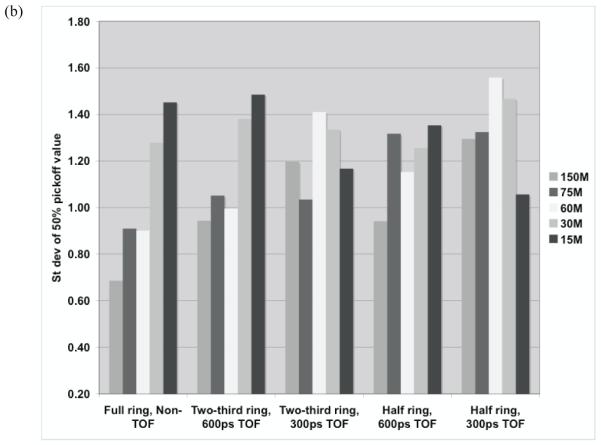
For quantitative results, figure 10 summarizes the total relative error (fraction of total counts misplaced) and its variation (standard deviation) for the three scanner ring geometries and Non-TOF and TOF image reconstruction. From figure 10a, we observe that improved timing resolution leads to a reduced total error in the images. This is consistent with the representative images shown in figure 8. In particular, while improved timing resolution (such as 300ps) leads to reduced error even in a full ring scanner, its biggest advantage is in partial geometries where the total error is similar to that in the full ring scanner. The impact of improved timing resolution is also evident in the reduced variation of total error as shown in figure 10b. In figure 11 we show the bias in range estimation and the standard deviation or precision of the range estimation for the three scanner ring geometries and Non-TOF and TOF image reconstruction. For full ring scanners, the mean bias in range estimation is < 0.5-mm, while the standard deviation of range estimation is lower (precision is higher) with improved timing resolution (< 0.8-mm). For the partial ring scanners, there is a 1-mm bias in the range estimate for 300ps timing resolution, and a 1.5-2-mm bias for a 600ps timing resolution. Since there is a large increase in total error (see figure 10) for 1000ps TOF and Non-TOF partial ring scanners, we also measure a significant bias in the range estimate. The standard deviation of the range estimate in 300ps TOF partial ring scanners is < 1.5-mm. The standard deviation values are similar or lower for the partial ring geometries with timing resolution ≥ 600ps and Non-TOF. This suggests that precision of the range estimate is not significantly improved with better timing resolution. However, this result is misleading since the total error is higher for these systems and leads to an inaccurate (large bias) measurement of the range.
Figure 10.
Measured (a) total profile difference (dtotal), and its (b) standard deviation (dstdev) for varying scanner geometries and timing resolutions. The simulated scanner had 4×4-mm2 LYSO crystals.
Figure 11.
(a) Measured mean bias in the 50% peak pickoff values for varying scanner geometries and timing resolutions. (b) The standard deviation of the range estimate using 50% peak pickoff value. The simulated scanner had 4×4-mm2 LYSO crystals.
3.3. Impact of the number of positron emitter decays
While good imaging statistics are needed to understand the impact of crystal width and timing resolution on scanner performance, optimization of scanner sensitivity will require the use of a lower radiation dose of < 2Gy, since this is typically what is delivered clinically per fraction of treatment. Figure 12 shows the depth profiles obtained from simulated PET images for varying number of positron emitter decays (150M corresponds to the total number of positron emitting nuclei produced after a typical clinical dose for one fraction). While the profile with 150M decays is smooth and makes it easy to measure the 50% profile peak pickoff directly, the other profiles are noisy and the 50% profile peak pickoff value will be sensitive to an incorrect peak location. Consequently, the technique of cumulative sum as described earlier was developed to more reliably measure the profile range.
Figure 12.
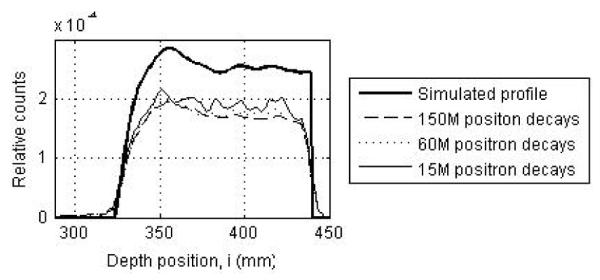
Depth profiles drawn through PET images acquired in a two-third ring LYSO PET scanner with 300ps timing resolution for 150M, 60M, and 15M positron decays. The thick solid line shows the simulated profile. The simulated scanner had 4×4-mm2 LYSO crystals.
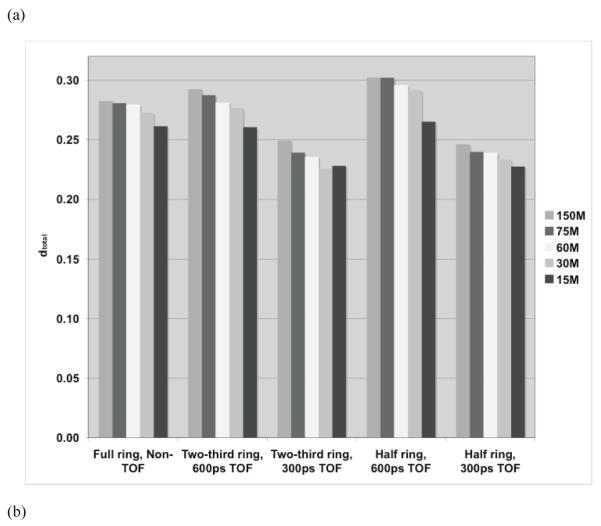
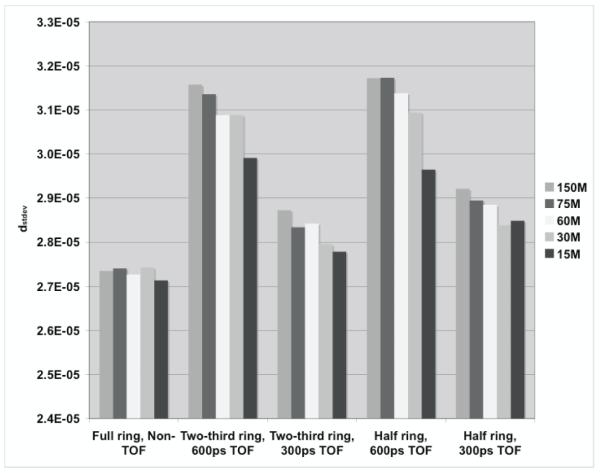
In figure 13 we show the total relative error and its standard deviation for the three scanner ring geometries as the number of decays of positron emitting nuclei is varied from 150M down to 15M. We restrict the results to a full ring Non-TOF scanner (standard), and the two partial ring TOF scanners with timing resolutions of 300ps and 600ps (4×4×30-mm3 LYSO crystals). This choice was made after the results from the earlier evaluation indicated the partial ring scanners produced fairly accurate images only with TOF information and a timing resolution of 600ps or better. Our results in figure 13a show that the total relative error does not vary significantly as a function of number of positron decays for a fixed scanner design (< 10% variation). This is expected since dtotal is a relative metric (calculated relative to total counts in the image), which is independent of statistics and shows that image accuracy does not change much over the different number of positron decays that were evaluated. We also see that partial ring scanners with TOF perform as well as or better than the standard full ring Non-TOF scanner. From figure 13b, we see that the standard deviation of relative error also does not vary significantly as a function of number of positron decays for a fixed scanner design (< 10% variation). In particular, partial ring scanners with 300ps timing resolution have a variation that is only slightly higher than that of the standard full ring Non-TOF scanner.
Figure 13.
Measured (a) total profile difference (dtotal), and its (b) standard deviation (dstdev) for the three scanner ring geometries as the number of decays of positron emitting nuclei is varied. The simulated scanner had 4×4-mm2 LYSO crystals.
In figure 14 we show the bias in range estimation and the standard deviation or precision of the range estimation for the three scanner ring geometries as the number of decays of positron emitting nuclei is varied from 150M down to 15M. From these plots we see that the bias in range estimate varies slightly as a function of number of positron decays for a fixed scanner design. This variation in mean bias as a function of number of positron decays is, however, reduced with improved timing resolution in partial ring scanners (< 0.4-mm). Overall, the mean bias in partial ring scanners is in the range of 1-2-mm which is similar to what we saw earlier (figure 12) with a very high number (6 billion) of positron decays data set. The standard deviation in range estimate is higher in partial ring scanners but improved timing resolution reduces this effect. Generally, there is also a slight increase in the standard deviation of the range estimate with decreasing number of positron decays, but it is always less than 1.5-mm for all setups studied here. The standard deviation of range estimate in partial ring scanners is again consistent with what we saw earlier (figure 12) with a very high number (6 billion) of positron decays data set.
Figure 14.
(a) Measured mean bias in the 50% peak pickoff values for the three scanner ring geometries as the number of decays of positron emitting nuclei is varied. (b) The standard deviation of the range estimate using 50% peak pickoff value. The simulated scanner had 4×4-mm2 LYSO crystals.
4. Discussion and conclusions
In this work we used two physical metrics to evaluate our in-situ PET scanner design. The first metric, the profile difference metric, measure the total relative error in the reconstructed image profile compared to the simulated profile. It, therefore, is a measure of the fidelity of the reconstructed PET image to the simulated positron emitter distribution generated by the proton beam. Since artifacts may result in images obtained from partial ring scanners, this metric is important to quantify the PET image accuracy. For this investigation we used the profile difference metric to evaluate the benefit of improved timing resolution in partial ring scanners to mitigate the effect of missing angular views on tomographic images. The second metric is the profile range metric that was defined to be the 50% peak pickoff value for the depth profile. While 50% peak pickoff value for the depth profile does not directly measure the proton range (location of the Bragg peak), it is expected to be well correlated to the Bragg peak (Oelfke et al., 1996).
Our results show that either LYSO or LaBr3 as a crystal will perform adequately for this scanner design. In addition, a crystal cross-section of 4×4-mm2 (spatial resolution of 4-5-mm) provides a low bias (< 0.6-mm) and a high precision (< 1-mm) in the estimated range relative to the simulated positron distribution, and is an appropriate choice for use in this scanner. For partial ring scanners, TOF imaging with good timing resolution (≤ 600ps) is necessary to produce accurate tomographic images. A two-third ring scanner with 300ps timing resolution leads to a bias of 1.0-mm and a precision of 1.4-mm in the range estimate. With a timing resolution of 600ps, the bias increases to 2.0-mm while the precision in the range estimate is similar. For a half ring scanner design, more distortions are present in the image, and a timing resolution of 300ps or better will be needed for accurate and precise range estimates. We varied the number of positron decays imaged by the PET scanner by an order of magnitude and we observe some decrease in the precision of the range estimate for lower number of decays, but all partial ring scanner designs studied have a precision ≤ 1.5-mm. The largest number tested, 150M total positron decays, is considered realistic for a clinical fraction of delivered dose, while the range of positron decays investigated in this work covers a variable number of situations corresponding to delays in scan start time and the total scan time. Thus, we conclude that for partial ring systems, an angular acceptance of at least 1/2 (of 2π) together with timing resolution of 300ps is needed to achieve accurate and precise range estimates. With 600ps timing resolution an angular acceptance of 2/3 (of 2π) is required to achieve satisfactory range estimates. These results indicate that it would be feasible to develop a partial-ring dedicated PET scanner based on either LaBr3 or LYSO to accurately characterize the proton dose for therapy planning.
Through this work we have demonstrated the basic feasibility of a partial ring in-situ PET scanner with TOF capability to achieve accurate tomographic images of the positron emitter distribution generated by the proton beam. The idea of using TOF imaging in a partial ring PET geometry for this application has previously been explored by Crespo, et. al. (Crespo et al., 2007). However, the conclusions in that work suggested that for a scanner with about a three-fourth ring would need a timing resolution of ≤ 200ps to achieve accurate images. In our work we conclude that a two-third ring scanner with about 600ps timing resolution can still provide accurate images for proton dose monitoring with < 2-mm bias in the range estimate. A primary advantage of a partial ring scanner design is its practicality for use as an in-situ PET scanner for proton beam therapy where an opening is needed in the scanner for the proton beam and patient positioning couch. Another advantage for this design is the higher imaging sensitivity achieved relative to conventional PET/CT since imaging can start immediately after therapy, allowing the capture of most 15O and 11C decays. In addition, the scanner ring diameter, which was fixed to be the same as in a commercial clinical PET/CT for these studies, could be varied to provide flexible and adaptive scanner geometry to provide large solid angle coverage and further improvements in scanner sensitivity.
Our investigation indicated that both LYSO and LaBr3 are suitable as the crystal that can be used in the PET scanner design for this application. However, the final choice of LYSO or LaBr3 as the crystal will require an independent scanner design optimization study since, (i) LYSO has a higher stopping power compared to LaBr3 and has demonstrated a practical system timing resolution in the range of 500-600ps (Surti et al., 2007, Jakoby et al., 2008, Kemp et al., 2009), indicating a larger ring coverage will be needed to achieve accurate images, and (ii) LaBr3 has demonstrated a practical system timing resolution of 375ps or better (Daube-Witherspoon et al., 2010), but its lower stopping power will require a smaller ring diameter or longer axial length to improve system sensitivity. Both crystals can likely achieve the goals for an in-situ PET scanner, albeit with different scanner designs to better optimize their intrinsic capabilities. A future design study will fold in the crystal stopping power and measured detector timing resolution information for optimization of the crystal length, scanner diameter, and scanner axial length for high sensitivity. These choices will affect the number of positron decays occurring during the PET scan and hence the range estimation. Additional considerations will include incorporation of information related to the number of different positron emitters produced and their half-lives (e.g. 15O and 11C), and an optimization of scan time with consideration to clinical workflow requirements in proton therapy.
Acknowledgments
We would like to thank Dr. S. Avery for his help in performing the early GEANT4 simulations. This work was supported in part by US Army grant number DAMD17-W81XWH-07-2-0121 and the National Institutes of Health grant number R01-CA113941.
References
- ADAM LE, KARP JS, BRIX G. Investigation of scattered radiation in 3D whole-body positron emission tomography using Monte Carlo simulations. Phys. Med. Biol. 1999;44:2879–2895. doi: 10.1088/0031-9155/44/12/302. [DOI] [PubMed] [Google Scholar]
- AGOSTINELLI S, ALLISON J, AMAKO K, APOSTOLAKIS J, ARAUJO H, ARCE P, ASAI M, AXEN D, AL. E. GEANT4 - a simulation tool kit. Nucl Instrum Meth A. 2003;506:250–303. [Google Scholar]
- ALPEN EL, SAUNDERS W, CHATTERJEE A, LLACER J, CHEN GTY, SCHERER J. A comparison of water equivalent thickness measurements: CT method vs heavy ion beam technique. Br. J. Radiol. 1985;58:542–548. doi: 10.1259/0007-1285-58-690-542. [DOI] [PubMed] [Google Scholar]
- ATTANASI F, BELCARI N, CAMARDA M, CIRRONE GAP, CUTTONE G, DEL GUERRA A, DI ROSA F, LANCONELLI N, ROSSO V, RUSSO G, VECCHIO S. Preliminary results of an in-beam PET prototype for proton therapy. Nucl Instrum Meth A. 2008;591:296–299. [Google Scholar]
- CRESPO P, SHAKIRIN G, FIEDLER F, ENGHARDT W, WAGNER A. Direct time-of-flight for quantitative, real-time in-beam PET: a concept and feasibility study. Phys. Med. Biol. 2007;52:6795–6811. doi: 10.1088/0031-9155/52/23/002. [DOI] [PubMed] [Google Scholar]
- DAUBE-WITHERSPOON ME, SURTI S, PERKINS AE, KYBA CCM, WIENER RI, KARP JS. Performance of a LaBr3-based Time-of-Flight PET Scanner. Phys Med Biol. 2010;55:45–64. doi: 10.1088/0031-9155/55/1/004. [DOI] [PMC free article] [PubMed] [Google Scholar]
- ENGHARDT W, CRESPO P, FIEDLER F, HINZ R, PARODI K, PAWELKE J, PONISCH F. Charged hadron tumour therapy monitoring by means of PET. Nucl Instrum Meth A. 2004;525:284–288. [Google Scholar]
- ENGHARDT W, DEBUS J, HABERER T, HASCH BG, HINZ R, JAKEL O, KRAMER M, LAUCKNER K, PAWELKE J, PONISCH F. Positron emission tomography for quality assurance of cancer therapy with light ion beams. Nuclear Physics A. 1999;654:1047c–1050c. [Google Scholar]
- HISHIKAWA Y, KAGAWA K, MURAKAMI M, SAKAI H, AKAGI T, ABE M. Usefulness of positron-emission tomographic images after proton therapy. Int. J. Radiation Oncology Biol. Phys. 2002;53:1388–1391. doi: 10.1016/s0360-3016(02)02887-0. [DOI] [PubMed] [Google Scholar]
- HUDSON HM, LARKIN RS. Accelerated image reconstruction using ordered subsets of projection data. IEEE Trans Med Imag. 1994;13:601–609. doi: 10.1109/42.363108. [DOI] [PubMed] [Google Scholar]
- ISEKI Y, MIZUNO H, FUTAMI Y, TOMITANI T, KANAI T, KANAZAWA M, KITAGAWA A, MURAKAMI T, NISHIO T, SUDA M, URAKABE E, YUNOKI A, SAKAI H. Positron camera for range verification of heavy-ion radiotherapy. Nucl Instrum Meth A. 2003;515:840–849. [Google Scholar]
- JAKOBY BW, BERCIER Y, CONTI M, CASEY M, GREMILLION T, HAYDEN C, BENDRIEM B, TOWNSEND DW. Performance Investigation of a Time-of-Flight PET/CT Scanner; 2008 IEEE Nuclear Science Symposium and Medical Imaging Conference; Dresden, Germany. 2008. [Google Scholar]
- KEMP B, WILLIAMS JJ, RUTER R, LOWE V, MULLAN B. Performance measurements of a whole-body PET/CT system with time-of-fight capability; Annual Meeting of the Society of Nuclear Medicine; Toronto, Canada. 2009. [Google Scholar]
- LITZENBERG DW, ROBERTS DA, LEE MY, PHAM K, MOLEN AMV, RONNINGEN R, BECCHETTI FD. On-line monitoring of radiotherapy beams: Experimental results with proton beams. Med Phys. 1999;26:992–1006. doi: 10.1118/1.598491. [DOI] [PubMed] [Google Scholar]
- MACDONALD B, PEREZ-MENDEZ V, TAM KC. Contribution of time-of-flight information to limited angle positron tomography. IEEE Trans Nucl Sci. 1982;NS-29:516–519. [Google Scholar]
- MUSTAFA AA, JACKSON DF. The relation between X-ray CT numbers and charged particle stopping powers and its significance for radiotherapy treatment planning. Phys. Med. Biol. 1983;28:169–176. doi: 10.1088/0031-9155/28/2/006. [DOI] [PubMed] [Google Scholar]
- NISHIO T, MIYATAKE A, OGINO T, NAKAGAWA K, SAIJO N, ESUMI H. The Development and Clinical Use of a Beam ON-LINE PET System Mounted on a Rotating Gantry Port in Proton Therapy. Int J Radiat Oncol Biol Phys. 2010;76:277–286. doi: 10.1016/j.ijrobp.2009.05.065. [DOI] [PubMed] [Google Scholar]
- NISHIO T, OGINO T, NOMURA K, UCHIDA H. Dose-volume delivery guided proton therapy using beam on-line PET system. Med Phys. 2006;33:4190–4197. doi: 10.1118/1.2361079. [DOI] [PubMed] [Google Scholar]
- OELFKE U, LAM GKY, ATKINS MS. Proton dose monitoring with PET: quantitative studies in Lucite. Phys Med Biol. 1996:177. doi: 10.1088/0031-9155/41/1/013. [DOI] [PubMed] [Google Scholar]
- PARODI K, BORTFELD T, HABERER T. Comparison Between In-Beam and Offline Positron Emission Tomography Imaging of Proton and Carbon Ion Therapeutic Irradiation at Synchrotron- and Cyclotron-Based Facilities. Int. J. Radiation Oncology Biol. Phys. 2008;71:945–956. doi: 10.1016/j.ijrobp.2008.02.033. [DOI] [PubMed] [Google Scholar]
- PARODI K, PAGANETTI H, SHIH HA, MICHAUD S, LOEFFLER JS, DELANEY TF, LIEBSCH NJ, MUNZENRIDER JE, FISCHMAN AJ, KNOPF A, BORTFELD T. Patient Study of In Vivo Verification of Beam Delivery and Range, Using Positron Emission Tomography and Computed Tomography Imaging After Proton Therapy. Int. J. Radiation Oncology Biol. Phys. 2007;68:920–934. doi: 10.1016/j.ijrobp.2007.01.063. [DOI] [PMC free article] [PubMed] [Google Scholar]
- PAWELKE J, ENGHARDT W, HABERER T, HASCH BG, HINZ R, KRAMER M, LAUCKNER E, SOBIELLA M. In-beam PET imaging for the control of heavy-ion tumour therapy. IEEE Trans Nucl Sci. 1997;44:1492–1498. [Google Scholar]
- POPESCU LM. Iterative image reconstruction using geometrically ordered subsets with list-mode data. In: SEIBERT JA, editor. 2004 IEEE Nuclear Science Symposium and Medical Imaging Conference; Rome, Italy, IEEE Nuclear & Plasma Sciences Society. 2004. [Google Scholar]
- SURTI S, KARP JS. Design considerations for a limited angle, dedicated breast, TOF PET scanner. Phys Med Biol. 2008;53:2911–2921. doi: 10.1088/0031-9155/53/11/010. [DOI] [PMC free article] [PubMed] [Google Scholar]
- SURTI S, KARP JS, MUEHLLEHNER G. Image quality assessment of LaBr3-based whole-body 3D PET scanners: a Monte Carlo evaluation. Phys. Med. Biol. 2004;49:4593–4610. doi: 10.1088/0031-9155/49/19/010. [DOI] [PubMed] [Google Scholar]
- SURTI S, KUHN A, WERNER ME, PERKINS AE, KOLTHAMMER J, KARP JS. Performance of Philips Gemini TF PET/CT scanner with special consideration for its time-of-flight imaging capabilities. J Nucl Med. 2007;48:471–480. [PubMed] [Google Scholar]
- TOWNSEND D, SCHORR B, JEAVONS A. 3-Dimensional Image-Reconstruction for a Positron Camera with Limited Angular Acceptance. IEEE Trans. Nucl. Sci. 1980;27:463–470. [Google Scholar]
- VANDENBERGHE S, LEMAHIEU I. System characteristics of simulated limited angle TOF PET. Nucl. Instr. Meth. (A) 2007;571:480–483. [Google Scholar]
- WATSON CC. Extension of Single Scatter Simulation to Scatter Correction of Time-of-Flight PET. IEEE Trans Nucl Sci. 2007;54:1679–1686. [Google Scholar]
- WERNER ME, SURTI S, KARP JS. Implementation and Evaluation of a 3D PET Single Scatter Simulation with TOF Modeling; 2006 IEEE Nuclear Science Symposium and Medical Imaging Conference; San Diego, CA. 2006. [Google Scholar]
- YAMAYA T, INANIWA T, MINOHARA S, YOSHIDA E, INADAMA N, NISHIKIDO F, K. S, LAM CF, MURAYAMA H. A proposal of an open PET geometry. Phys. Med. Biol. 2008;53:757–773. doi: 10.1088/0031-9155/53/3/015. [DOI] [PubMed] [Google Scholar]


