

Abstract
In this paper we evaluate tissue elasticity as a longstanding but qualitative biomarker for prostate cancer and sonoelastography as an emerging imaging tool for providing qualitative and quantitative measurements of prostate tissue stiffness. A Kelvin-Voigt Fractional Derivative (KVFD) viscoelastic model was used to characterize mechanical stress relaxation data measured from human prostate tissue samples. Mechanical testing results revealed that the viscosity parameter for cancerous prostate tissue is greater than that derived from normal tissue by a factor of approximately 2.4. It was also determined that a significant difference exists between normal and cancerous prostate tissue stiffness (p < 0.01) yielding an average elastic contrast that increases from 2.1 at 0.1 Hz to 2.5 at 150 Hz. Qualitative sonoelastographic results show promise for cancer detection in prostate and may prove to be an effective adjunct imaging technique for biopsy guidance. Elasticity images obtained with quantitative sonoelastography agree with mechanical testing and histological results. Overall, results indicate tissue elasticity is a promising biomarker for prostate cancer.
Keywords: Cancer biomarkers, elasticity imaging, sonoelastography, ultrasound, viscoelasticity
1. Introduction
Early and accurate detection of prostate cancer is an urgent priority because it is the most prevalent type of cancer in men and the second most frequent cause of cancer deaths in adult males. In the United States, the number of new cases of prostate cancer in 2007 is expected to be 218,890 and deaths are estimated to exceed 27,000 [1]. The motivation for early prostate cancer detection is not only to reduce the mortality from this disease, but also to prevent side effects from local symptoms such as bleeding and urinary tract obstruction [2] and development of painful metastases [3].
Most prostate cancers develop in the posterolateral area of the gland and may grow to considerable size before involving any structure, e.g. urethra, severely complicating diagnosis due to lack of presenting symptoms. Notwithstanding, clinical diagnosis is usually based on a digital rectal examination (DRE) and detection of a palpably stiff mass, sometimes accompanied by elevated prostate specific antigen (PSA) blood levels. In the more advanced stages, prostate tumors spread locally to involve bladder, urethra, seminal vesicles, and pelvis with secondary lesions (metastasis) common to lymph nodes and bone [4].
Prostate tumor growth and the subsequent progression into surrounding (healthy) tissue may be regarded as a disruption of normal tissue homeostasis. Analogous to the cellular processes that accompany wound repair, it is generally believed that normal tissue stroma responds in an effort to repair damage due to carcinoma cell invasion [5,6]. For example, with breast cancer these changes are referred to as the desmoplastic or stromal reaction and are characterized by excessive collagen deposition, which furnishes the stiffness associated with these lesions [4]. Likewise in the prostate, it has been concluded that the stromal reaction to invading cancers is also characterized by elevated collagen deposition [7]. Furthermore, research suggests that increasing tumor aggressiveness (or grade) is coupled with increased amounts of collagen accumulation in the local histologically benign tissue [8,9]. Since increasing collagen deposition leads to an increase in the apparent tumor induration, quantitative stiffness estimates may prove to be an effective biomarker for assessing prostate tumor grade and identification of more aggressive cancers. As first reported by Krouskop et al. [10] using excised human prostates, histologically confirmed cancerous tissues were shown experimentally to be significantly stiffer than normal prostate tissues (p < 0.01). Furthermore, it was concluded that no significant difference in tissue stiffness existed between normal prostate samples taken from the anterior and posterior portions of the gland.
Imaging the elastic properties of biological tissues has become the focal point of many research efforts [11–13]. The fundamental aim of these initiatives revolves around mapping some tissue mechanical property in an anatomically meaningful manner to provide useful clinical information. Since changes in tissue stiffness may be indicative of an abnormal pathological process, imaging parameters related to tissue elasticity may provide an effective biomarker for differentiating normal from cancerous tissues. In fact, several preliminary studies involving elasticity imaging of pathological tissues have supported this hypothesis, such as those dedicated to the detection of prostate [14–20] and breast [21–27] cancers using ultrasound-based approaches.
Sonoelastography is a tissue elasticity imaging technique that estimates the amplitude response of tissues under harmonic mechanical excitation using ultrasonic Doppler techniques [28]. Due to a relationship between particle vibrational response and received Doppler spectral variance [29], the amplitude of low frequency shear waves propagating in tissue can be visualized in real-time using sonoelastography to detect regions of abnormal stiffness [30]. In a more recent sonoelastographic development, it was shown that interfering shear waves could produce slowly propagating interference patterns with an apparent velocity much less than (but proportional to) the underlying true shear velocity [31]. Termed crawling waves, they are generated using a pair of mechanical sources vibrating at slightly offset frequencies. More importantly, these shear wave (interference) patterns can be visualized in real-time using sonoelastographic imaging techniques. In general, crawling wave images describe shear wave propagation patterns and allow for estimation of the spatial elastic properties in tissue, namely, shear velocity or modulus distributions [32–34].
In this paper, we present an overview of research projects currently being investigated by our group, which focus on detecting and characterizing cancer of the prostate based on tissue elasticity information. Section 2 introduces data supporting the use of tissue elasticity as a biomarker for cancer detection in prostate. Subsequently, Sections 3 and 4 explore the utilization of sonoelastography as an imaging tool for prostate cancer detection. Conclusions for this paper are detailed in Section 5.
2. Viscoelastic properties of human prostate
Most biological tissues possess viscoelastic features. However, quantitative information on the viscoelastic properties of the prostate is very limited. Data that can be found in the literature demonstrates cancerous tissue is discernibly stiffer than both benign and normal prostate tissues [10,35], which helps support tissue stiffness as a biomarker for cancer detection. This conclusion is not surprising since palpation has been an effective technique for the detection of superficial inundated prostate tissues for centuries. Nevertheless, quantitative measurements cited in the above literature span a large range, which may be attributed to the testing methodology and tissue models used to derive the information. In addition to the above, data implicating the role of tissue viscosity in normal and diseased prostate tissue is still incomplete and the diagnostic utility of viscosity information is still under investigation. In this section, we aim to increase knowledge regarding the viscoelastic properties of prostate tissue by characterizing and comparing experimental measurements from normal and cancerous human prostate tissues.
2.1. Kelvin-Voigt fractional derivative modeling
The Kelvin-Voigt fractional derivative (KVFD) model is a useful viscoelastic constitutive model for characterizing soft tissue. In general, the KVFD model does not restrict classifying tissues as a pure viscous or elastic solid, rather can allow an intermediate combination potentially more applicable to describing their biomechanical properties. Consequently, it has been shown that the KVFD model is an effective numerical technique for predicting the viscoelastic response of soft tissues [36,37].
The KVFD model is a generalization of the Kelvin-Voigt model and allows tissue stress to equal the fractional derivative of the strain. The model is composed of three parameters: E0, η, and α, where E0 refers to the relaxed elastic constant, η is a viscosity parameter and α is the order of the fractional derivative. From its constitutive relation, a stress relaxation response for a KVFD material can be derived. Stress relaxation describes how a material relieves stress under constant strain and in the case of a viscoelastic material (such as soft tissue), the stress decreases with time. Fitting data to this viscoelastic response, the three parameters of the KVFD model (E0, η and α) can be estimated. The magnitude of the frequency-domain response of the complex-valued Young’s modulus of soft tissue can be expressed as [38]:
| (1) |
which characterizes the elasticity response of the material as a function of frequency f. As Eqn. 1 indicates, the complex-valued Young’s modulus consists of a real part (elasticity) and imaginary part (viscosity), and although the magnitude of this expression may have no physical meaning, it may have value as a tissue characterization and/or mathematical modeling tool.
2.2. Materials and methods
Human prostate glands (N = 8) were obtained immediately following radical prostatectomy. Glands were sectioned and cylindrical cores (approximately 9 mm in diameter and 7 mm in length) were acquired from the posterior zone of the mid-gland using a custom-made coring tool (N = 17). Cores were immersed in saline solutions to avoid dehydration effects. Regarding the patient population, the mean age was 63 (range: 55 to 76) and the mean PSA level was 6.1 μg/ml (range: 3.6 to 9). The prostate specimens had a Gleason score of 3+4 or greater according to pathology reports. Note that use of human prostate glands was approved by the institutional review board of the University of Rochester Medical Center and were compliant with the Health Insurance Portability and Accountability Act. Informed consent was obtained from all patients for use of excised prostate glands. In all cases, it was verified that the patient was not treated with radiation or hormonal therapies, which can alter the gland stiffness and the amount of residual tumor.
A mechanical testing device (MTS Systems Co., Eden Prairie, MN, USA) equipped with a 5 N load cell was used to test the core samples. Uniaxial unconfined compression tests were conducted to measure stress relaxation data from core samples at room temperature. Specifically, tissue samples were precompressed (5% strain) then decaying stress levels were recorded for 700 seconds. Multiple measurements were performed on each sample with 15 minute intervals in between. The stress relaxation curves of each sample were fit to the KVFD model using the nonlinear least squares algorithm from the MATLAB Curve Fitting Toolbox (Mathworks, Inc., Natick, MA, USA). The three model parameters were obtained for each curve and averaged. Finally, the magnitude of the frequency-dependent complex Young’s modulus was computed using Eqn. 1.
Routine histology with hematoxylin (Richard-Allan Scientific, Kalamazoo, MI, USA) and eosin (Richard-Allan Scientific, Kalamazoo, MI, USA) staining was performed on core samples by histopathology technicians. At least two histological slices were obtained from each sample. The slices were examined by a pathologist who reported the cancer percentage. Prostate specimens containing more than 50% cancer were considered cancerous tissue. The range of cancer in these specimens was from 60% to 100% with an average of 83%. The normal specimens were cancer free and did not have obvious benign prostatic hyperplasia (BPH), inflammation or calcifications. Statistical analysis of select experimental data was performed using the software package Stata 8.0 (Stata Corp., College Station, TX, USA) and a p-value less than 0.05 was considered statistically significant.
2.3. Mechanical testing results
Prostate tissue samples were well characterized by the KVFD model (r2 > 0.97). Representative stress relaxation and frequency-dependent complex Young’s moduli curves for normal and cancerous core samples (obtained from the same prostate gland) are illustrated in Fig. 1. The average Young’s moduli for normal and cancerous prostate tissues are plotted in Fig. 2 for a frequency range of 0.1 to 400 Hz where error bars represent the standard deviation of the experimental data. Note that the variation of multiple measurements from same samples was less than 10% denoting reproducibility in experimental testing. The results of Fig. 2 indicate that prostate tissue has a frequency-dependent modulus that markedly increases with frequency. The average magnitudes of the complex Young’s moduli for normal and cancerous tissues at 0.1 Hz is 3.8 ± 1.8 kPa and 7.8 ± 3.3 kPa, respectively, yielding an average elastic contrast of 2.1. Similarly, at a frequency of 150 Hz, average Young’s moduli were found to be 16.0 ± 5.7 kPa and 40.6 ± 15.9 kPa, for normal and cancerous tissues, respectively, resulting in an average elastic contrast of 2.5. These results show that the elastic contrast between cancerous and normal prostate tissues increases as a function of frequency.
Fig. 1.

(a) Stress relaxation curves from normal (black) and cancerous (gray) tissue specimens obtained from the same prostate. The KVFD fit is shown (line) for the cancerous specimen. (b) The complex Young’s moduli of the two types of prostate tissue are plotted as a function of frequency revealing a relationship between tissue stiffness and cancer percentage.
Fig. 2.
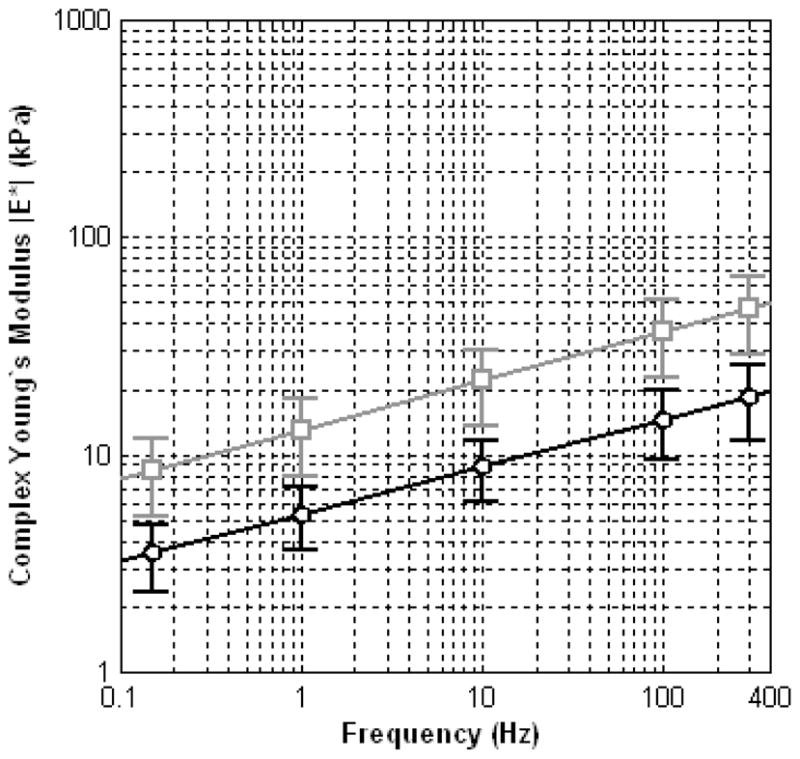
Frequency-dependent average magnitude plots for complex Young’s moduli corresponding to normal (black circles) and cancerous (gray squares) prostate tissue.
For both normal (N = 8) and cancerous (N = 9) prostate tissue specimens, there is discernible variability with respect to biomechanical property measurements. However, results demonstrate that cancerous masses are significantly stiffer than surrounding healthy tissues (p < 0.01). A summary of KVFD model parameters for the normal and cancerous samples can be found in Table 1. For all core samples studied, curve fitting results assigned a low value (approaching zero) to E0. Therefore, this parameter does not contribute significantly to the overall elasticity of the prostate tissue and is not included in Table 1. This finding suggests that prostate tissue is a viscoelastic material without a rigid supporting structure.
Table 1.
Summary of KVFD model parameters derived from mechanical stress relaxation measurements on normal and cancerous prostate tissue samples. Estimates of the average Young’s moduli at 0.1 and 150 Hz are also listed.
| Prostate tissue | No. of samples (N) | η (kPa sα) | α | |E*| (kPa) @ 0.1 Hz | |E*| (kPa) @ 150 Hz |
|---|---|---|---|---|---|
| Normal | 8 | 3.6 ± 1.3 | 0.22 ± 0.04 | 3.8 ± 1.8 | 16.0 ± 5.7 |
| Cancerous | 9 | 8.7 ± 3.4 | 0.23 ± 0.03 | 7.8 ± 3.3 | 40.6 ± 15.9 |
2.4. Discussion
Experimental results demonstrate that mechanical stress relaxation from normal and cancerous prostate tissue exhibit KVFD behavior. Therefore, the viscoelastic properties of prostate tissue can be characterized by the three parameter KVFD model. Inspection of Table 1 reveals that the viscosity parameter for cancerous prostate tissue is greater than that derived from normal tissue by a factor of approximately 2.4. It was also determined that a significant difference exists between normal and cancerous prostate tissue stiffness (p < 0.01) yielding an average elastic contrast that increases from 2.1 at 0.1 Hz to 2.5 at 150 Hz. These results suggest that it is feasible to use tissue viscoelasticity as a biomarker for prostate cancer detection. Moreover, elasticity imaging techniques can also provide information about the localization and size of the tumor, in contrast with PSA levels that describe the entire gland.
3. Qualitative assessment of the elastic properties of prostate tissue
The previous section provided data supporting the use of tissue viscoelasticity as a biomarker for prostate cancer detection. In this section, sonoelastographic imaging is evaluated as a diagnostic technique for prostate cancer detection and visualization. In sonoelastography, vibration fields are imaged in real-time using a modified ultrasound scanner. With this modality, vibrational amplitude is a surrogate for tissue stiffness whereby regions of higher displacement amplitudes denote soft tissues and those of lower amplitudes represent stiffer tissues. In theory, stiff cancerous masses vibrate less compared to the surrounding healthy tissue [28] and appear as dark deficits in sonoelastographic images (termed sonoelastograms).
3.1. Elasticity Imaging of Human Prostate
In the following sections we present preliminary results from ex vivo and in vivo human prostate studies currently ongoing at the University of Rochester. All studies were approved by the institutional review board of the University of Rochester Medical Center and were compliant with the Health Insurance Portability and Accountability Act. Informed consent was obtained from all patients. As noted above, all patients were screened to ensure they had not been treated with radiation or hormonal therapies, which can alter prostate gland stiffness.
For all experiments detailed in the following sections, ultrasound (US) images were acquired using a Logiq 9 US scanner (General Electric Medical Systems, Milwaukee, WI, USA) that has been modified for sonoelastographic imaging. Specifically, harmonic tissue motion, for a given sample volume, was estimated using a spectral variance algorithm applied to a series of backscattered Doppler US pulses [39]. The M12L linear array probe (General Electric Medical Systems, Milwaukee, WI, USA) was used for all ex vivo prostate imaging experiments whereas the i739L transrectal US (TRUS) probe (General Electric Medical Systems, Milwaukee, WI, USA) was used for the in vivo study.
3.2. Ex vivo prostate study
3.2.1. Material and methods
The experimental setup for this study (see Fig. 3 left) follows closely that presented in [19]. Human prostate glands (N = 10) were received after radical prostatectomy and embedded in a 10.5% gelatin (300 Bloom Pork Gelatin, Gelatin Innovations Inc., Schiller Park, IL, USA) cylindrical-shaped mold. Vibration fields were propagated within the embedded prostate gland by centering the gelatin mold on two metal strip rods (90 mm length, 6 mm width, and 7 mm height) connected to an external piston (Vibration Test Systems, Aurora, OH, USA). A harmonic waveform generator (Model 3511A Pragmatic Instruments, San Diego, CA, USA) produced excitation signals that were amplified (Model 2706, Brüel & Kjaer, Naerum, Denmark) and input to the piston actuator. Subsequently, prostate specimens were vibrated at a combination of low frequencies (105, 140, 175, and 210 Hz) to minimize imaging artifacts resulting from reflections from mold boundaries [38]. Co-registered sonoelastographic and B-mode US images were obtained at 1 mm spacing in the longitudinal direction (i.e., prostate apex to base) by mounting the ultrasound transducer on a motorized track (Velmex, Bloomfield, NY, USA). The image plane was normal to the long axis of the metal strips.
Fig. 3.

Experimental setup for qualitative (left) and quantitative (right) sonoelastographic imaging experiments. Both illustrations depict the position of the (a) US transducer and the (b) Material under investigation. For the qualitative sonoelastographic experimental setup, the (c) double bar material contact and (d) mechanical source are shown. Conversely, for the qualitative sonoelastographic setup the (e) bending piezoelectric actuators are represented.
After US imaging, specimens were weighed and measured to determine the maximum dimension in all three planes from apex to base, transversely, and anteroposteriorly. The resection margins of the gland were inked with different colors that represented each quadrant. A landmark device, which consisted of two sets of four (3 mm diameter) mating metal prongs, was inserted into the specimen through the apex and base to provide fiducial markers. After fixation, the gland was remeasured to assess shrinkage, sliced into 4 mm thick sections from the apex to the base, and digitally photographed. Subsequently, the tissues were transferred to cassettes and embedded in paraffin (Paraplast, Sherwood Medical, St. Louis, MO, USA). The tissue was sliced further into 5 μm thick sections and placed on glass slides. The microscopic whole-mount sections were then examined by a pathologist to specify cancerous areas. Finally, a histological volume was created by aligning the digital photographs of each histological slide using the holes from the landmark device as reference.
Prostate gland boundaries were outlined in each of the 1 mm spaced B-mode US scans, following the algorithm described in [40], and used to create a 3D surface of the gland. Deficits in the sonoelastographic images were also segmented using a 3D semi-automated algorithm [41]. The information from the already co-registered imaging modalities was fused, creating a 3D volume depicting sonoelastographic deficits found in the prostate gland. Registration of the US and pathology volumes was achieved by using the surface of the gland as a marker following the methodology presented in [42]. Performance of prostate cancer detection using sonoelastography was assessed by comparing 3D imaging-based findings in size and position to 3D histology. To declare a match between a sonoelastographic lesion and the pathology confirmed cancer the relative diameter in sonoelastographic images with respect to histological images had to be between 50% and 150%, and lesion centers had to be less than 8 mm apart. These criteria were chosen to compensate for misregistration problems and for the coarse sampling in the histological volume.
3.2.2. Ex vivo prostate sonoelastographic results
Sonoelastography found 16 deficits in the ten glands that were examined. Eleven of the deficits corresponded to cancerous masses, three to BPH nodules, two were false positives and two tumors were missed entirely (false negatives). Prostate cancer sizes (N = 11) measured from sonoelastographic and histological images are summarized in Table 2. Average tumor diameters were 7.5 ± 2.7 mm and 8.3 ± 3.5 mm as measured from sonoelastographic and histological images, respectively. Analysis of sonoelastographic and histological lesion sizes revealed no statistically significant differences (p = 0.38). The undetected tumors (N = 2) had an average diameter of 4.7 ± 0.9 mm.
Table 2.
Summary of prostate cancer measurements (N = 11) from histological and sonoelastographic images.
| Average lesion diameter (mm) | ||
|---|---|---|
| Lesion No. | Histology | Sonoelastography |
| 1 | 8.74 | 9.70 |
| 2 | 14.80 | 7.80 |
| 3 | 6.12 | 4.93 |
| 4 | 4.00 | 4.17 |
| 5 | 5.86 | 6.21 |
| 6 | 6.37 | 4.53 |
| 7 | 3.81 | 5.53 |
| 8 | 8.74 | 11.31 |
| 9 | 9.92 | 11.66 |
| 10 | 12.20 | 9.18 |
| 11 | 10.90 | 7.81 |
|
| ||
| Average | 8.31 | 7.53 |
Figure 4 depicts a representative ex vivo prostate case comparing findings from imaging and histology. Inspection of Fig. 4 reveals that the sonoelastogram deficit in the left posterior part of the gland corresponds to a cancerous mass as verified by the histological image. Note the same tumor is not visible in the corresponding US B-mode image. Corresponding volume reconstructions from this prostate case are shown in Fig. 5. For this example, the average tumor diameter was 11.3 mm and 8.7 mm from sonoelastography and histology and, respectively.
Fig. 4.
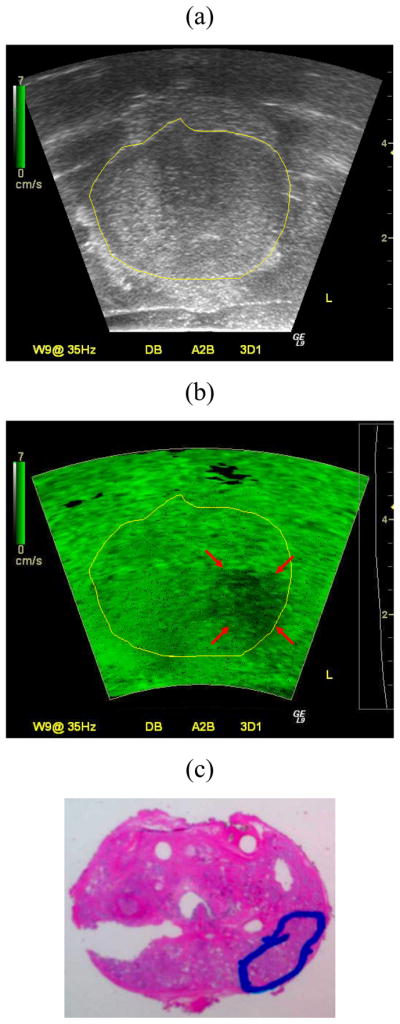
Matched (a) B-mode ultrasound, (b) Sonoelastographic, and (c) Histological images. A deficit in the sonoelastogram (red arrows) was verified as a cancerous mass by histology (blue outline). Note that sonoelastographic regions where the vibration amplitude is low are shown as dark green, while regions with high vibration are depicted as bright green.
Fig. 5.
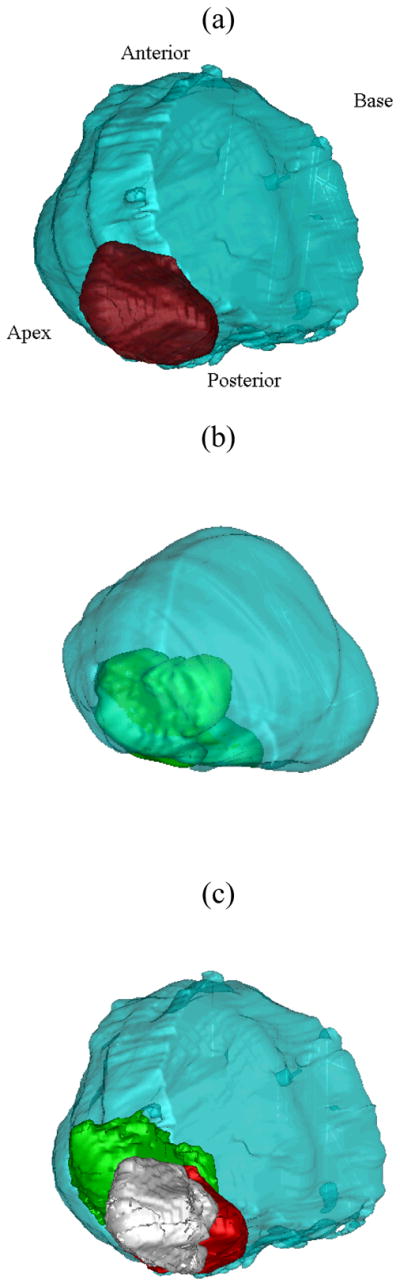
Three-dimensional reconstruction of a prostate gland from (a) Histological and (b) US and sonoelastographic images. For both results, the surface of the gland is shown in blue with histological and sonoelastographic tumors depicted as red and green, respectively. The registered 3D image detailing sonoelastographic (green) and histological (red) findings is shown in (c). The intersection of both is presented in white.
3.3. In vivo prostate example
3.3.1. Material and methods
For this in vivo example, a TRUS examination was conducted on the patient one day prior to their scheduled radical prostatectomy. A specially designed board equipped with two mechanical actuators (Buttkicker Concert, The Guitammer Company Inc., Westerville, Ohio, USA) was positioned over the hospital bed and comfortably under the patient’s pelvis. To induce prostate tissue vibration, a low frequency (70 Hz) excitation signal was input into a pair of amplifiers (Buttkicker Power Amplifier, The Guitammer Company Inc., Westerville, Ohio, USA) that were connected to the mechanical actuators. Source amplitudes were adjusted to produce uniform vibration fields within the prostate gland. A magnetic tracking device (MiniBird, Ascension Technologies, Burlington, VA) was mounted on the TRUS probe. This device tracked transducer orientation during patient scans and enabled reconstruction of 3D US B-mode and sonoelastographic volumes of the prostate gland [42]. After patient surgery, a histological volume was reconstructed following the protocol described in Section 3.1.
3.3.2. In vivo prostate sonoelastographic result
Representative US B-mode and sonoelastographic images from an in vivo prostate scan are shown in Fig. 6. Inspection of the sonoelastogram indicates a stiff mass in the anterior zone of the gland, which corresponds to a hypoechoic region in the B-mode image. The corresponding 3D reconstructions for this prostate case along with histology results are depicted in Fig. 7. Overall, sonoelastographic imaging detected two tumors with diameters of 6.9 mm and 10.2 mm. The histological image verifies the presence of three tumors, whereby the two detected by sonoelastography had diameters of 4.4 mm and 9.7 mm, respectively. The undetected tumor (anterior right) had a diameter of 6 mm.
Fig. 6.

Matched (a) B-mode US and (b) Sonoelastographic images from an in vivo prostate study. The sonoelastographic image reveals a stiff (cancerous) mass (denoted by arrows) in the middle of the image.
Fig. 7.

Results from an in vivo study illustrating (a) 3D reconstruction from the prostate scan and (b) Histological image taken from the midgland region. Sonoelastography depicts two stiff cancerous masses (green) that are corroborated by histology (blue outline). Note a small tumor was missed by sonoelastography in the anterior right part of the gland.
3.4. Discussion
The capability of sonoelastography to find cancer depends on the size and elastic contrast of the tumor in comparison with the normal surrounding tissue [30]. In our experiments, the average diameter was less than 10 mm and the expected elastic contrast was less than 3 (from Section 2). The small size and low contrast represent adverse conditions for the imaging system. Moreover, the presence of benign conditions that are stiffer than normal tissue, e.g. glandular BPH and calcifications [43,44], increases the number of detected false positives, although BPH and calcifications may be visualized on B-scan and, therefore, excluded.
Imaging artifacts, called modal patterns, may be another source of false positives in ex vivo tissue characterization experiments. These artifacts appear due to the destructive interference between the shear wave sources and the reflection from boundaries of the gelatin mold. Although chords (multiple-frequency signals) were used to minimize this effect, they are not sufficient to eradicate them. The experimental setup needs to be adjusted so that either modal patterns are further reduced or that their presence can be determined. Our initial experience from in vivo prostate experiments indicates that results are less affected by these artifacts because of the heterogeneous nature of tissue and the lack of strong boundary reflections. The main challenge to obtaining high-quality in vivo results appears to be coupling of externally induced mechanical vibrations to the prostate tissue. Since lesion detection (and contrast) improves with increasing tissue vibration frequency, minimizing coupling losses will be of paramount importance at higher vibration frequencies (e.g., 100 to 200 Hz) since attenuation effects are more pronounced.
Overall, qualitative sonoelastographic imaging found 11 out of 13 cancers in the prostate specimens evaluated. These results suggest that sonoelastography has the potential as a guided biopsy tool, albeit based on limited data. Previous studies found similar improvements from sonoelastography over conventional B-mode US imaging [18,19].
4. Quantitative assessment of elasticity in prostate
In the previous section, sonoelastography was presented as a qualitative imaging method to assess the relative stiffness of prostate tissue. Although many cancerous masses of varying size were detected due to elevated Young’s moduli values, other benign conditions of the prostate can similarly manifest as being stiffer than the surrounding tissues. Consequently, these conditions may influence false positive detection rates suggesting that a quantitative imaging modality is needed to further investigate the viscoelastic properties of normal and cancerous prostate tissues, as well as any other condition that could alter viscoelastic properties.
In this section, crawling wave sonoelastography is described. This sonoelastographic imaging technique estimates the frequency-dependent shear wave speed in tissue, which can be used to calculate Young’s modulus information. Comparisons between crawling wave sonoelastographic results and mechanical measurements are provided. Finally, preliminary results using crawling wave sonoelastography as a quantitative tissue characterization technique in prostate are introduced.
4.1. Principles of crawling wave sonoelastography
It has been shown that shear wave interference patterns can be produced using two opposing mechanical sources and, subsequently, visualized in real-time using sonoelastographic imaging techniques [31]. More importantly, when sources are excited at slightly offset frequencies, interference patterns slowly propagate through tissue at an apparent velocity proportional to the frequency difference. Termed crawling waves, local analysis of image spatial properties allows quantitative estimation of the underlying tissue properties, namely, shear wave speed distributions. Under certain assumptions, the distance between interference pattern fringes is one-half the shear wave wavelength [32]. Hence, the Young’s modulus can be estimated as follows:
| (2) |
where ρ is the mass density of tissue (assumed constant at 1000 kg/m3), c denotes shear wave speed, f is the user controlled shear wave frequency, and λ is twice distance measured from the interference patterns. It is important to note that tissue modulus estimation using Eqn. 2 may provide frequency-dependent values indicative of viscoelasticity. However, if modulus information is estimated using Eqn. 2 for a range of vibration frequencies, then the KVFD model described by Eqn. 1 can be fit to the dispersive data to estimate the viscoelastic parameters.
4.2. Materials and methods
Two experiments were performed in this study using different excised prostate glands. In the first experiment, the aim was to compare quantitative crawling wave sonoelastographic results to that obtained from mechanical testing and utilization of the KVFD model. A human prostate gland obtained immediately following radical prostatectomy was placed in between two bending actuators (Bimorphs, Piezo Systems, Cambridge, MA, USA) leaving a cross-section of the prostate to be analyzed in the midgland. Image data was acquired for sonoelastographic crawling waves propagated using a vibration frequency range of 100 to 300 Hz (0.25 frequency offset). Following the protocol described in Section 2, prostate core samples were extracted and corresponding viscoelastic properties were obtained by fitting a KVFD model to stress relaxation-based mechanical testing data. Following selection of a region-of-interest in the crawling wave sonoelastogram corresponding to the site of prostate core extraction, spatial properties from this area were analyzed to determine the local average shear wave speed as a function of vibration frequency.
For the second experiment, a prostate gland was embedded in a gelatin-based mold (see Section 3). Following the setup illustrated in Fig. 3 (right), two mechanical sources were positioned on opposing sides of the prostate mold and crawling wave propagation was induced using source vibration frequencies of 120 Hz and 120.25 Hz. Subsequently, crawling wave sonoelastograms were processed using a shear wave speed estimator [34] and converted into images describing the Young’s modulus distribution using Eqn. 2.
4.3. Crawling wave sonoelastographic results
A summary of elasticity estimates from crawling wave sonoelastography and mechanical testing data utilizing the KVFD model are plotted in Fig. 8. The model fit parameters for the curve depicted in Fig. 8a were 3.5 ± 0.002 kPa sα and 0.22 ± 0.04 for the viscosity parameter and fractional derivative order, respectively. Similarly, the KVFD fit parameters for the curve depicted in Fig. 8b were 5.1 ± 1.6 kPa sα and 0.24 ± 0.05. From the two prostate cases investigated, it can be seen that quantitative sonoelastographic results are within the standard deviation range of mechanical testing measurements. Regarding Fig. 8a, a difference of less than 12% was observed between averaged quantitative (crawling wave) sonoelastographic results and mechanical testing, whereas in Fig. 8b a discrepancy of less than 0.5% was revealed (except at 100 Hz where the difference is approximately 5%).
Fig. 8.

Summary of quantitative elasticity measurements from crawling wave sonoelastographic images (black circles) and mechanical testing using a KVFD model (gray squares). Results are depicted for two different prostate cases and experimental conditions.
Quantitative sonoelastographic imaging results are depicted in Fig. 9. From the B-mode US image, the cross-sectional prostate boundary can be extrapolated to the other images shown. Inspection of shear wave interference patterns in Fig. 9b reveals an elongated wavelength in the image center, which corresponds to a focal mass characterized by an elevated Young’s modulus in the quantitative sonoelastogram. This tumor was determined cancerous following pathological assessment of the prostate gland. Analysis of the quantitative sonoelastogram reveals that the elastic contrast between the focal cancer and surrounding normal prostate tissue was approximately 3 (at a vibration frequency of 120 Hz), which is in agreement with results of Section 2.
Fig. 9.

Experimental quantitative sonoelastographic imaging results depicting (a) B-mode US image, (b) Crawling wave sonoelastogram, (c) Quantitative (i.e., Young’s modulus) sonoelastogram (units of kPa), and (d) Histological image.
4.4. Discussion
Crawling wave sonoelastographic measurements were compared to mechanical testing data processed using the KVFD model. An agreement between these two results suggests that they can be reliably used to investigate prostate tissue elasticity. Particularly, as an imaging modality, quantitative sonoelastography has the potential to be utilized as a simple and effective real-time approach for characterizing prostate tissue properties although further investigations are required to extent this technique to in vivo applications.
5. Conclusions
In this paper we evaluated the use of sonoelastographic imaging techniques which display elasticity as a biomarker for prostate cancer. A KVFD viscoelastic model was used to characterize mechanical stress relaxation data measured from human prostate tissue samples. Mechanical testing results revealed that the viscosity parameter for cancerous prostate tissue is greater than that derived from normal tissue by a factor of approximately 2.4. It was also determined that a significant difference exists between normal and cancerous prostate tissue stiffness (p < 0.01) yielding an average elastic contrast that increases from 2.1 at 0.1 Hz to 2.5 at 150 Hz.
Sonoelastography was evaluated as a qualitative tissue elasticity imaging technique. An ex vivo study on excised human prostate glands was performed and 11 out of 13 cancerous lesions were successfully detected revealing the potential of elasticity imaging for prostate cancer detection and guided biopsy. An in vivo sonoelastographic example was presented from an ongoing clinical study, which further demonstrates the ability for in vivo prostate imaging and cancer detection using elasticity-based techniques.
Quantitative sonoelastographic imaging based on the crawling wave phenomena was introduced. The elastic properties of prostate tissue were analyzed using crawling wave sonoelastography and quantitative estimates were in agreement with mechanical testing measurements. Additionally, preliminary sonoelastographic results depicting the Young’s moduli distribution in prostate tissue were compared to histological images. Owing to an agreement in tumor localization and size, it is suggested that quantitative tissue elasticity imaging is promising for prostate cancer detection and characterization.
Overall, it was demonstrated that tissue elasticity is a promising prostate cancer biomarker. Irregardless of the particular elasticity imaging technique utilized, the predominance of a fundamental elastic contrast between normal and cancerous lesions supports the clinical utility of these imaging modalities for cancer detection and targeted biopsy in prostate.
Acknowledgments
This work was supported in part by NIH Grant 5 R01 AG16317-07.
References
- 1.American Cancer Society. Cancer Facts and Figures 2007. American Cancer Society; 2007. [Google Scholar]
- 2.Portnoy RK, Lesage P. Management of cancer pain. Lancet. 1999;353:1695–1700. doi: 10.1016/S0140-6736(99)01310-0. [DOI] [PubMed] [Google Scholar]
- 3.Roodman GD. Mechanisms of bone metastasis. N Engl J Med. 2004;350:1655–1664. doi: 10.1056/NEJMra030831. [DOI] [PubMed] [Google Scholar]
- 4.Anderson WAD, Kissane JM. Pathology. Vol. 2. C.V. Mosby Company; Saint Louis, Missouri: 1977. [Google Scholar]
- 5.Dvorak HF. Wounds that do not heal. N Engl J Med. 1986;315:1650–1659. doi: 10.1056/NEJM198612253152606. [DOI] [PubMed] [Google Scholar]
- 6.Tuxhorn JA, Ayala GE, Rowley DR. Reactive stroma in prostate cancer progression. J Urology. 2001;166:2472–2483. [PubMed] [Google Scholar]
- 7.Tuxhorn JA, Ayala GE, Smith MJ, et al. Reactive stroma in human prostate cancer: Induction of myofibroblast phenotype and extracellular matrix remodeling. Clinical Cancer Research. 2002;2912:2912–2923. [PubMed] [Google Scholar]
- 8.Burns-Cox N, Avery NC, Gingell JC, et al. Changes in collagen metabolism in prostate cancer: A host response that may alter progression. J Urology. 2001;166:1698–1701. doi: 10.1016/s0022-5347(05)65656-x. [DOI] [PubMed] [Google Scholar]
- 9.Zhang Y, Nojima S, Nakayama H, et al. Characteristics of normal stromal components and their correlation with cancer occurrence in human prostate. Oncology Reports. 2003;10:207–211. [PubMed] [Google Scholar]
- 10.Krouskop TA, Wheeler TM, Kallel F, et al. Elastic moduli of breast and prostate tissues under compression. Ultrason Imaging. 1998;20:260–274. doi: 10.1177/016173469802000403. [DOI] [PubMed] [Google Scholar]
- 11.Gao L, Parker KJ, Lerner RM, et al. Imaging of the elastic properties of tissue - A review. Ultrasound Med Biol. 1996;22:959–977. doi: 10.1016/s0301-5629(96)00120-2. [DOI] [PubMed] [Google Scholar]
- 12.Ophir J, Alam SK, Garra B, et al. Elastography: Ultrasonic estimation and imaging of the elastic properties of tissues. Proc Instn Mech Engrs. 1999;213:203–233. doi: 10.1243/0954411991534933. [DOI] [PubMed] [Google Scholar]
- 13.Greenleaf J, Fatemi M, Insana M. Selected methods for imaging elastic properties of biological tissues. Annu Rev Biomed Eng. 2003;5:57–78. doi: 10.1146/annurev.bioeng.5.040202.121623. [DOI] [PubMed] [Google Scholar]
- 14.Lorenz A, Sommerfeld H, Garcia-Schurmann M, et al. A new system for the acquisition of ultrasonic multicompression strain images of the human prostate in vivo. IEEE Trans Ultrason Ferroelec Freq Contr. 1999;46:1147–1153. doi: 10.1109/58.796120. [DOI] [PubMed] [Google Scholar]
- 15.Pesavento A, Lorenz A. Real time strain imaging and in vivo applications in prostate cancer. Proc IEEE Ultrason Symp. 2001;2:1647–1652. [Google Scholar]
- 16.Souchon R, Rouviere O, Gelet A, et al. Visualisation of HIFU lesions using elastography of the human prostate in vivo: preliminary results. Ultrasound Med Biol. 2003;29:1007–1015. 2003. doi: 10.1016/s0301-5629(03)00065-6. [DOI] [PubMed] [Google Scholar]
- 17.Konig K, Scheipers J, Pesavento A, et al. Initial experience with real-time elastography guided biopsies of the prostate. J Urology. 2005;174:115–117. doi: 10.1097/01.ju.0000162043.72294.4a. [DOI] [PubMed] [Google Scholar]
- 18.Rubens DJ, Hadley MA, Alam SK, et al. Sonoelasticity imaging of prostate cancer: In vitro results. Radiology. 1995;195:379–383. doi: 10.1148/radiology.195.2.7724755. [DOI] [PubMed] [Google Scholar]
- 19.Taylor LS, Rubens DJ, Porter BC, et al. Prostate cancer: Sonoelastography for in vitro detection. Radiology. 2005;237:981–985. doi: 10.1148/radiol.2373041573. [DOI] [PubMed] [Google Scholar]
- 20.Pallwein L, Mitterberger M, Gradl J, et al. Value of contrast-enhanced ultrasound and elastography in imaging of prostate cancer. Current Opinion Urology. 2007;17:39–47. doi: 10.1097/MOU.0b013e328011b85c. [DOI] [PubMed] [Google Scholar]
- 21.Garra BS, Céspedes EI, Ophir J, et al. Elastography of breast lesions: Initial clinical results. Radiology. 1997;202:79–86. doi: 10.1148/radiology.202.1.8988195. [DOI] [PubMed] [Google Scholar]
- 22.Hiltawsky KM, Kruper M, Starke C, et al. Freehand ultrasound elastography of breast lesions: Clinical results. Ultrasound Med Biol. 2001;27:1461–1469. doi: 10.1016/s0301-5629(01)00434-3. [DOI] [PubMed] [Google Scholar]
- 23.Bercoff J, Chaffai S, Tanter M, et al. In vivo breast tumor detection using transient elastography. Ultrasound Med Biol. 2003;29:1387–1396. doi: 10.1016/s0301-5629(03)00978-5. [DOI] [PubMed] [Google Scholar]
- 24.Hall TJ, Zhu Y, Spalding CS. In vivo real-time freehand palpation imaging. Ultrasound Med Biol. 2003;29:427–435. doi: 10.1016/s0301-5629(02)00733-0. [DOI] [PubMed] [Google Scholar]
- 25.Yamakawa M, Nitta N, Shina T, et al. High-speed freehand tissue elasticity imaging for breast diagnosis. Jpn J Appl Phys. 2003;42:3265–3270. [Google Scholar]
- 26.Itoh A, Ueno E, Tohno E, et al. Breast disease: Clinical applications of US elastography for diagnosis. Radiology. 2006;239:341–350. doi: 10.1148/radiol.2391041676. [DOI] [PubMed] [Google Scholar]
- 27.Regner DM, Hesley GK, Hangiandreou NJ, et al. Breast lesions: Evaluation with US strain imaging – Clinical experience of multiple observers. Radiology. 2006;238:425–437. doi: 10.1148/radiol.2381041336. [DOI] [PMC free article] [PubMed] [Google Scholar]
- 28.Lerner RM, Parker KJ, Holen J, et al. Sonoelasticity: Medical elasticity images derived from ultrasound signals in mechanically vibrated targets. Acoust Imaging. 1988;16:317–327. [Google Scholar]
- 29.Huang SR, Lerner RM, Parker KJ. On estimating the amplitude of harmonic vibration from the Doppler spectrum of reflected signals. J Acoust Soc Am. 1990;88:310–317. [Google Scholar]
- 30.Parker KJ, Fu D, Gracewski SM, et al. Vibration sonoelastography and the detectability of lesions. Ultrasound Med Biol. 1998;24:1937–1947. doi: 10.1016/s0301-5629(98)00123-9. [DOI] [PubMed] [Google Scholar]
- 31.Wu Z, Taylor LS, Rubens DJ, et al. Sonoelastographic imaging of interference patterns for estimation of the shear velocity of homogeneous biomaterials. Phys Med Biol. 2004;49:911–922. doi: 10.1088/0031-9155/49/6/003. [DOI] [PubMed] [Google Scholar]
- 32.Wu Z, Hoyt K, Rubens DJ, et al. Sonoelastographic imaging of interference patterns for estimation of shear velocity distribution in biomaterials. J Acoust Soc Am. 2006;120:1–11. doi: 10.1121/1.2203594. [DOI] [PubMed] [Google Scholar]
- 33.Hoyt K, Parker KJ, Rubens DJ. Real-time shear velocity imaging using sonoelastographic techniques. Ultrasound Med Biol. 2007;33:1086–1097. doi: 10.1016/j.ultrasmedbio.2007.01.009. [DOI] [PubMed] [Google Scholar]
- 34.Hoyt K, Castaneda B, Parker KJ. Two-dimensional sonoelastographic shear velocity imaging. Ultrasound Med Biol. 2008;34:276–288. doi: 10.1016/j.ultrasmedbio.2007.07.011. [DOI] [PubMed] [Google Scholar]
- 35.Phipps S, Yang TH, Habib FK, et al. Measurement of tissue mechanical characteristics to distinguish between benign and malignant prostatic disease. Urology. 2005;66:447–450. doi: 10.1016/j.urology.2005.03.017. [DOI] [PubMed] [Google Scholar]
- 36.Kiss MZ, Varghese T, Hall TJ. Viscoelastic characterization of in vitro canine tissue. Phys Med Biol. 2004;49:4207–4218. doi: 10.1088/0031-9155/49/18/002. [DOI] [PMC free article] [PubMed] [Google Scholar]
- 37.Szabo TL, Wu J. A model for longitudinal and shear wave propagation in viscoelastic media. J Acoust Soc Am. 2000;107:2437–2446. doi: 10.1121/1.428630. [DOI] [PubMed] [Google Scholar]
- 38.Taylor LS. PhD Dissertation. University of Rochester; 2002. Three-dimensional sonoelastography: Principles and practices with application to tumor visualization and volume estimation. [Google Scholar]
- 39.Taylor LS, Porter BC, Rubens DJ, et al. Three-dimensional sonoelastography: Principles and practices. Phys Med Biol. 2000;45:1477–1494. doi: 10.1088/0031-9155/45/6/306. [DOI] [PubMed] [Google Scholar]
- 40.Ladak HM, Mao F, Wang Y, et al. Prostate Boundary Segmentation from 2D ultrasound images. Med Phys. 2000;27:1777–1788. doi: 10.1118/1.1286722. [DOI] [PubMed] [Google Scholar]
- 41.Castaneda B, Hoyt K, Zhang M, et al. Prostate cancer detection based on three dimensional sonoelastography. Proc IEEE Ultrason Symp. 2007:1353–1356. [Google Scholar]
- 42.Porter BC. PhD Dissertation. University of Rochester; 2004. Three-dimensional medical ultrasound acquisition and data registration and fusion. [Google Scholar]
- 43.Jalkanen V, Andersson BM, Bergh A, et al. Resonance sensor measurements of stiffness variations in prostate tissue in vitro - A weighted tissue proportion model. Physiol Meas. 2006;27:1373–1386. doi: 10.1088/0967-3334/27/12/009. [DOI] [PubMed] [Google Scholar]
- 44.Souchon R. PhD Dissertation. INSERM; 2004. Prostate cancer detection and HIFU therapy monitoring using elastography. [Google Scholar]