

Abstract
We report the appearance of anomalous water diffusion in hydrophilic Sephadex gels observed using pulse field gradient (PFG) nuclear magnetic resonance (NMR). The NMR diffusion data was collected using a Varian 14.1 Tesla imaging system with a home-built RF saddle coil. A fractional order analysis of the data was used to characterize heterogeneity in the gels for the dynamics of water diffusion in this restricted environment. Several recent studies of anomalous diffusion have used the stretched exponential function to model the decay of the NMR signal, i.e., exp[−(bD)α], where D is the apparent diffusion constant, b is determined the experimental conditions (gradient pulse separation, durations and strength), and α is a measure of structural complexity. In this work, we consider a different case where the spatial Laplacian in the Bloch-Torrey equation is generalized to a fractional order model of diffusivity via a complexity parameter, β, a space constant, μ, and a diffusion coefficient, D. This treatment reverts to the classical result for the integer order case. The fractional order decay model was fit to the diffusion-weighted signal attenuation for a range of b-values (0 < b < 4,000 s-mm−2). Throughout this range of b values, the parameters β, μ and D, were found to correlate with the porosity and tortuosity of the gel structure.
Keywords: diffusion, exponential, fractional derivative, fractal, magnetic resonance, Sephadex gel
1. INTRODUCTION
Molecular motion can be probed indirectly by many techniques, but nuclear magnetic resonance (NMR) is one of the few methods that can directly provide quantitative values for the rotational and translational diffusion of water in complex systems [1]. Pulsed field gradient (PFG) NMR measures translational diffusion on the time scale of milliseconds to seconds, while NMR relaxation measurements reflect rotational diffusion (i.e. molecular reorientation) on the much shorter timescale of picoseconds to nanoseconds [2]. While translational motion can be extracted from the rotational diffusion, this relationship requires a number of assumptions and knowledge of solution parameters such as viscosity, and thus is not trivial [3]. PFG NMR measures molecular displacement directly through phase encoding of the diffusing nuclei [4]. However, converting these measurements into a true diffusion coefficient relies on a mathematical model of the influence of any confining structures (boundaries) that may hinder or restrict the diffusion [5]. It is through this model that information may be gleaned about the nature and extent of a heterogeneous environment [6–8].
PFG NMR methods allow for the non-invasive measurement of translational displacement as a function of time [4]. Thus, the displacement of individual water molecules (inferred from the magnetic properties of the hydrogen nuclei) is quantified over a given time period, Δ, known as the observation time [4]. Prior to this period, nuclei are labelled via signal phase-encoding as a function of their initial position, r0; phase encoding is achieved by the application of gradients in the magnetic field (turned on, or pulsed, for a short period of time, δ). At this point, an attempt is made to reverse the signal phase-encoding. Signal originating from nuclei within molecules that have moved during the observation time will exhibit a residual phase offset, φ, proportional to the displacement R = r − r0. Diffusion results in a random distribution of molecular displacements with a corresponding distribution of phase offsets, resulting in a net attenuation of the NMR signal (averaged over all nuclei observed). To first order, the analysis of the measured phase changes is a classic application of a Brownian motion [9].
In observing unrestricted, normal Brownian diffusion via a spin echo experiment, the NMR signal attenuation obeys the Stejskal-Tanner decay equation with an exponential dependence on the pulse sequence parameters and the apparent diffusion coefficient [2]. Briefly, this can be expressed as:
| (1) |
where, S is the signal magnitude in arbitrary units, γ is a constant for each nuclei (42.57 MHz/Tesla for hydrogen), G is the magnitude of the phase-encoding magnetic field gradient (Tesla/m), D is the self-diffusion coefficient (m2s−1) and b is the combination of all these factors, except D. By measuring attenuation as a function of b, the self-diffusion coefficient can be determined. For molecules in an isotropic homogeneous medium, D is independent of the pulse length, δ, the observation time Δ, and the direction of applied gradients.
1.1 Restricted or hindered diffusion D(Δ)
When molecular diffusion is restricted on the timescale of the NMR experiment – as occurs within e.g. emulsion droplets, porous media, or physiological tissues – the interpretation of the diffusion coefficient becomes more complicated [3]. The observation time employed in the PFG experiment determines the length-scale over which the NMR measurement is sensitive. For short observation times, the molecules within a droplet diffuse in an essentially unrestricted fashion; consequently, a PFG experiment would measure only the free-diffusion coefficient of the species. In the long time limit, however, the maximum displacement of the molecules will be restricted by the impermeable interfaces in a heterogeneous solid-liquid material, or for an emulsion, the droplet surface (i.e., the liquid-liquid interface).
For an isotropic, infinitely large and homogeneous medium, the probability distribution of molecular displacements is Gaussian and the second moment of the distribution, or mean squared displacement, scales linearly with time [4]
| (2) |
Here, D is not a function of t and the mean squared displacement increases in linear manner with diffusion time. The simple situation, however, does not occur for diffusion in complex materials with a restricting boundary. In this case, the displacement of a molecule will not generally be independent of starting positions. Hence, the mean squared displacement will be a function of D0 (bulk diffusivity), restricting geometry, and observation time. The diffusion coefficient obtained by fitting NMR data to (1) is thus only an apparent diffusivity. True diffusivity will only be recovered by employing an appropriate description of the structural geometry in the data analysis.
Considering the simple case of a particle diffusing within a reflecting spherical boundary [4], the diffusion coefficient measured by the PFG experiment will depend on the relative magnitudes of the sphere radius and the diffusive length on the NMR timescale, λ= (D0Δ)1/2. For λ ≪ R, the particle does not encounter the reflective boundary and the relatively small mean free path is unperturbed. Thus, translational motion is indistinguishable from free diffusion. As the λ approaches R (λ/R ≈ 1), the particle encounters the boundary and the translational displacement becomes restricted to a maximum corresponding to the sphere size. The probability distribution of molecular displacements, in this case, exhibits non-Gaussian statistics and the mean squared displacement ceases to scale linearly with time, but increases as [2].
| (3) |
where, α (0 < α < 1) is a measure of the complexity of the environment. This kind of behaviour can be viewed as Levy process [10], or as a form of diffusion (non-Gaussian) in which the constant of proportionality D is a function of time [3], such as,
| (4) |
In (4), D(t) = D/t1−α, where it represents a diffusion coefficient that decreases as time increases, and for which the signal decay is a stretched exponential function of the form:
| (5) |
The most common interpretation of this type of diffusion is in the context of the continuous time random walk [11], where time is taken to be a randomly distributed continuous variable. Anomalous behaviour arises then from either a power law distribution of jump lengths or one of time steps. Both are anomalous in that the second moment, or variance of the distribution is characterized by infinite variance. Free diffusion or diffusion in simple geometries (sphere, infinite parallel plates) can be modelled analytically [3]. More complex structures require numerical simulation.
1.2 Commonly employed models for anomalous diffusion
The general approaches to modelling diffusion in complex materials can be classified as either multi-compartment models or phenomenological models [2]. Multi-compartment models treat the attenuated NMR signal as originating from nuclei diffusing in different physical environments (e.g. within a droplet versus within the continuous phase of a classic emulsion or intra- versus extra-cellular water in biological tissues). The net signal is then a sum over a series of mono-exponential decays, each corresponding to one compartment. Values are assigned not only to the diffusivity in each compartment, but also to its relative size. A similar approach is often used to fit multiple compartments to relaxation measurements. It would not be unreasonable to expect spin populations in both the relaxation and diffusion compartment models to be similar, particularly if both measures reflect equally the reflecting and relaxing internal structures. Indeed, it is the lack of agreement between PGSE and relaxation measures of structure – particularly in the brain – that is one motivation for seeking alternative models of translational motion in complex geometries [12].
Phenomenological models strive to fit the experimental data with a parameter that ideally should reflect the underlying microscopic structure [13,14]. Recent examples include: (i) a stretched exponential decay in the form (S = S0 exp[−(bD)α]), where α appears as an index of spatial heterogeneity [14,15]; (ii) models in which the physics of diffusion are assumed to be fractal, resulting in attenuation expressions of the form S = S0 exp[−4π2q2D*Δ2H], where q = γδG/2π and H is the fractal dimension (H > ½ for super diffusion and H < ½ for sub-diffusion) [2,16], and (iii) models derived from fractional calculus [17,18] of the form:
| (6) |
where β takes values between 0 and 1, and, like α plays the role of a heterogeneity index, while μ is a space constant needed to maintain the consistency of the units in the fractional order version of the Bloch-Torrey equation.
In this study our goal was to evaluate (6) and to investigate the relationship between material structure, diffusion attenuation, and the parameters β and μ. In order to constrain the diffusion to a heterogeneous, but stable system, we chose a series of Sephadex gels as the test material.
2. METHODS
2.1 Gels and Properties
Sephadex is a network of chemically cross-linked dextrans, well known for its relatively uniform pore size. These gels are structurally heterogeneous swollen polymer networks that are commonly used for protein separation based in size. In the gel, water molecules freely move into and out of the many small pores and channels while the much larger proteins get trapped and retained. Sephadex can be used for molecular size chromatography, for desalting and for the exchange of buffers. In the absence of a bulk hydrostatic pressure, there is no net motion in the gel-water system other than that due to diffusion.
In this project, seven different Sephadex gels (Sigma, St. Louis, MO) were studied. Each gel is characterized by two numbers (e.g., G25-50), the first indicating the macromolecular exclusion limit associated with the pore network (in kDaltons) and the second specifying the maximum dry bead diameter (in microns). The first series of gels studied (G25-50, G25-80, G25-150, and G25-300) had the same internal structure (pores designed to retain relatively small proteins (< 25 kDaltons), but increasing bead size (from 50 to 300 microns. The second series of gels studies (G25-50, G50-50, G75-50 and G100-50) all had the same bead diameter, but with increasing internal pore sizes (designed to progressively retain proteins from 25 up to 100 kDaltons).
The gels were prepared by gently mixing the dry powder gels in excess distilled water at room temperature and allowed to swell and settle under the influence of gravity overnight. The next day the slurry was carefully poured into 5 mm diameter NMR tubes and sealed until used for the experiment (within 24 hours). In each experiment a complete series of hydrated gels were loaded into the NMR spectrometer.
2.2 NMR System and Diffusion Sequences
The NMR spectroscopy studies were performed in the Magnetic Resonance Imaging Research Center at Pennsylvania State University. The NMR spectrometer used was a Varian 14.1 Tesla (600 MHz) vertical bore imaging spectrometer (clear bore 9.8 cm). A specially built RF saddle coil was used to generate the B1 field and a pulsed field-gradient stimulated echo (PGSTE) pulse sequence (Fig. 1) was used to generate diffusion-weighting in the data.
Fig. 1.
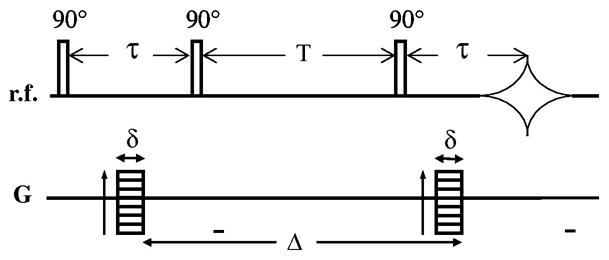
Pulsed field-gradient stimulated echo (PGSTE) pulse sequence.
The diffusion or observation time (Δ) was varied from 27 to 200 ms while three diffusion pulse widths (δ) were used (3, 5, and 7 ms). The gradient direction was z and the amplitude of the diffusion-encoding gradient (Gz) was stepped in the range from 0.01 to 0.4 Tesla/m. The corresponding b values for these experiments ranged from 100 up to 4,000 s-mm2.
2.3 Data fitting and Analysis
The fractional model (6) is a generalization of the stretched exponential that has 4 fitting parameters, S0, β, μ, and D. We initially normalize the attenuation data by dividing by S0 – the value of which is obtained by extrapolating to S0 through a linear fit (on a log vertical scale) to the signal magnitude at low b values (b < 1,000 s-mm2). A Levenberg-Marquardt nonlinear regression algorithm in MATLAB was then used to fit the remaining three parameters subject to appropriate constraints (0.5 < β < 1, D > 0, and μ > 0). See Magin et al., [17] for more details on the fitting procedures.
3. RESULTS
2.1 Signal Attenuation in Gels
The signal decay in Sephadex gels exhibited anomalous behaviour for gels with the smallest pore sizes. For example, consider the results of a preliminary diffusion study shown in Fig. 2 [17]. This experiment was conducted at 11.74 Tesla (500 MHz for protons) using a 56 mm vertical bore magnet (Oxford Instruments, Oxford, UK) and a Bruker DRX Avance Spectrometer (Bruker Instruments, Billerica, MA. USA). Diffusion-weighted images were acquired using a Stejskal-Tanner diffusion weighted spin-echo pulse sequence with the following parameters: TR = 1000 ms, TE = 60 ms, slice thickness = 1.5 mm, Δ = 45 ms, δ = 1 ms, and 4 averages. The FOV was 0.6 cm × 0.6 cm, which for a matrix size of 64 · 64 corresponds to an in-plane resolution of 94 μm × 94 μm. All samples were placed in 5 mm diameter, glass NMR tubes. The series G-100, G 50 and G 25 (all used 50 micron diameter beads) shows increasing evidence of restricted diffusion as the data diverge at higher b values from the linear water attenuation curve. Fits of (6) to these data are summarized in Table 1.
Fig. 2.
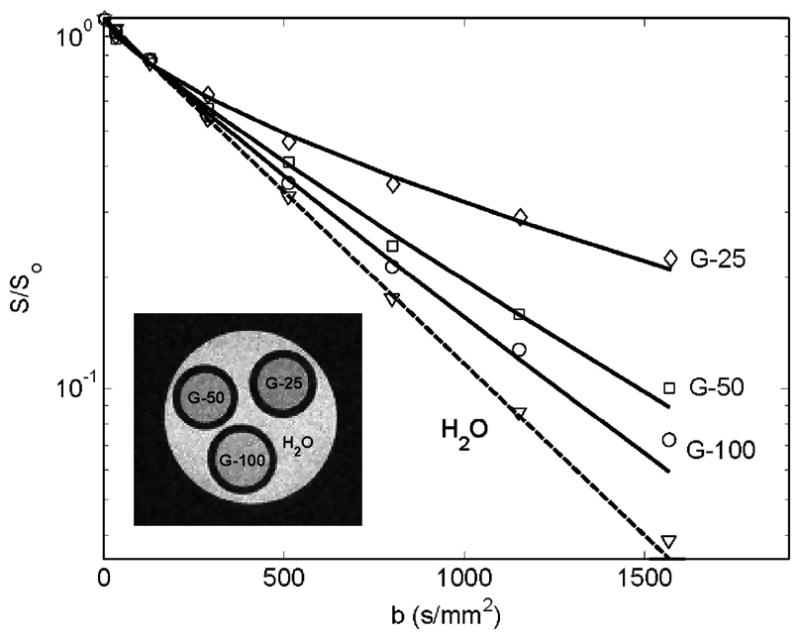
Normalized signal intensity plotted versus b, where b = (γGzδ)2Δ, for selected regions of interest in the MR image in samples of distilled water and Sephadex G-25, G-50 and G-100. The experimental data were fit to the fractional order model (6) to determine Df, β and μ.
Table 1.
Diffusion and complexity measurement
| DF × 10−3mm2/s | β a.u. | μ (μm) | |
|---|---|---|---|
| G25-50 | 1.1 ± 0.04 | 0.71 ± 0.06 | 6.4 ± 0.1 |
| G50-50 | 1.5 ± 0.03 | 0.8 ± 0.05 | 5.7 ± 0.1 |
| G100-50 | 1.8 ± 0.06 | 0.91 ± 0.08 | 4.4 ± 1.6 |
| Distilled water | 2.1 ± 0.02 | 1.0 ± 0.003 | 2.9 ± 0.3 |
The diffusion data provided by fitting the model provides a good correlation between the known microstructure of the Sephadex gels. As the G-number decreases, corresponding to smaller internal pore dimensions, the apparent diffusion coefficient falls, the β value decreases, and the μ value increases. The distilled water is the least restricted environment, while the G25 Sephadex gel is the most restricted. In this experiment the value of Δ ≫ δ. These results are also consistent with plots of the analytical behaviour of (6) in [17].
In the current study of Sephadex gels at 14.1 Tesla (600 MHz for water protons), we extended the results shown in Fig. 2 by studying this series of gels (with some modifications) over a wider range of b-values (100 to 4,000 s-mm2), diffusion times (27 to 200 ms), and diffusion pulse lengths (3, 5, 7 ms). The data are summarized in Fig. 3, 4 and 5, where for the series of Sephadex gels, the fractional fitting parameters are all plotted as a function of the diffusion time, Δ.
Fig. 3.
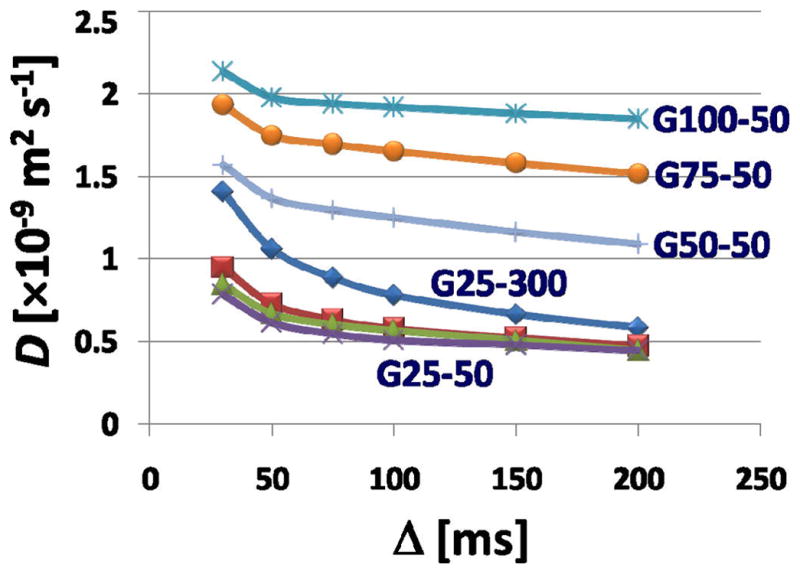
Plot of the apparent diffusion coefficient versus the diffusion time Δ. The D value was obtained from fitting (6) to the measured NMR signals as a function of Δ.
Fig. 4.
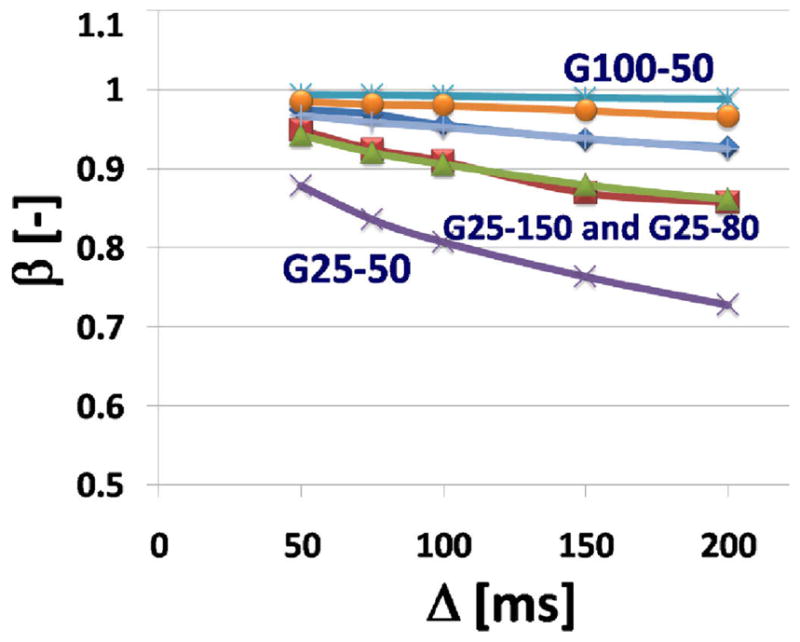
Plot of the fractional order index β versus the diffusion time Δ. The β value was obtained from fitting (6) to the measured NMR signals as a function of Δ.
Fig. 5.
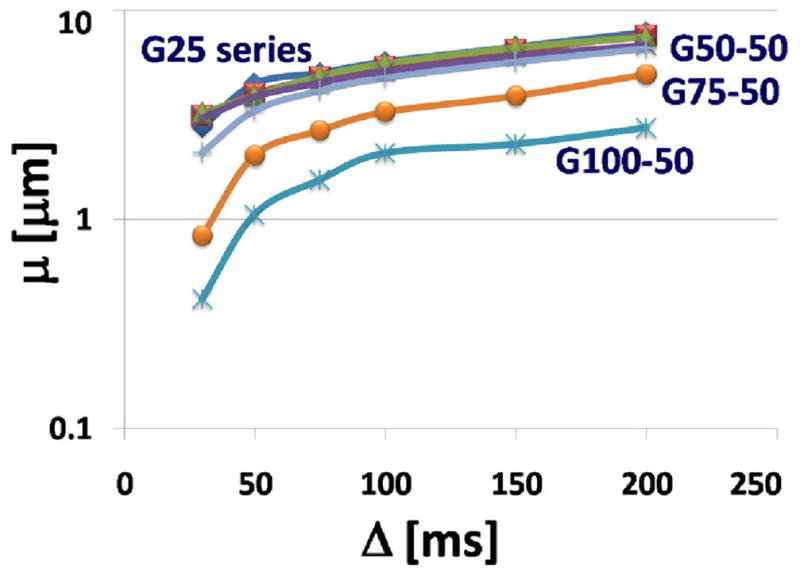
Plot of the fractional space constant μ versus the diffusion time D. The μ value was obtained from fitting (6) to the measured NMR signals as a function of Δ.
In Fig. 3 the apparent diffusion coefficient is plotted versus diffusion time. There are three features of these data that deserve comment: first, the overall trend downward toward a plateau, for all gels; second, the progressive fall in the plateau values of D for the series G-100 (largest pores) through G-25 (smallest pores); and third the relative small influence of bead size. The fall in D values with time and with increasing tortuosity is expected, while the lack of a bead size effect – assuming that the hydrated beads pack closely as spheres – is reassuring as it suggests that the majority of the restricted diffusion occurs within the gel itself.
In Fig. 4 the fractional order index β is plotted as a function of the diffusion time, Δ. These data show a much smaller dynamic range, typical of stretched exponential fits where values of β near to 1.0 reflect an isotropic, uniform and homogeneous environment, while values of β near 0.5 describe the presence of a wide distribution of many exponential decay curves. Here the evidence of a plateau for G-25 appears to require even longer diffusion times than those sampled and the effect of bead size seem to play an almost equal role in the observed changes – supporting the interpretation of β as an inverse heterogeneity index (β decreasing with increasing gel complexity: porosity and tortuosity).
In Fig. 5 the fractional space parameter μ is plotted against the diffusion time, Δ. Theoretically, the μ values, which have the units of length – typically in microns – have an inverse relationship with restricted diffusion, that is, larger values of μ arise in situations where diffusion is more restricted. This is seen in (6) where μ acts on D as a kind of tortuosity factor (a larger μ, reduces the ‘effective’ value of the D). In this study the behaviour of μ as a function of diffusion time was examined systematically for the first time. The overall trend is toward increasing μ with time and with tortuosity. The curious downturn in μ at low values of Δ bears further examination and the previously recognized relationship:
| (7) |
with, η = 0.4 to 0. 6, when Δ > 50 ms also should be studied. Perhaps there is some connection with the theoretical intersection of (6) for all values of β when q = 1/2πμ.
4. DISCUSSION
The diffusion time is perhaps the most important parameter under experimental control in an NMR diffusion experiment [19]. This is because in a complex or heterogeneous material the apparent value of the diffusion constant changes as a function of time. For short times, if the water is able to freely move in all directions then D = D0, a constant, with a value near that of the free diffusion coefficient for pure water: 2.5 × 10⁻³ mm2/s). At intermediate times, the boundaries begin to affect the process in a manner that reduces the apparent D, for example, de Swiet and Sun [20] have derived for this case the relationship
| (7) |
where α depends on the PFG gradient profile, T is the time between gradient pulses (Δ in our experiments) and S/V the surface to volume ratio. Finally, for long times, the value if D is reduced further as the water has the opportunity to fully explore all the nooks and crannies of a porous and tortuous environment. Thus, plotting the value of D obtained by the fractional order fits as a function of C gives information on the interaction between the water and the Sephadex gel structure.
Sephadex is a hydrogel that is supplied as beads rather than as a monolithic structure. Thus, water transport in the swollen gel occurs both in the network of pores within the beads and in the interstitial voids between the swollen Sephadex beads. Water mobility within the gel beads is restricted by interactions with the polymer network, so there are at least three distinct ‘compartments’ for the gel phase water (i.e., pore, polymer network bound, interstitial).
Sephadex has been studied previously by NMR diffusion to extract measures of its microstructure (porosity, tortuosity, surface/volume ratio), and by spin lattice or spin-spin relaxation to investigate its compartmental and surface relaxation behaviour. For example, in a DFG diffusion study by Van Dusschoten [21] of Sephadex G25-300, the apparent diffusion coefficient was measured as a function of Δ for packed bead beds at three different flow water flow rates. For a zero flow rate D was independent of Δ, but the decay curve was bi-exponential with two D values (0.7 × 10⁻³ mm2/s and 1.7 × 10⁻³ mm2/s), which bound the D values measured in our experiments (Fig. 3).
In an NMR study of other hydrogels (agar, agarose, and polyacrylamide) by Chui and colleagues [22], a fiber cell model was used to uncouple diffusion from relaxation. The solution to the diffusion problem found three regimes possible (fast, intermediate and slow). These hydrogels all qualified as a fast diffusion regime phenomena so that the relationship between relaxation and diffusion simply involved the sum of the respective decay rates. This allowed the hydraulic radius to be estimated from T1 relaxation measurements. As expected, for each gel the effective hydraulic radius decreased as the gel concentration increased. One novel aspect of this model was its ability to connect the relaxation processes for to a pore radius distribution. This suggests that a fractional order model of the relaxation data may also be effective in describing such dynamic processes is a variety of hydrogels.
5. CONCLUSIONS
The research reported in this paper analyzed the time-dependence of the apparent diffusion coefficient of water in a series of Sephadex hydrogels with different pore sizes. The NMR diffusion data were fit with a fractional order stretched exponential model that was previously derived from the Bloch-Torrey equation using fractional calculus. The fractional fitting parameters β and μ were found to change with diffusion time in a manner that reflected the porosity and tortuosity of the gels; that is, as the pore diameters decreased (and the complexity of the medium increased) the β value decreased and the μ value increased. The result for β is consistent with previous work that has shown fractional order values to fall when material heterogeneity increases. The result for μ is new, and needs more study, but appears to reflect a decrease in the apparent diffusion coefficient. Future work will be directed at investigating such behaviour for longer and shorter diffusion times and on examining changes in β and μ in developing engineered tissues such as cartilage.
Acknowledgments
R. L. Magin would like to acknowledge the support of NIH grant R01 EB007537 for partial support of this work.
Contributor Information
Richard L. Magin, Email: rmagin@uic.edu.
Belinda S. Akpa, Email: akpa@uic.edu.
Thomas Neuberger, Email: tneu@engr.psu.edu.
Andrew G. Webb, Email: A.Webb@lumc.nl.
References
- 1.Abragam A. Principles of Nuclear Magnetism. Oxford: Oxford University Press; 2002. [Google Scholar]
- 2.Callaghan PT. Principles of Magnetic Resonance Microscopy. Oxford: Oxford University Press; 1991. [Google Scholar]
- 3.Grebenkov DS. NMR survey of reflected Browning motion. Rev Mod Phys. 2007;79:1077–1137. [Google Scholar]
- 4.Price WS. Pulsed-field gradient nuclear magnetic resonance as a tool for studying translational diffusion: Part 1. Basic theory. Concepts Magn Reson. 1997;9:299–336. [Google Scholar]
- 5.Grebenkov DS. Multiexponential attenuation of the CPMG spin echoes due to a geometrical confinement. J Magn Reson. 2006;180:118–126. doi: 10.1016/j.jmr.2006.01.014. [DOI] [PubMed] [Google Scholar]
- 6.Peled S, Cory DG, Raymond SA, Kirschner DA, Jolesz FA. Water diffusion, T2, and compartmentation in frog sciatic nerve. Magn Reson Med. 1999;42:911–918. doi: 10.1002/(sici)1522-2594(199911)42:5<911::aid-mrm11>3.0.co;2-j. [DOI] [PMC free article] [PubMed] [Google Scholar]
- 7.Thewell PE, Grant SC, Stanisz GJ, Blackband SJ. Human erythrocyte ghosts: Exploring the origins of multiexponential water diffusion in a model biological tissue with magnetic resonance. Magn Reson Med. 2002;48:649–657. doi: 10.1002/mrm.10270. [DOI] [PubMed] [Google Scholar]
- 8.Narayanan A, Hartman JS, Bain AD. Characterizing nonexponential spin-lattice relaxation in solid-state NMR by fitting to the stretched exponential. J Magn Reson Ser A. 1995;112:58–65. [Google Scholar]
- 9.Mazo RM. Brownian Motion: Fluctuations, Dynamics, and Applications. Oxford: Oxford University Press; 2002. [Google Scholar]
- 10.Shao M, Nikias CL. Signal processing with fractional lower order moments: Stable processes and their applications. Proc IEEE. 1993;81:986–1009. [Google Scholar]
- 11.Metzler R, Klafter J. The random walk’s guide to anomalous diffusion: A fractional dynamics approach. Phys Rep. 2000;339:1–77. [Google Scholar]
- 12.Minati L, Weglarz WP. Physical foundations, models, and methods of diffusion magnetic resonance imaging of the brain: A review. Concepts Magn Reson Part A. 2007;30A:278–307. [Google Scholar]
- 13.Bennett KM, Schmainda KM, Bennett RT, Rowe DB, Lu H, Hyde JS. Characterization of continuously distributed cortical water diffusion rates with a stretched exponential model. Magn Reson Med. 2003;50:727–734. doi: 10.1002/mrm.10581. [DOI] [PubMed] [Google Scholar]
- 14.Bennett KM, Hyde JS, Schmainda KM. Water diffusion heterogeneity index in the human brain is insensitive to the orientation of applied magnetic field gradients. Magn Reson Med. 2006;56:235–239. doi: 10.1002/mrm.20960. [DOI] [PubMed] [Google Scholar]
- 15.Hall MG, Barrick TR. From diffusion-weighted MRI to anomalous diffusion imaging. Magn Reson Med. 2008;59:447–455. doi: 10.1002/mrm.21453. [DOI] [PubMed] [Google Scholar]
- 16.Jug G. Theory of NMR field-gradient spectroscopy for anomalous diffusion in fractal networks. Chem Phys Lett. 1986;131:94–97. [Google Scholar]
- 17.Magin RL, Abdullah O, Baleanu D, Zhou XJ. Anomalous diffusion expressed through fractional order differential operators in the Bloch-Torrey equation. J Magn Reson. 2008;190:255–270. doi: 10.1016/j.jmr.2007.11.007. [DOI] [PubMed] [Google Scholar]
- 18.Zhou XJ, Gao Q, Abdullah O, Magin RL. Studies of anomalous diffusion in the human brain using fractional order calculus. Magn Reson Med. 2010;63:562–569. doi: 10.1002/mrm.22285. [DOI] [PubMed] [Google Scholar]
- 19.Sen PN. Time-dependent diffusion coefficient as a probe of geometry. Concepts Magn Reson. 2004;23A:1–21. [Google Scholar]
- 20.De Swiet TM, Sen PN. Time dependent diffusion coefficient in a disordered medium. J Chem Phys. 1996;104:206–209. [Google Scholar]
- 21.Van Dusschoten D. PhD Thesis. Univ. of Wageningen; 1996. Probing water motion in heterogeneous systems: A multi-parameter NMR approach. [Google Scholar]
- 22.Chui MM, Phillips RJ, McCarthy MJ. Measurement of the porous microstructure of hydrogels by nuclear magnetic resonance. J Colloid Interface Sci. 1995;174:336–344. [Google Scholar]