Abstract
In vivo detection of Alzheimer's disease (AD) neuropathology in living patients using positron emission tomography (PET) in conjunction with high affinity molecular imaging probes for β-amyloid (Aβ) and tau has the potential to assist with early diagnosis, evaluation of disease progression, and assessment of therapeutic interventions. Animal models of AD are valuable for exploring the in vivo binding of these probes, particularly their selectivity for specific neuropathologies, but prior PET experiments in transgenic mice have yielded conflicting results. In this work, we utilized microPET imaging in a transgenic rat model of brain Aβ deposition to assess [F-18]FDDNP binding profiles in relation to age-associated accumulation of neuropathology. Cross-sectional and longitudinal imaging demonstrated that [F-18]FDDNP binding in the hippocampus and frontal cortex progressively increases from 9 to 18 months of age and parallels age-associated Aβ accumulation. Specificity of in vivo [F-18]FDDNP binding was assessed by naproxen pretreatment, which reversibly blocked [F-18]FDDNP binding to Aβ aggregrates. Both [F-18]FDDNP microPET imaging and neuropathological analyses revealed decreased Aβ burden after intracranial anti-Aβ antibody administration. The combination of this non-invasive imaging method and robust animal model of brain Aβ accumulation allows for future longitudinal in vivo assessments of potential therapeutics for AD that target Aβ production, aggregation, and/or clearance. These results corroborate previous analyses of [F-18]FDDNP PET imaging in clinical populations.
Keywords: [F-18]FDDNP, positron emission tomography, amyloid, transgenic rat, naproxen, immunotherapy
INTRODUCTION
β-Amyloid (Aβ) plaques and neurofibrillary tangles are the neuropathological hallmarks of Alzheimer's disease (AD). In vivo detection and quantification of AD neuropathology in living patients could assist with diagnosis, evaluation of progression, and assessment of interventions (Rinne et al., 2010; Small et al., 2006). Progressive deposition of Aβ plaques and neurofibrillary tangles in AD follows a hierarchical pattern, starting in the medial temporal lobes before spreading elsewhere (Braak and Braak, 1991). In vivo detection of neuropathology therefore requires the sensitivity to detect low lesion burdens and the capacity to simultaneously probe multiple regions. Positron emission tomography (PET) using high-affinity molecular imaging probes for Aβ and/or tau aggregates fulfills these criteria. Carbon-11 or fluorine-18 labeled probes such as 2-(1-{6-[(2-[F-18]fluoroethyl)methylamino]-2-naphthyl}ethylidene)malononitrile ([F-18]FDDNP; Shoghi-Jadid et al., 2002; Small et al., 2006), (2-(4'-[C-11]methylaminophenyl)-6-hydroxybenzothiazole ([C-11]PIB; Klunk et al., 2004), (2-(4'-methylamino-3’-[F-18]fluorophenyl)-6-hydroxybenzothiazole ([F-18]PIB; Vandenberghe et al., 2010), (E)-4-(2-(6-(2-(2-(2-[F-18]fluoroethoxy)ethoxy)ethoxy) pyridin-3-yl)vinyl)-N-methyl benzenamine ([F-18]AV-45; Wong et al., 2010), 4-N-[C-11]methylamino-4'-hydroxystilbene (SB-13; Verhoeff et al., 2004), and trans-4-(N-methylamino)-4′-{2-[2-(2-[F-18]fluoroethoxy)ethoxy]ethoxy}stilbene (BAY94-9172; Rowe et al., 2008) have been used to target AD neuropathology in vivo and, in many cases, can distinguish subjects with AD or mild cognitive impairment from normal controls (Jack et al., 2009; Rowe et al., 2007; Small et al., 2006; Tolboom et al., 2009).
Thorough in vivo validation of these PET imaging probes requires direct correlation of PET and neuropathological findings, which is ordinarily limited to subjects with severe AD who die shortly after PET scan, and competition experiments to establish specificity. Validation at earlier stages of AD is made difficult by slow disease progression and long intervals between PET and post-mortem examinations. Imaging of transgenic rodent models of AD with subsequent in vitro assessment of neuropathology provides another method for probe validation. Previous imaging experiments in transgenic mouse models of brain Aβ amyloidosis with [C-11]PIB and/or [F-18]FDDNP microPET imaging have yielded mixed results (Klunk et al., 2005; Kuntner et al., 2009; Maeda et al., 2007; Toyama et al., 2005). This work has been hampered by the limited spatial resolution of microPET and partial volume effects that are exacerbated by the small size of mouse brains (Kuntner et al., 2009). The recent development of a transgenic rat model of brain Aβ amyloidosis (Flood et al., 2009; Liu et al., 2008) provides an alternative to the use of transgenic mice. Rat brains are six times larger than mouse brains, allowing for more consistent quantitative in vivo microPET imaging (Lacan et al., 2008).
The work described here focuses on quantitative analyses of in vivo [F-18]FDDNP microPET imaging of Aβ plaques in this rat model by examining: 1) Aβ amyloid plaque load as a function of age, both in vivo using cross-sectional and longitudinal [F-18]FDDNP microPET imaging and in vitro using immunohistochemical and biochemical techniques; 2) in vivo binding specificity of [F-18]FDDNP for Aβ via blockade of [F-18]FDDNP microPET signal by pretreatment with naproxen, which binds Aβ in vitro (Agdeppa et al., 2003); and 3) [F-18]FDDNP microPET imaging before and after intracranial administration of anti-Aβ antibodies, which reduces Aβ plaque load in other transgenic rodent models of AD (Maeda et al., 2007; Thakker et al., 2009; Tucker et al., 2008; Wilcock et al., 2003).
METHODS
Animal subjects
We used a triple-transgenic rat model of AD (Tg478/Tg1116/Tg11587) originally derived by Flood and colleagues (Flood et al., 2009). These animals are homozygous for three gene constructs: 1) human APP 695 with the K670N/M671L mutation (rat synapsin-1 promoter); 2) human APP minigene with the K670N/M671L and V717F mutations (platelet derived growth factor β promoter); and 3) human PS-1 with the M146V mutation (rat synapsin-1 promoter). The neuropathological characterization of these animals has previously been described in detail (Flood et al., 2009; Liu et al., 2008). Sparse parenchymal Aβ plaques begin to appear between 7 to 9 months of age, and plaque density progressively increases with age in cortical and hippocampal regions, but not the cerebellum (Supplemental Figure 1). Aβ deposits are predominantly visualized as diffuse plaques, with a smaller percentage of fibrillar plaques that are seen primarily in the hippocampus. Breeding pairs obtained from Cephalon Inc. (West Chester, PA) were bred and aged at the UCLA School of Medicine vivarium facility. Control [F-18]FDDNP images were obtained from wild-type Sprague-Dawley rats (Charles River, Wilmington, MA). All animals were housed under a 12-hour light/dark cycle and had access to standard rat chow ad libitum. The UCLA Chancellor’s Animal Research Committee approved this study and all animal experiments were conducted in compliance with its guidelines.
[F-18]FDDNP imaging
[F-18]FDDNP was prepared for use in animals at the UCLA Biomedical Cyclotron facility as previously described (Liu et al., 2007), and delivered concentrated in ethanol. The specific activity of the imaging probe averaged 4–8 Ci/µmmol (148–296 GBq/µmol) at the end of synthesis and the chemical and radiochemical purity of the preparations exceeded 97% in all cases.
Animals were maintained under anesthesia during microPET and microCT scans with 2–2.5% isoflurane in oxygen delivered at 2 L/min. Scans were performed in an imaging chamber equipped with a nose cone for anesthesia delivery, tooth bar for head positioning, and heating pad for body temperature control (Suckow et al., 2009). MicroPET experiments were performed on a Focus 220 MicroPET scanner (Siemens Preclinical Solutions, Knoxville, TN; Tai et al., 2005) and microCT experiments were performed on MicroCAT II tomograph (Siemens Preclinical Solutions, Knoxville, TN) using previously described parameters (Chow et al., 2006). Animals were positioned in the microPET scanner with their heads in the center of the field of view and injected via tail vein with 0.75-2.5 mCi (37 – 92 MBq) of [F-18]FDDNP in 10% ethanol in saline using a 28 gauge insulin needle at the start of microPET data acquisition. MicroPET data were collected for 40 minutes after which the chamber was transferred to the microCT scanner and a 10 minute CT scan of the head was performed for the purpose of attenuation correction (Chow et al., 2005).
Cross-sectional and longitudinal [F-18]FDDNP imaging experiments
Cross-sectional [F-18]FDDNP imaging was obtained with groups of three transgenic animals ranging from 9 to 22 months of age, and groups of wild-type rats at 9 months (n=3), 14 months (n=2), and 17 months (n=4) of age. Longitudinal [F-18]FDDNP imaging was obtained with a group of 6 transgenic animals at 10, 13, 15, and 18 months of age.
In vivo naproxen blocking experiment
Naproxen ((2S)-2-(6-methoxynaphthalen-2-yl)propanoic acid) is a competitive inhibitor of FDDNP amyloid binding in vitro (Agdeppa et al., 2003). Six 17 month-old transgenic rats and two 14 month-old wild-type Sprague-Dawley rats received oral gavage doses of naproxen (8 mg/kg) suspended in 0.5 mL of saline at three time points: both the morning and the evening of the day prior to the [F-18]FDDNP microPET scan and one hour before the scan. Animals were anesthetized with isoflurane (2–2.5% at 2 L/min) during gavage. Each animal received three [F-18]FDDNP microPET scans: a baseline scan, a naproxen blocking scan, and a follow-up scan after naproxen washout (2 weeks after naproxen administration).
Autoradiography experiments
Serial 10 µm coronal sections of the rat forebrain at the level of the hippocampus were dehydrated through an ethanol gradient, defatted in xylene (40 minutes), and then rinsed in ethanol. Slides were equilibrated in phosphate-buffered saline (PBS; 15 minutes), incubated with [F-18]FDDNP (0.2 mCi/mL) in 1% EtOH in PBS (25 minutes), then sequentially washed in dH2O (30 seconds), 40% 2-methyl-2-butanol in dH2O (5 minutes), and dH2O (30 seconds). Sections were dried under air, dipped in undiluted Hypercoat LM-1 film emulsion (GE Healthcare; Piscataway, NJ), and held at 43 C. Slides were placed at an angle and dried in ambient air to produce even coating. The emulsion was exposed overnight and developed in Kodak D-19 developer (2 minutes), stopped in 0.05% acetic acid (30 seconds), and fixed in Kodak Fixer (5 minutes). Slides used for the naproxen blocking experiment were treated with 1 µM (S)-naproxen (Aldrich; Milwaukee, WI) in 1% EtOH in PBS for 1 hour prior to [F-18]FDDNP incubation, but were otherwise processed in an identical fashion.
Intracerebral anti-Aβ antibody experiments
Anti-Aβ antibody was administered either acutely or chronically in 17–18 month old transgenic rats. Four animals each received four separate unilateral injections of 1 µL of a 1 mg/mL solution of 6E10 (monoclonal mouse antibody against Aβ1–16; Covance, Princeton NJ) using a 28 gauge Hamilton syringe targeting three different anatomic positions: the right olfactory bulb/frontal cortex (stereotaxic coordinates: AP = +4.7 relative to bregma, ML = −2.0, DV1 = −3.8, DV2 = −1.8; (Paxinos and Watson, 2005), anterior hippocampus (AP = −3.8, ML = −3.4, DV = −2.8) and posterior hippocampus (AP = −7.0, ML = −5.0, DV = −2.3). Five animals had micro-osmotic pumps implanted into the right lateral ventricle (ALZET Model 1004, Alza, Mountain View, CA), which chronically perfused their contents at a rate of 0.11 µL/hr. Three animals received pumps containing 100 µL of 6E10 at 1 mg/mL in PBS, and two animals received pumps containing 100 µL of vehicle [mouse IgG1 control antibody (Sigma-Aldrich, St. Louis, MO) at 1 mg/mL in PBS]. All pumps had precut cannulas of 4.0 mm in length and were sterotaxically inserted at coordinates of AP = −0.3 and ML = −1.1. Unilateral anti-AB antibody injections/infusions allowed for analyses of antibody treatment effects relative to the contralateral (untreated) hemispheres.
Animals received baseline and post-injection/infusion [F-18]FDDNP microPET scans for in vivo quantification of regional Aβ deposition. Rats that received anti-Aβ antibody injections underwent post-injection [F-18]FDDNP imaging at 2, 4, and 6 weeks (3, 5, and 7 weeks after initial imaging). Rats implanted with intraventricular infusion pumps underwent post-infusion [F-18]FDDNP imaging at 4–5 weeks (8 weeks after initial imaging).
Image Processing and Data Analysis
Co-registration of microPET and microCT data was performed using in-house software (Chow et al., 2006). Data were rebinned into sinograms and images were reconstructed using 2D filtered back-projection with a ramp filter cutoff at the Nyquist frequency, resulting in an isotropic spatial resolution of 1.7 mm full width at half maximum. Emission data were corrected for detector efficiency, random coincidences, dead time, and isotope decay. The resulting dynamic microPET images (128 × 128 × 95) were reconstructed to match the microCT imaging field of view in the transverse direction, yielding a voxel size of 0.4 × 0.4 × 0.796 mm3. Summed images spanning from 10 to 25 minutes after injection were used to quantify regional cerebral [F-18]FDDNP binding. Summed images spanning the first 3 minutes after injection were used to identify the cerebellum and to draw and place the regions of interest (ROIs).
ROIs were drawn in the coronal plane using the AMIDE software package (http://amide.sourceforge.net; Loening and Gambhir, 2003) guided by a 3-D rat brain atlas (Toga et al., 1995). For animals in the aging and naproxen blocking experiments, separate ROIs were placed in the bilateral hemispheres on the cerebellum, hippocampi, cortex above each hippocampus, and the frontal cortex. For animals that received onetime anti-Aβ antibody injections, circular ROIs were placed at the sites of the frontal and hippocampal injections and overlying cortices, which were localized relative to the drill holes in the skull on co-registered microCT images, as well as the corresponding locations in the contralateral uninjected hemisphere. For animals with implanted infusion pumps, circular ROIs were centered around the tip of the infusion pump cannula identified on co-registered microCT images and the corresponding region in the contralateral uninfused hemisphere. ROIs for each animal were imported into the respective images and [F-18]FDDNP binding values were extracted for all areas. Binding values for each ROI were normalized to cerebellar binding values averaged across both hemispheres. The resulting standardized uptake value ratio values (SUVR; Thie, 2004) were used for data analysis.
Biochemical and immunohistochemical analyses
To quantify the association between Aβ deposition and age in the transgenic rats, animals ranging in age from 12 to 24 months were terminally sedated with pentobarbital and perfused with a HEPES (4-(2-hydroxyethyl)-1-piperazineethanesulfonic acid) buffer containing protease and phosphatase inhibitors (Calon et al., 2004). Brains were removed immediately and hemisected, with matching hemispheres prepared for biochemical or immunohistochemical analyses. In hemispheres that underwent biochemical analyses, the hippocampus and frontal cortex were dissected out, flash frozen in liquid nitrogen, and serially extracted into tris-buffered saline, lysis, and guanidine fractions (pH for all buffers=8.0) as previously described (Calon et al., 2004; Yang et al., 2005). Aβ42 levels from guanidine fractions with a microsphere-based multiplex flow-cytometry method that incorporates a sandwich-type immunoassay (xMAP; Luminex) using a commercially available kit (Aβ42 Human Singleplex Bead Kit; Invitrogen, Carlsbad CA). Guanidine fractions were selected for analysis because they include Aβ42 from extracellular plaques, which were labeled by [F-18]FDDNP in previous autoradiography experiments (Agdeppa et al., 2001). Hemispheres that underwent immunohistochemical analyses were immersion fixed in a 5% paraformaldehyde solution, serially cryoprotected in 10% and 20% sucrose solutions, flash-frozen with liquid nitrogen, and cryostat-sectioned into 10 µm coronal sections. Whole brains from a separate cohort of animals that underwent cross-sectional [F-18]FDDNP imaging were perfused and fixed with a 5% paraformaldehyde solution, cryoprotected in a 30% sucrose solution, flash-frozen, and cryostat-sectioned into 20 µm sagittal sections. Selected sections from each animal were immunolabeled with DAE, a rabbit polyclonal antibody against synthetic peptide Aβ1–13 as previously described (Lim et al., 2001) in order to determine the extent of Aβ plaque deposition. Previous work from our group has yielded similar immunohistochemical results with DAE and 4G8 (a commercially available monoclonal mouse antibody against Aβ17–24) in the Tg2576 transgenic mouse model of AD (Lim et al., 2000). Additional sections from each animal were double-stained with DAE (labeled with rhodamine) and Thioflavin-S to determine the relative proportions of fibrillar versus diffuse Aβ plaques.
Animals that received intracerebral injections or infusions were euthanized at 12 weeks after injection or 7 weeks after pump implantation. Brains from two animals that underwent anti-Aβ antibody injections were hemisected. The right (injected) and left (un-injected) hemispheres were processed separately for biochemical measurements as described above. Brain tissue from the other two injected animals and the five infused animals was prepared for immunohistochemistry. Whole brains were fixed in a 5% paraformaldehyde solution, either paraffin-embedded (infused brains) or serially cryoprotected in 10% and 20% sucrose solutions and flash-frozen (injected brains), sectioned into 10 µm coronal sections, and immunolabeled with DAE.
Overall Aβ deposition was quantified immunohistochemically on sections singly-labeled with DAE via measurements of immunolabeled plaque density with NIH Image (NIH; Bethesda MD). For sections double-labeled with DAE and Thioflavin-S, 3 (sagittal hippocampus) or 4 (coronal hippocampus and frontal cortex) 895 µm × 670 µm regions were sampled for DAE or Thioflavin-S labeled plaque counts using fluorescent microscopy (Axio Observer Analysis System, Carl Zeiss, Göttingen, Germany).
Statistical analysis
Statistical analyses were performed using PASW Statistics 17 for Windows (SPSS Inc, Chicago). Spearman’s rank correlation coefficient test was used for correlational analyses. Multiple linear regression analyses were used to assess the relative associations between DAE and Thioflavin-S plaque counts with age or [F-18]FDDNP SUVR values. Unpaired t-tests were used for cross-sectional analyses. Paired t -tests or repeated-measures analyses of variance were used for longitudinal analyses. Post hoc comparisons were performed with Fisher’s LSD test.
RESULTS
Age-associated accumulation of Aβ neuropathology in transgenic rats
We obtained region-specific measurements of age-associated changes in Aβ load from animals ranging in age from 12 to 24 months using immunohistochemical and biochemical techniques. Representative DAE-labeled sections of hippocampus and frontal cortex from animals at 13 months and 21 months of age show increased Aβ deposition with age (Figure 1). Quantification of biochemical and immunohistochemical measurements of Aβ pathology from hippocampus and frontal cortex of demonstrated significant positive correlations between age and extent of Aβ pathology in both regions using both methodologies (Figure 2; rs ranging from 0.49 to 0.80, all p's<0.05), although greater variability was seen with biochemical measurements of Aβ42, particularly in frontal cortex, which may be due to more sparse and variable plaque distribution in dissected samples. These results confirm previous reports indicating that this strain of transgenic rats demonstrates age-dependent accumulation of Aβ pathology (Flood et al., 2009; Liu et al., 2008), and allow for comparisons with measurements of Aβ load obtained via in vivo [F-18]FDDNP microPET imaging.
Figure 1.
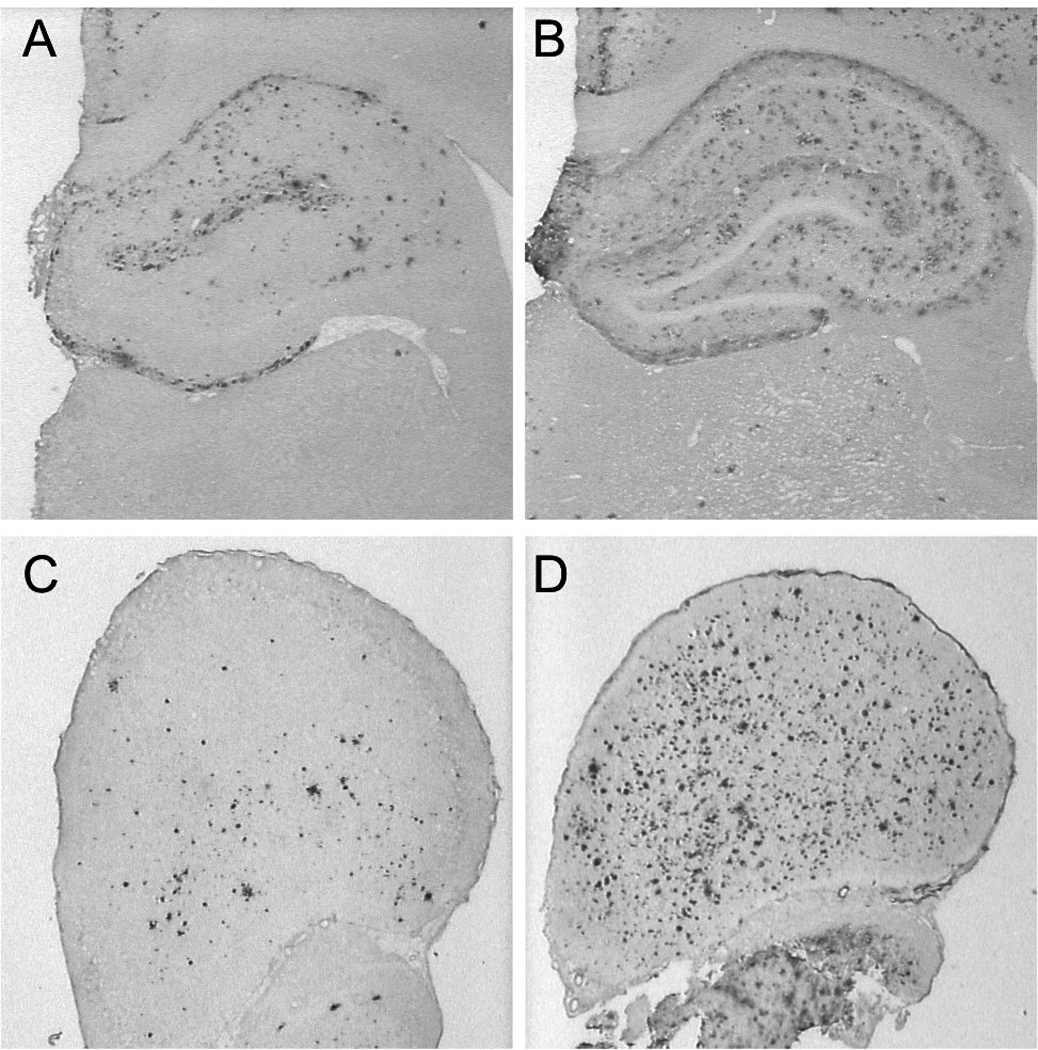
DAE-labeling of Aβ plaques in coronal sections of the hippocampus (A, B) and frontal cortex (C, D) from 13-month old (A, C) and 21-month old (B, D) transgenic rats.
Figure 2.
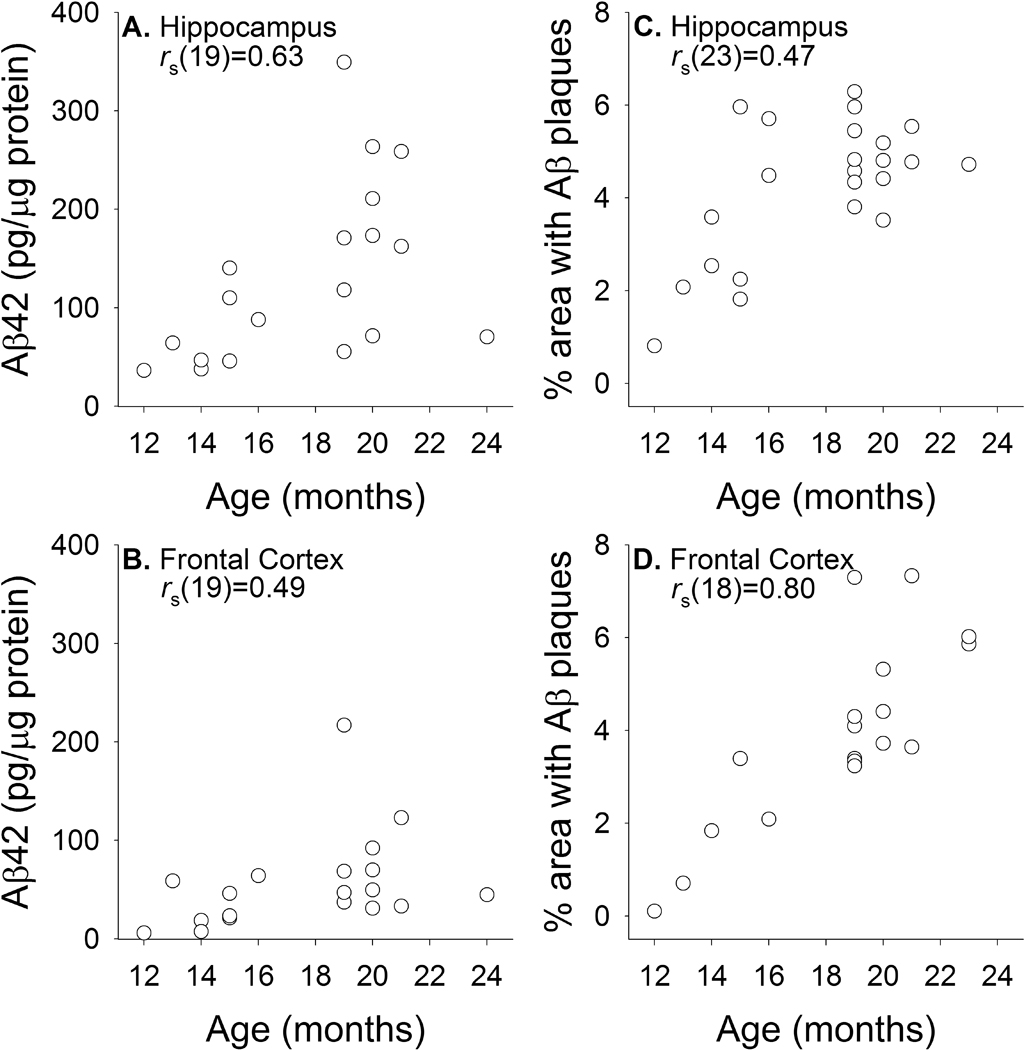
Biochemical (A, C; guanidine fraction) and immunohistochemical (B, D; DAE labeled) measurements of parenchymal Aβ levels in the hippocampus and frontal cortex of transgenic rats across different ages.
Frontal and hippocampal sections double-labeled with DAE and Thioflavin-S indicated that only a small percentage of Aβ plaques labeled by DAE were also labeled by Thioflavin-S. A significantly larger proportion of Thioflavin-S labeled plaques [ t(19)=3.49, p=0.002] was seen in the hippocampus (mean=10.9%, SD=5.2%) than in the frontal cortex (mean=6.5%, SD=8.1%). Multiple regression analyses (Figure 3) indicated that increases in the number of DAE labeled plaques, but not Thioflavin-S labeled plaques, correlated with increasing age in frontal cortex [r(21)=0.73; DAE: β =0.65, t=4.02, p=0.001; Thioflavin-S: β=0.25, t=1.52, p=0.145] and in hippocampus [r(24)=0.61; DAE: β =0.54, t=3.13, p=0.005; Thioflavin-S: β=0.30, t=1.72, p=0.101]. These findings are consistent with earlier work with this animal model of AD suggesting that age-associated increases in Aβ accumulation are driven by diffuse Aβ plaque deposition (Liu et al., 2008).
Figure 3.
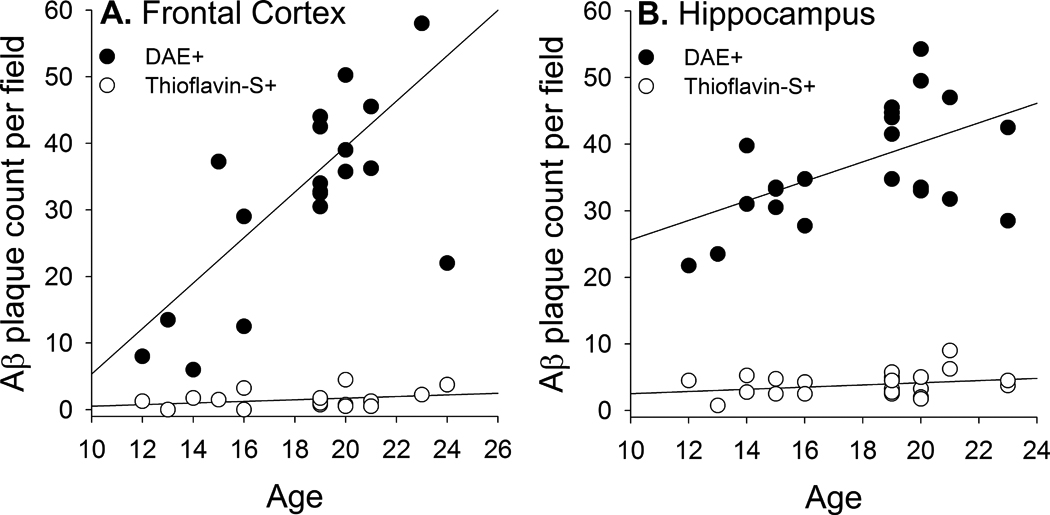
Quantification of DAE and Thioflavin-S labeled Aβ plaques in the frontal cortex (A) and hippocampus (B) of transgenic rats across different ages.
Cross-sectional [F-18]FDDNP imaging
Representative [F-18]FDDNP SUVR images from wild-type and transgenic rats of different ages are shown in Figure 4, and representative time activity curves in different brain regions are shown in Supplemental Figure 2. The increased cortical and hippocampal [F-18]FDDNP retention seen in older transgenic animals is consistent with age-associated increases in Aβ load in these regions. More detailed cross-sectional quantitative analyses of transgenic animals ranging from 9 to 22 months of age indicated that [F-18]FDDNP SUVR values increased with age in transgenic rats in both hippocampal [Figure 5A; rs(32)=0.894, p <0.001] and frontal [Figure 5B; rs(32)=0.772; p <0.001] regions. [F-18]FDDNP SUVR values in transgenic animals were significantly higher than those in age-matched wild-type Sprague Dawley rats by 9 months of age in the frontal cortex [t(4)=4.96, p=0.008] and by 14 months of age in the hippocampus [t(3)=3.67, p=0.035]. [F-18]FDDNP SUVR values in wild-types animals remained stable with increasing age. The age-related changes in [F-18]FDDNP retention in the transgenic animals parallel the age-related changes in Aβ levels that were biochemically and immunohistochemically quantified in the separate group of transgenic rats described above.
Figure 4.
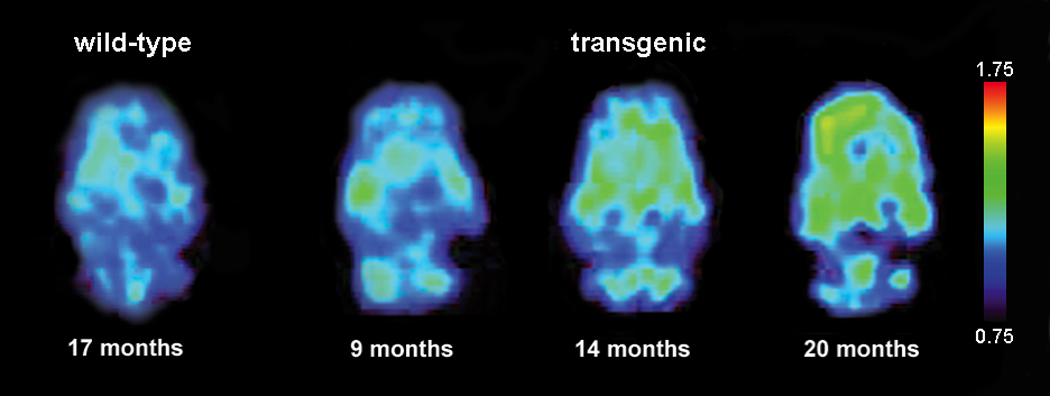
Representative [F-18]FDDNP SUVR images of wild-type and transgenic rat brains in the horizontal plane. Warmer colors represent higher signal.
Figure 5.
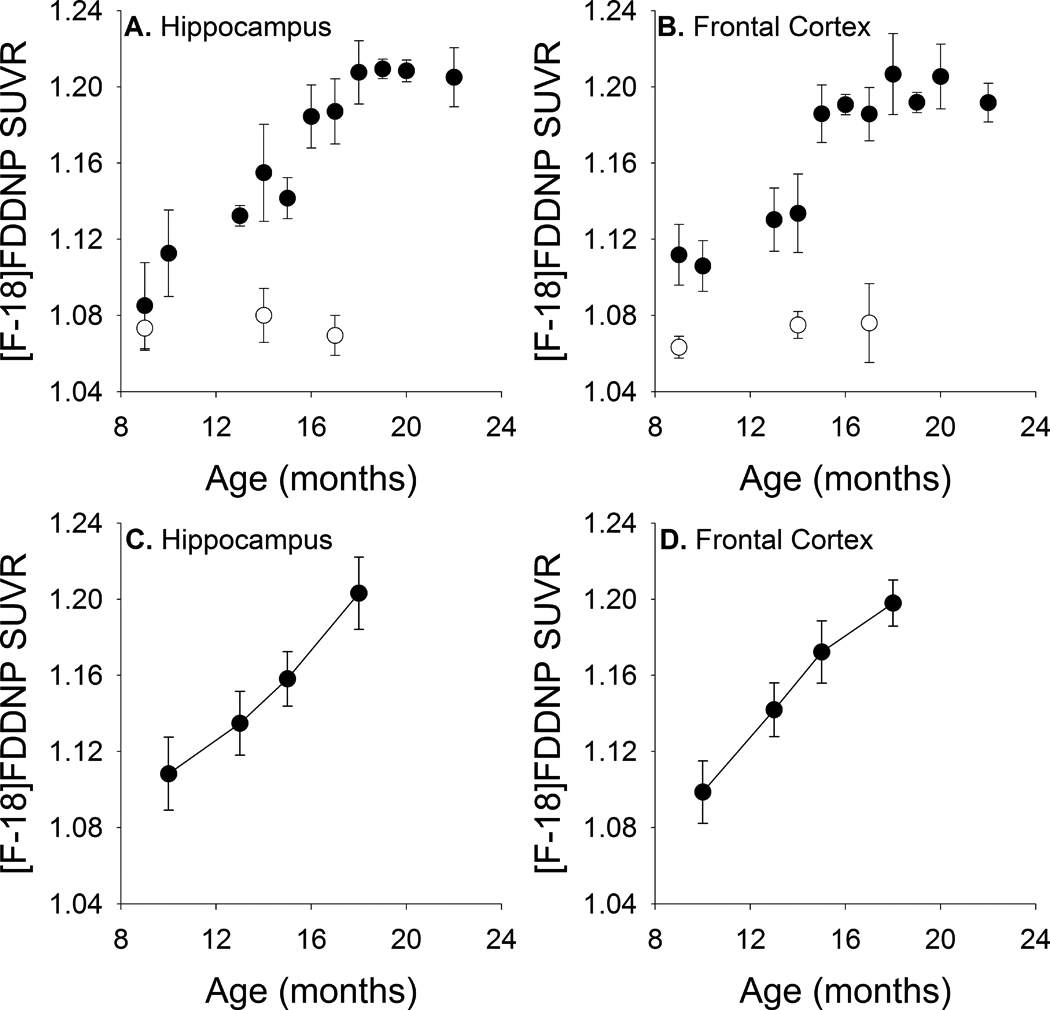
[F-18]FDDNP SUVR values increase with age in hippocampal and frontal regions with increasing age in both cross-sectionally (A, B) and longitudinally (C, D) imaged animals. Filled circles represent transgenic animals. Open circles represent wild-type animals. Error bars represent standard error of the mean (SEM).
For further confirmation that [F-18]FDDNP imaging reflects underlying Aβ plaque load, we euthanized a subset of the transgenic animals (ranging from 13 to 22 months of age) that were included in the cross-sectional [F-18]FDDNP imaging analyses described above and processed their brains for immunohistochemical analyses. Direct comparisons indicate that hippocampal Aβ plaque density measured by DAE staining correlated strongly with hippocampal [F-18]FDDNP SUVR values [Figure 6A; rs(19)=0.742, p <0.001] within individual animals. Multiple regression analysis indicated that the number of DAE labeled plaques (i.e. total Aβ load), but not the number of Thioflavin-S labeled plaques (i.e. dense core plaques), correlated with increasing hippocampal [F-18]FDDNP SUVR values [Figure 6B; r(16)=0.56; DAE: β=0.60, t=2.20, p=0.047; Thioflavin-S: β=−0.08, t=−0.30, p=0.768]
Figure 6.
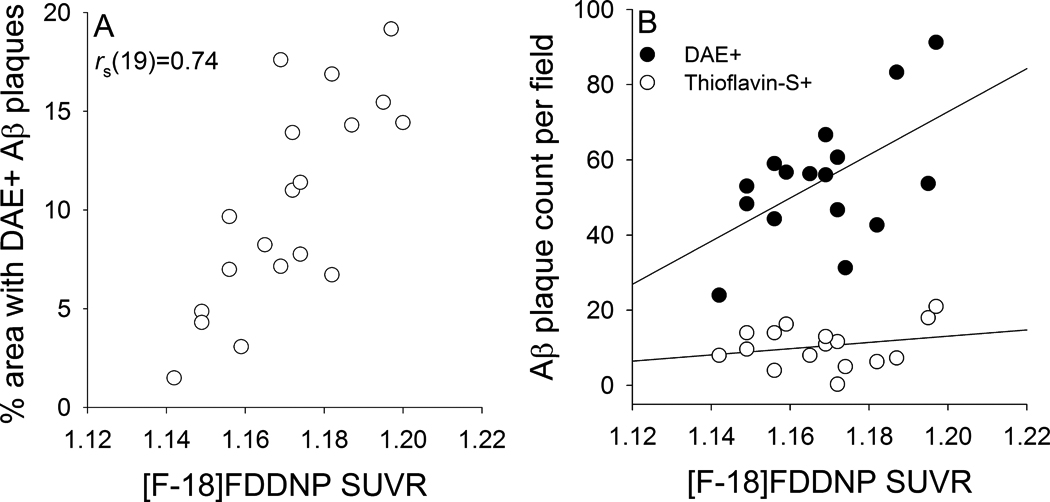
Correlation between [F-18]FDDNP microPET and immunohistochemical measurements of hippocampal Aβ [percent area labeled with DAE (A) and counts of Aβ plaques labeled with DAE or Thioflavin-S (B)] in individual transgenic rats.
Longitudinal [F-18]FDDNP imaging
To further assess the sensitivity of in vivo [F-18]FDDNP imaging for the detection of age-associated Aβ plaque accumulation, we serially imaged a group of 6 transgenic rats at 4 time points between 10 and 18 months of age. These longitudinal images revealed age-associated increases in [F-18]FDDNP SUVR values in both hippocampal [Figure 5C; F(3,15)=277.49, p <0.001] and frontal [Figure 5D; F(3,15)=533.53, p <0.001] regions similar to those observed in the cross-sectional study.
Naproxen blocking of [F-18]FDDNP binding
In vivo specificity due to stoichiometric ligand or probe interactions is demonstrated through the use of structurally unrelated molecules with specificity for the target site (Farde et al., 1985). Naproxen has previously been shown to competitively and reversibly block [F-18]FDDNP binding to in vitro generated Aβ aggregates and to senile plaques in human AD brain samples (Agdeppa et al., 2003). We sought to confirm these findings in vivo using the transgenic rat model by blocking [F-18]FDDNP binding to Aβ deposits through naproxen pre-treatment (Figure 7). Longitudinal [F-18]FDDNP imaging of 17 month-old transgenic rats at baseline, after pre-treatment with naproxen, and after two weeks of naproxen washout resulted in significant signal attenuation with naproxen pre-treatment in both hippocampal [F(2,10)=470.44, p<0.001] and frontal [F(2,10)=582.91, p<0.001] regions. Post hoc analyses indicated that in both areas, naproxen pre-treatment decreased [F-18]FDDNP binding (both regions: p <0.001), which subsequently increased after the washout period (both regions: p <0.001). [F-18]FDDNP SUVRs after washout remained slightly lower than baseline measurements (hippocampus: p=0.078; frontal cortex: p=0.012). Administration of naproxen to 14 month-old wild type rats did not affect [F-18]FDDNP SUVRs in either the hippocampus (Figure 7D) or frontal cortex (Figure 7E). These blocking experiments demonstrate the specificity of in vivo [F-18]FDDNP binding for insoluble Aβ aggregates.
Figure 7.
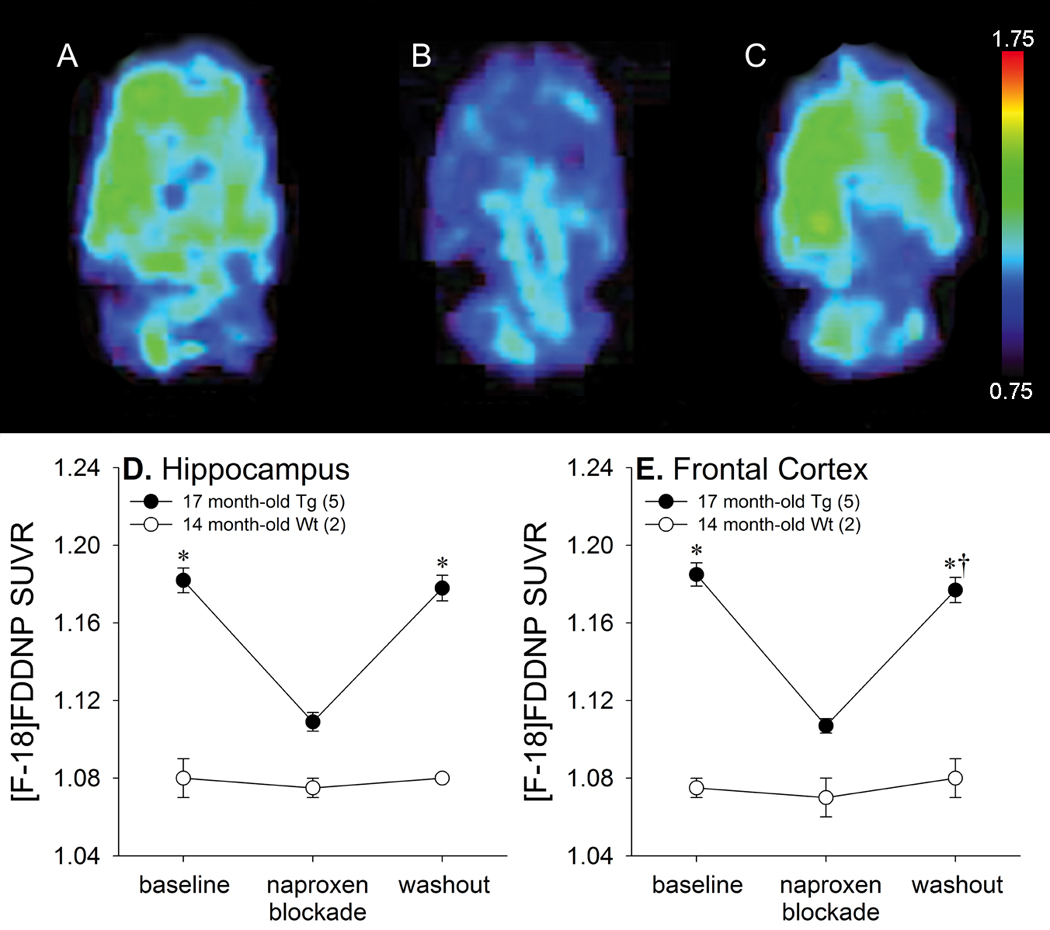
Naproxen blockade of [F-18]FDDNP binding in 17 month-old transgenic rats. Representative [F-18]FDDNP SUVR images in the horizontal plane at baseline (A), after naproxen administration (B), and after naproxen washout (C). Warmer colors represent higher signal. Average [F-18]FDDNP SUVR values in the hippocampus (D) and frontal region (E) at baseline, after naproxen administration, and after naproxen washout (* p<0.05 vs. naproxen administration, †p<0.05 vs. baseline). Error bars represent SEM.
We additionally performed in vitro autoradiography experiments examining [F-18]FDDNP in brain sections from a 23 month-old transgenic rat. The distribution of [F-18]FDDNP signal (Figure 8A) closely corresponded with the distribution of Aβ plaques labeled with DAE (Figure 8B). Both cortical and hippocampal [F-18]FDDNP labeling was markedly attenuated by naproxen blockade (Figures 8C and 8D). These findings are comparable to our previous [F-18]FDDNP autoradiography experiments with human AD brain sections (Agdeppa et al., 2003).
Figure 8.
Autoradiography of [F-18]FDDNP binding in coronal sections at the level of the hippocampus in a 23 month-old transgenic rat (A) compared with an adjacent slice labeled for Aβ with DAE (B). Autoradiography of cortical and hippocampal regions are shown at higher magnification (C) and demonstrate specific blocking after naproxen pretreatment (D).
Intracerebral anti-Aβ antibody administration
Prior work in transgenic mouse models of AD indicates that intracerebral anti-Aβ antibody administration results in significant reductions in Aβ deposits (Maeda et al., 2007; Thakker et al., 2009; Tucker et al., 2008; Wilcock et al., 2003). We sought to determine whether the results of such anti-Aβ interventions in the transgenic rats, via both one-time injections and chronic infusion, would be detectable with longitudinal [F-18]FDDNP imaging.
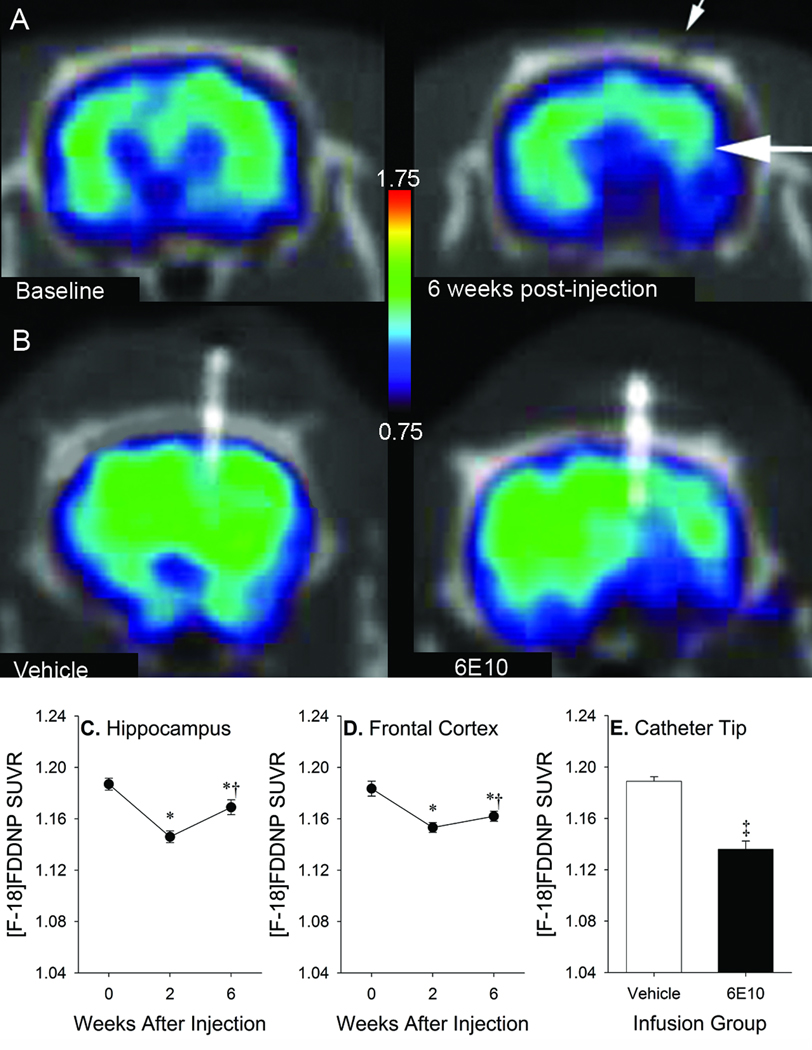
One-time injections of 6E10 (Figures 9A, 9C and 9D) resulted in significant longitudinal changes in SUVR values in the hippocampus [F(2,6)=81.83, p <0.001] and frontal cortex [F(2,6)=107.36, p <0.001]. Post hoc analyses indicated that, relative to baseline, significant reductions in SUVR were seen at 2 weeks (hippocampus: p=0.001; frontal cortex: p=0.001) and 6 weeks (hippocampus: p <0.001; frontal cortex: p=0.004) after 6E10 injections. Aβ deposits began to re-accumulate between 2 and 6 weeks after injection in both regions (hippocampus: p=0.012; frontal cortex: p=0.003). Similarly, chronic 6E10 infusion (Figures 9B and 9E) resulted in significant reductions in SUVR values relative to vehicle infusion at 4–5 weeks after micropump implantation in the ROI centered around the infusion catheter tip [t(3)=6.15, p=0.009]. Decreased [F-18]FDDNP signal was apparent in an area approximately 2–3 mm in diameter in the anterior-posterior and medial-lateral planes (centered around the infusion catheter), and 5–8 mm in length in the dorsal-ventral plane (along the length of the catheter).
Figure 9.
Representative [F-18]FDDNP SUVR images after 6E10 injection (A) or vehicle or 6E10 infusion (B) in 17–18 month-old transgenic rats. Small arrow denotes skull defect at needle insertion site. Large arrow denotes target region for injection. Warmer colors represent higher signal. SUVR values in hippocampal (C) and frontal (D) ROIs after one-time 6E10 injections in both regions (*p<0.05 vs. baseline, †p<0.05 vs. 2 weeks). SUVR values in ROIs centered on cannula tips at 4–5 weeks after micropump implantation in infused animals (E; ‡ p <0.05 vs. vehicle). Error bars represent SEM.
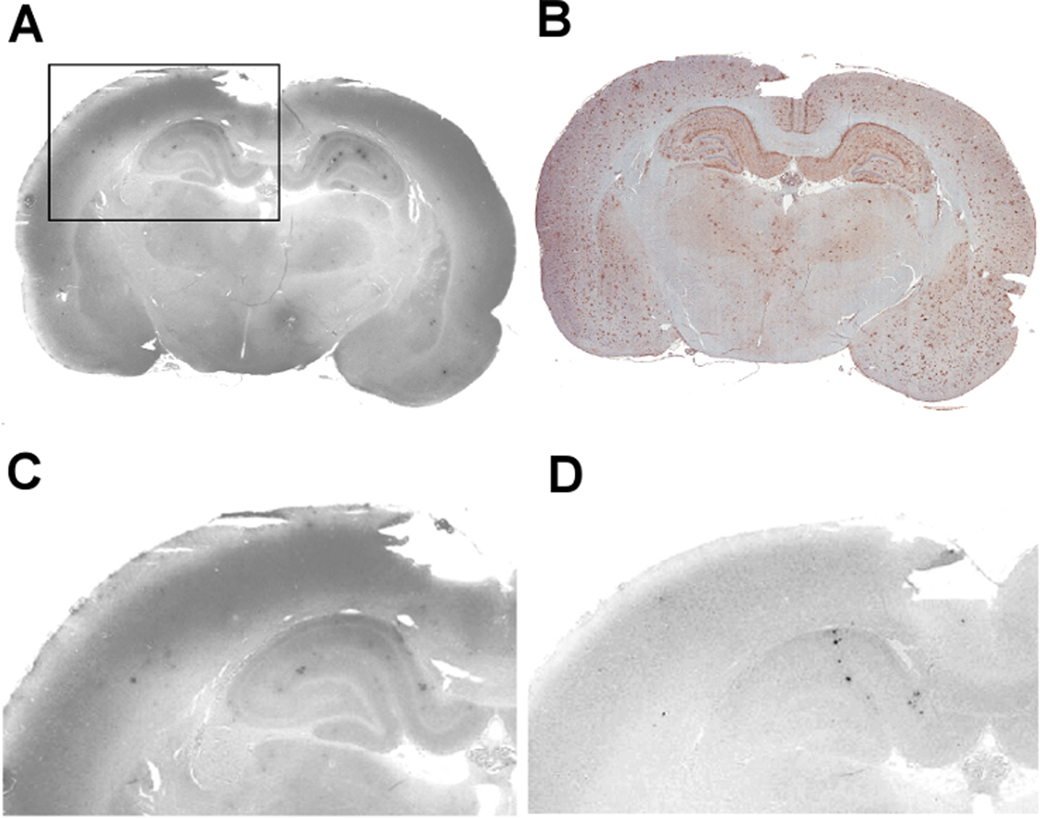
We directly measured the Aβ-lowering effects of intracerebral 6E10 administration using biochemical and immunohistochemical methods. Measurements of insoluble Aβ42 in guanidine-extracted fractions from two of the transgenic rats that received 6E10 injections revealed an average reduction of 21% in frontal cortex and 47% in the hippocampus when samples from the injected and control hemispheres were compared (Figure 10A). Immunohistochemical measurements from the other two transgenic rats that received 6E10 injections were only available from the hippocampus, where an average reduction in DAE-labeled plaque density of 14% in the injected vs. non-injected hemispheres (Figure 10B) was seen.
Figure 10.
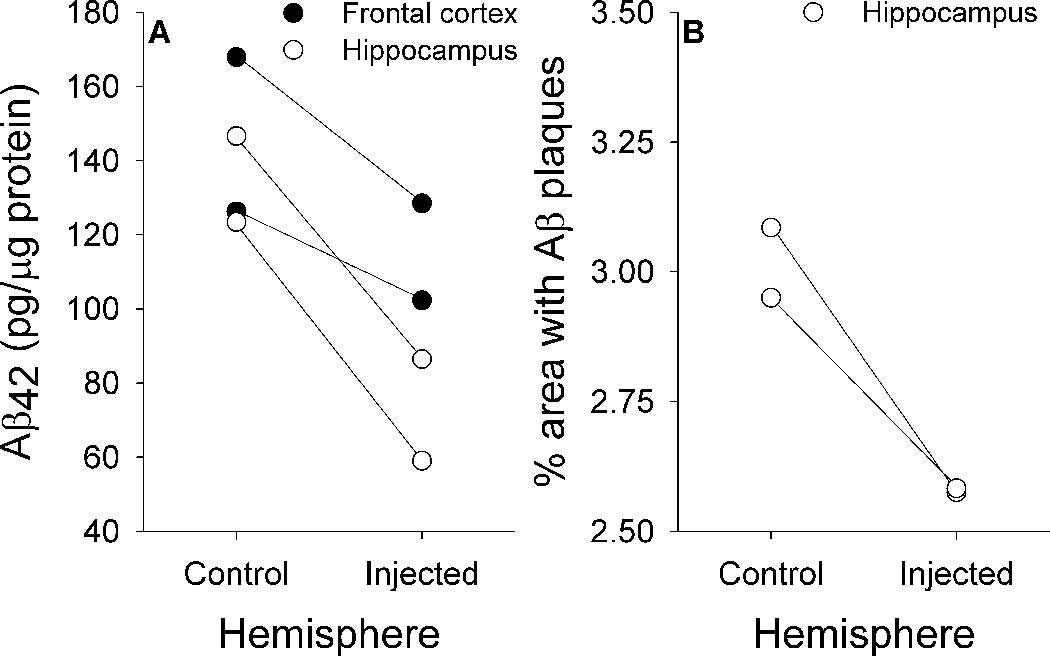
Biochemical (A) and immunohistochemical (B) measures of region-specific reductions in Aβ load after one-time injections of 6E10.
In animals receiving chronic 6E10 infusions, infused antibody largely remained within the vicinity of the micropump catheter tip (Figure 11A), which included the motor and cingulate cortices (Paxinos and Watson, 2005). An average reduction in the density of DAE-labeled Aβ plaques of 51% was seen around the catheter tip in the infused hemispheres relative to the corresponding area in the uninfused hemispheres in 6E10-infused animals but not in vehicle-infused animals (Figure 11B–D). When taken together, these imaging, biochemical, and immunohistochemical results suggest that [F-18]FDDNP has sufficient sensitivity and specificity for in vivo monitoring of treatment-related changes in cerebral Aβ burden.
Figure 11.
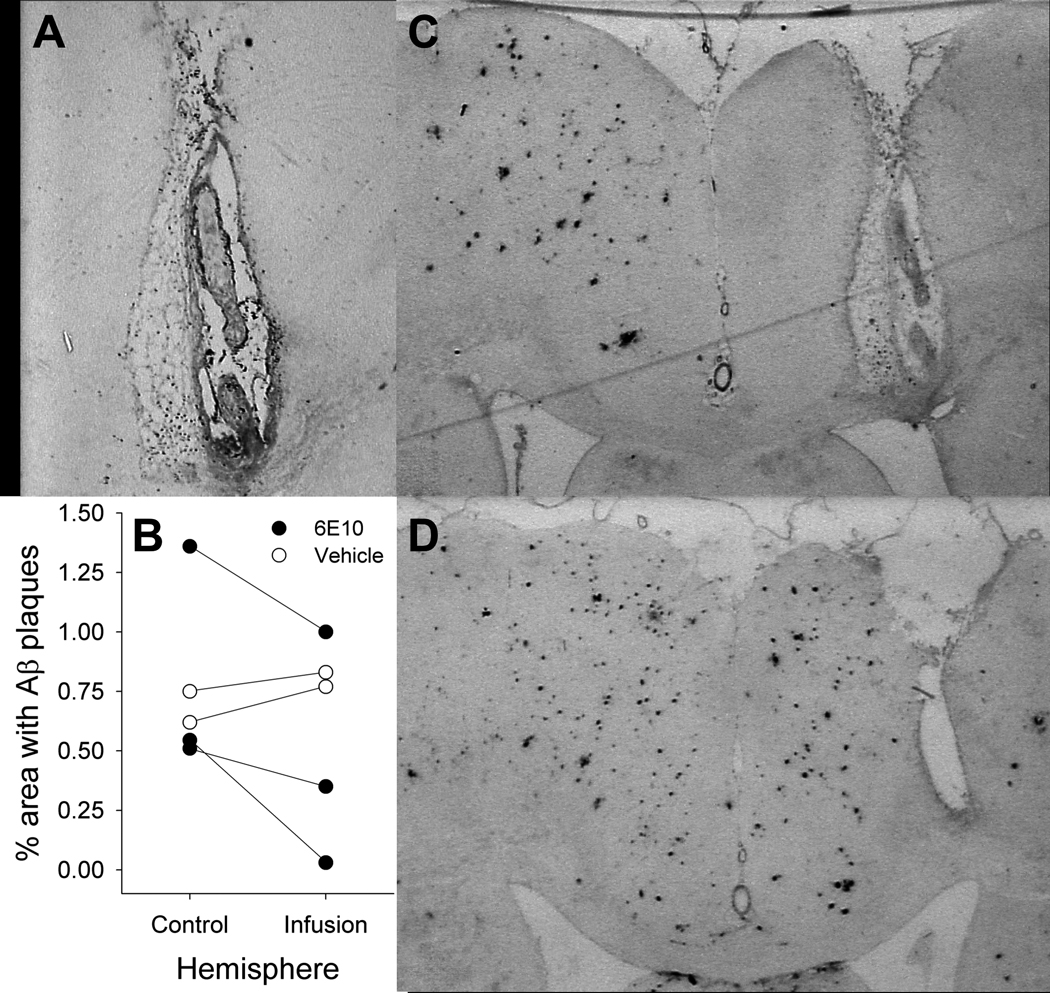
6E10 infusions. Residual 6E10 labeled by anti-mouse IgG antibody (A) is concentrated in the vicinity of an infusion pump tip track. Reductions in Aβ plaque density are seen in with infusions of 6E10, but not vehicle (B). Representative coronal sections stained for DAE from transgenic rats after infusion with 6E10 (C) or vehicle (D).
DISCUSSION
Previous work has demonstrated the capacity of [F-18]FDDNP to bind to Aβ aggregates, Aβ plaques, and neurofibrillary tangles in vitro (Agdeppa et al., 2001; Agdeppa et al., 2003), distinguish AD, MCI, and age-matched control subjects, and detect longitudinal increases in neuropathological burden in individual subjects (Small et al., 2006). Further validation of in vivo [F-18]FDDNP binding to different types of AD neuropathology requires direct comparisons of [F-18]FDDNP signal pattern and intensity with subsequent in vitro assessments of neuropathology. Such opportunities are extremely rare in studies of human patients with pre-symptomatic or early AD, but are far easier to pursue using rodent models of AD neuropathology. Previous microPET experiments in transgenic mouse models of AD have yielded inconsistent findings due in part to their small brain size (Klunk et al., 2005; Kuntner et al., 2009; Maeda et al., 2007; Toyama et al., 2005) and because [C-11]PIB imaging of Aβ is not suitable for rats due to the sulfation of this probe in the brain by estrogen sulfotransferase (Cole et al., 2010; Mathis et al., 2004).
In these experiments, we demonstrate that for [F-18]FDDNP, a transgenic rat model of brain Aβ accumulation (Flood et al., 2009; Liu et al., 2008), with its larger brain size and gradual, progressive age-associated neuropathological changes, appears to be a more suitable model system for microPET imaging than analogous transgenic mouse models. These animals provide opportunities to test the in vivo sensitivity of [F-18]FDDNP for cross-sectional and longitudinal quantification of regional changes in total Aβ load related to aging or therapeutic interventions.
Our cross-sectional and longitudinal results indicate that in vivo [F-18]FDDNP accumulation in transgenic rat brain increases in an age-dependent fashion, paralleling the increasing age-dependent Aβ deposition demonstrated with biochemical and immunohistological techniques in a separate cohort of transgenic animals. Regional elevations in [F-18]FDDNP accumulation were seen by 9–10 months of age with progressive increases until 18 months of age, when both Aβ deposition and [F-18]FDDNP binding plateau. Correlation of cross-sectional analyses of [F-18]FDDNP binding levels and immunohistochemical determinations of Aβ plaque density in the hippocampi of individual animals demonstrated excellent agreement between these independent methods for quantifying Aβ neuropathology. The hypothesis that increases in in vivo [F-18]FDDNP binding are associated with Aβ accumulation rather than aging is further supported by the observation that [F-18]FDDNP signal does not increase with age in wild-type rats. The longitudinal age-associated increases in [F-18]FDDNP accumulation in the transgenic rats are consistent with the ability of [F-18]FDDNP to detect longitudinal changes in AD-related neuropathology in clinical populations (Braskie et al., 2008; Protas et al., 2010; Small et al., 2006).
Both the current experiments and previous work from other groups (Liu et al., 2008) indicate that Aβ accumulation in this transgenic rat model of AD manifests primarily as diffuse, rather than fibrillar plaques. These results are consistent with findings from other transgenic animal models of AD that incorporate both APP and PS-1 mutations (Bussiere et al., 2004). However, there are physical and chemical differences between Aβ plaques found in transgenic animal models of AD and human subjects with AD, which appear to be related to the relative absence of post-translational modifications in the animal models (Kalback et al., 2002; Kuo et al., 2001). The robust age-associated in vivo [F-18]FDDNP binding seen in these animals corroborates prior confocal fluorescence microscopy experiments demonstrating that [F-18]FDDNP labels diffuse as well as fibrillar Aβ plaques (Agdeppa et al., 2001). [F-18]FDDNP binds to different sites on Aβ aggregates than benzothiazole analogues such as [C-11]PIB (Agdeppa et al., 2003), which appear to label fibrillar, but not diffuse Aβ plaques (Bacskai et al., 2007; Cairns et al., 2009; Ikonomovic et al., 2008). However, in vitro findings should be interpreted cautiously, as they are not always an accurate reflection of in vivo labeling. In vitro results are highly dependent of experimental variables (e.g., organic solvents used in assays) that are distinctly different from in vivo conditions. Therefore, the in vivo results presented here provide further insight into [F-18]FDDNP utilization in human subjects.
These neuropathological and imaging results from a transgenic rat model of AD demonstrate that [F-18]FDDNP is a sensitive molecular imaging probe with the capacity for the in vivo quantification of changes in cerebral Aβ neuropathology with disease progression. Furthermore, the magnitude of [F-18]FDDNP signal increases in these animals is comparable to that seen with human AD patients, and can be predictably modeled and quantified (Yaqub et al., 2009). Other amyloid imaging agents such as [C-11]PIB produce larger signal differences between AD and cognitively normal control subjects than [F-18]FDDNP (Tolboom et al., 2010; Tolboom et al., 2009). It has been proposed that the smaller signal magnitude seen with [F-18]FDDNP in human AD patients may be related to its peripheral metabolism to F-18 labeled fragments that could cross the blood-brain barrier and increase non-specific background signal (Luurtsema et al., 2008). However, the ability of [F-18]FDDNP to label diffuse Aβ plaques and tau neurofibrillary tangles, which distinguishes it from [C-11]PIB, is indicative of the sensitivity of [F-18]FDDNP imaging for earlier stages of AD neuropathology, particularly in the medial temporal lobe, where diffuse plaques and neurofibrillary tangles are more prominent.
Blocking experiments conducted with naproxen in 17 month-old transgenic rats demonstrated significant reductions of [F-18]FDDNP SUVR values to levels comparable to those observed in 9–10 month old animals. Although similar in vivo blocking experiments and receptor occupancy determinations are commonly conducted using pharmacologic compounds that compete for binding with receptor-specific molecular imaging probes (Barrio et al., 1989), this work presents the first successful demonstration of in vivo blocking of any putative amyloid imaging probe. Blocking experiments using the same molecule (in vivo or in vitro) cannot be used to validate probe specificity, since all tissue targets will be affected by what is essentially a dilution experiment (Phelps and Barrio, 2010). In contrast, the reversible nature of observed [F-18]FDDNP binding indicates that in vivo probe accumulation arises from specific interactions with Aβ deposits which can be blocked by a structurally unrelated inhibitor, and supports the receptor-like binding of this probe (Barrio et al., 1989; Farde et al., 1985). Naproxen’s ability to block in vivo [F-18]FDDNP binding also supports mechanistic explanations for the preventive effects of non-steroidal anti-inflammatory drugs like naproxen that do not modulate γ-secretase function but may still have the potential for inhibiting Aβ aggregation in vivo (Cole and Frautschy, 2010).
The applicability of [F-18]FDDNP or other potential amyloid imaging probes to human clinical trials depends on successful assessment of specific reductions in cerebral Ap burden (Maeda et al., 2007; Rinne et al., 2010). After intracerebral injections/infusions of anti-Aβ antibody in transgenic rats, [F-18]FDDNP, biochemical, and immunohistochemical Aβ assessments all showed specific regional decreases. Despite the relatively small number of animals used in these experiments, our findings are in accordance with previous reports of intracranial anti-Aβ antibody administration reducing Aβ neuropathology (Maeda et al., 2007; Thakker et al., 2009; Tucker et al., 2008; Wilcock et al., 2003). Our investigations of anti-Aβ antibody treatment response using [F-18]FDDNP further support the concept that longitudinal assessments of AD-related pathology in the living brain with PET imaging probes can serve as biological markers of disease-modifying treatment response in clinical trials of potential AD therapeutics.
In our work, the most robust regional reductions in Aβ pathology were seen with chronic anti-Aβ antibody infusion. These effects were largely limited to the region around the pump cannula tip, where we observed parallel reductions in Aβ deposition and post-treatment [F-18]FDDNP binding in animals treated with anti-Aβ antibody but not in those treated with mouse IgG1 control antibody. One-time unilateral injections of anti-Aβ antibody into the hippocampus and frontal cortex resulted in more modest reductions in Aβ pathology relative to the un-injected hemisphere when assessed via biochemical, immunohistochemical, or [F-18]FDDNP imaging indices. The poorer Aβ plaque clearance seen with one-time injections relative to continuous infusion may be related to the longer interval between initial antibody administration and tissue collection in the injection group relative to the infusion group (12 weeks vs. 7 weeks), and the shorter period of active antibody administration in the injection group. These factors may have resulted in greater post-treatment re-accumulation of Aβ plaques (Oddo et al., 2004; Wilcock et al., 2003) in injected animals. Indeed, [F-18]FDDNP imaging in our animals at 6 weeks post-injection already demonstrates an interval increase in signal relative to imaging at 2 weeks post-injection.
CONCLUSIONS
The data presented here indicate that in vivo [F-18]FDDNP imaging in a transgenic rat model of brain Aβ amyloidosis exhibits sufficient sensitivity for quantitative assessment of age-associated increases in Aβ accumulation, and sufficient specificity to demonstrate reductions in Aβ binding associated with naproxen blockade or intracranial anti-Aβ antibody administration. The combination of this non-invasive imaging method and robust animal model of AD allows for future in vivo longitudinal assessments of potential therapeutic interventions for AD that target Aβ production, aggregation, or clearance. In addition, this work corroborates our previous quantitative analyses of [F-18]FDDNP PET imaging data in human subjects meeting criteria for mild cognitive impairment or AD (Braskie et al., 2008; Protas et al., 2010; Shoghi-Jadid et al., 2002; Small et al., 2006). The sensitivity of [F-18]FDDNP imaging for the detection of Aβ deposits provides a powerful tool for identification of early presymptomatic stages of AD, when therapeutic interventions may have the greatest likelihood of success.
Research Highlights.
[F-18]FDDNP microPET imaging in a transgenic rat model of Alzheimer’s disease
β-amyloid (Aβ) levels correlate with [F-18]FDDNP signal and increase with age
[F-18]FDDNP labels both diffuse and fibrillar Aβ plaques
Naproxen pre-treatment reversibly blocks [F-18]FDDNP binding
Intracranial anti-Aβ antibody delivery decreases Aβ levels and [F-18]FDDNP signal
Supplementary Material
Supplemental Figure 1: DAE labeling of Aβ plaques in a sagittal section from a 14 month-old Tg rat. Plaque deposition is visible in cortical and hippocampal regions, but not in the cerebellum.
Supplemental Figure 2: [F-18]FDDNP time-activity curves in cerebellum, frontal cortex, and hippocampus from (A) 9 month-old wild-type and (B) 16 month-old transgenic rats.
ACKNOWLEDGEMENTS
This research was supported by grants from the National Institute on Aging (P50 AG 16570 [pilot grants to ET, VK], RC1 AG 035878 [to GMC, SAF] K08 AG 34628 [to ET; jointly sponsored by NIA, AFAR, the John A. Hartford Foundation, the Atlantic Philanthropies, the Starr Foundation and an anonymous donor]), National Institutes of Health (P01 AG 025831), VA Merit Review Award Program (to GMC, SAF), the John Douglas French Alzheimer's Foundation, and the Brotman Foundation. The funding sources had no involvement in study design; collection, analysis and interpretation of data; writing of the report; or the decision to submit the report for publication. We would like to thank Gerald Timbol for his management of the animal breeding colony and Waldemar Ladno and Judy Edwards for their assistance with microPET experiments. JRB gratefully acknowledges the support of the Elizabeth and Thomas Chair Endowment in Gerontology. UCLA owns a U.S. patent, "Methods for Labeling Amyloid Plaques and Neurofibrillary Tangles" (6,274,119), that uses the approach outlined in this article and has been licensed to Siemens. GWS, SCH, GMC, NS, and JRB are among the inventors, have received royalties, and will continue to receive royalties on future sales.
Footnotes
Publisher's Disclaimer: This is a PDF file of an unedited manuscript that has been accepted for publication. As a service to our customers we are providing this early version of the manuscript. The manuscript will undergo copyediting, typesetting, and review of the resulting proof before it is published in its final citable form. Please note that during the production process errors may be discovered which could affect the content, and all legal disclaimers that apply to the journal pertain.
REFERENCES
- Agdeppa ED, et al. Binding characteristics of radiofluorinated 6-dialkylamino-2-naphthylethylidene derivatives as positron emission tomography imaging probes for beta-amyloid plaques in Alzheimer's disease. J Neurosci. 2001;21:RC189. doi: 10.1523/JNEUROSCI.21-24-j0004.2001. [DOI] [PMC free article] [PubMed] [Google Scholar]
- Agdeppa ED, et al. In vitro detection of (S)-naproxen and ibuprofen binding to plaques in the Alzheimer's brain using the positron emission tomography molecular imaging probe 2-(1-[6-[(2-[(18)F]fluoroethyl)(methyl)amino]-2-naphthyl]ethylidene)malono nitrile. Neuroscience. 2003;117:723–730. doi: 10.1016/s0306-4522(02)00907-7. [DOI] [PubMed] [Google Scholar]
- Bacskai BJ, et al. Molecular imaging with Pittsburgh Compound B confirmed at autopsy: a case report. Arch Neurol. 2007;64:431–434. doi: 10.1001/archneur.64.3.431. [DOI] [PubMed] [Google Scholar]
- Barrio JR, et al. 3-(2’-[18F]fluoroethyl)spiperone: in vivo biochemical and kinetic characterization in rodents, nonhuman primates, and humans. J Cereb Blood Flow Metab. 1989;9:830–839. doi: 10.1038/jcbfm.1989.117. [DOI] [PubMed] [Google Scholar]
- Braak H, Braak E. Neuropathological stageing of Alzheimer-related changes. Acta Neuropathol. 1991;82:239–259. doi: 10.1007/BF00308809. [DOI] [PubMed] [Google Scholar]
- Braskie MN, et al. Plaque and tangle imaging and cognition in normal aging and Alzheimer's disease. Neurobiol Aging. 2008 doi: 10.1016/j.neurobiolaging.2008.09.012. [DOI] [PMC free article] [PubMed] [Google Scholar]
- Bussiere T, et al. Morphological characterization of Thioflavin-S-positive amyloid plaques in transgenic Alzheimer mice and effect of passive Abeta immunotherapy on their clearance. Am J Pathol. 2004;165:987–995. doi: 10.1016/s0002-9440(10)63360-3. [DOI] [PMC free article] [PubMed] [Google Scholar]
- Cairns NJ, et al. Absence of Pittsburgh compound B detection of cerebral amyloid beta in a patient with clinical, cognitive, and cerebrospinal fluid markers of Alzheimer disease: a case report. Arch Neurol. 2009;66:1557–1562. doi: 10.1001/archneurol.2009.279. [DOI] [PMC free article] [PubMed] [Google Scholar]
- Calon F, et al. Docosahexaenoic acid protects from dendritic pathology in an Alzheimer's disease mouse model. Neuron. 2004;43:633–645. doi: 10.1016/j.neuron.2004.08.013. [DOI] [PMC free article] [PubMed] [Google Scholar]
- Chow PL, et al. Attenuation correction for small animal PET tomographs. Phys Med Biol. 2005;50:1837–1850. doi: 10.1088/0031-9155/50/8/014. [DOI] [PMC free article] [PubMed] [Google Scholar]
- Chow PL, et al. A method of image registration for small animal, multi-modality imaging. Phys Med Biol. 2006;51:379–390. doi: 10.1088/0031-9155/51/2/013. [DOI] [PMC free article] [PubMed] [Google Scholar]
- Cole GB, et al. Specific estrogen sulfotransferase (SULT1E1) substrates and molecular imaging probe candidates. Proc Natl Acad Sci U S A. 2010;107:6222–6227. doi: 10.1073/pnas.0914904107. [DOI] [PMC free article] [PubMed] [Google Scholar]
- Cole GM, Frautschy SA. Mechanisms of Action of Non-Steroidal Anti-Inflammatory Drugs for the Prevention of Alzheimer's Disease. CNS Neurol Disord Drug Targets. 2010;9:140–148. doi: 10.2174/187152710791011991. [DOI] [PMC free article] [PubMed] [Google Scholar]
- Farde L, et al. Substituted benzamides as ligands for visualization of dopamine receptor binding in the human brain by positron emission tomography. Proc Natl Acad Sci U S A. 1985;82:3863–3867. doi: 10.1073/pnas.82.11.3863. [DOI] [PMC free article] [PubMed] [Google Scholar]
- Flood DG, et al. A transgenic rat model of Alzheimer's disease with extracellular Abeta deposition. Neurobiol Aging. 2009;30:1078–1090. doi: 10.1016/j.neurobiolaging.2007.10.006. [DOI] [PubMed] [Google Scholar]
- Ikonomovic MD, et al. Post-mortem correlates of in vivo PiB-PET amyloid imaging in a typical case of Alzheimer's disease. Brain. 2008;131:1630–1645. doi: 10.1093/brain/awn016. [DOI] [PMC free article] [PubMed] [Google Scholar]
- Jack CR, Jr, et al. Serial PIB and MRI in normal, mild cognitive impairment and Alzheimer's disease: implications for sequence of pathological events in Alzheimer's disease. Brain. 2009;132:1355–1365. doi: 10.1093/brain/awp062. [DOI] [PMC free article] [PubMed] [Google Scholar]
- Kalback W, et al. APP transgenic mice Tg2576 accumulate Abeta peptides that are distinct from the chemically modified and insoluble peptides deposited in Alzheimer's disease senile plaques. Biochemistry. 2002;41:922–928. doi: 10.1021/bi015685+. [DOI] [PubMed] [Google Scholar]
- Klunk WE, et al. Imaging brain amyloid in Alzheimer's disease with Pittsburgh Compound-B. Ann Neurol. 2004;55:306–319. doi: 10.1002/ana.20009. [DOI] [PubMed] [Google Scholar]
- Klunk WE, et al. Binding of the positron emission tomography tracer Pittsburgh compound-B reflects the amount of amyloid-beta in Alzheimer's disease brain but not in transgenic mouse brain. J Neurosci. 2005;25:10598–10606. doi: 10.1523/JNEUROSCI.2990-05.2005. [DOI] [PMC free article] [PubMed] [Google Scholar]
- Kuntner C, et al. Limitations of small animal PET imaging with [18F]FDDNP and FDG for quantitative studies in a transgenic mouse model of Alzheimer's disease. Mol Imaging Biol. 2009;11:236–240. doi: 10.1007/s11307-009-0198-z. [DOI] [PubMed] [Google Scholar]
- Kuo YM, et al. Comparative analysis of amyloid-beta chemical structure and amyloid plaque morphology of transgenic mouse and Alzheimer's disease brains. J Biol Chem. 2001;276:12991–12998. doi: 10.1074/jbc.M007859200. [DOI] [PubMed] [Google Scholar]
- Lacan G, et al. Cyclosporine, a P-glycoprotein modulator, increases [18F]MPPF uptake in rat brain and peripheral tissues: microPET and ex vivo studies. Eur J Nucl Med Mol Imaging. 2008;35:2256–2266. doi: 10.1007/s00259-008-0832-z. [DOI] [PubMed] [Google Scholar]
- Lim GP, et al. The curry spice curcumin reduces oxidative damage and amyloid pathology in an Alzheimer transgenic mouse. J Neurosci. 2001;21:8370–8377. doi: 10.1523/JNEUROSCI.21-21-08370.2001. [DOI] [PMC free article] [PubMed] [Google Scholar]
- Lim GP, et al. Ibuprofen suppresses plaque pathology and inflammation in a mouse model for Alzheimer's disease. J Neurosci. 2000;20:5709–5714. doi: 10.1523/JNEUROSCI.20-15-05709.2000. [DOI] [PMC free article] [PubMed] [Google Scholar]
- Liu J, et al. High-yield, automated radiosynthesis of 2-(1-{6-[(2-[18F]fluoroethyl)(methyl)amino]-2-naphthyl}ethylidene)malononi trile ([18F]FDDNP) ready for animal or human administration. Mol Imaging Biol. 2007;9:6–16. doi: 10.1007/s11307-006-0061-4. [DOI] [PubMed] [Google Scholar]
- Liu L, et al. A transgenic rat that develops Alzheimer's disease-like amyloid pathology, deficits in synaptic plasticity and cognitive impairment. Neurobiol Dis. 2008;31:46–57. doi: 10.1016/j.nbd.2008.03.005. [DOI] [PMC free article] [PubMed] [Google Scholar]
- Loening AM, Gambhir SS. AMIDE: a free software tool for multimodality medical image analysis. Mol Imaging. 2003;2:131–137. doi: 10.1162/15353500200303133. [DOI] [PubMed] [Google Scholar]
- Luurtsema G, et al. Peripheral metabolism of [(18)F]FDDNP and cerebral uptake of its labelled metabolites. Nucl Med Biol. 2008;35:869–874. doi: 10.1016/j.nucmedbio.2008.09.002. [DOI] [PubMed] [Google Scholar]
- Maeda J, et al. Longitudinal, quantitative assessment of amyloid, neuroinflammation, and anti-amyloid treatment in a living mouse model of Alzheimer's disease enabled by positron emission tomography. J Neurosci. 2007;27:10957–10968. doi: 10.1523/JNEUROSCI.0673-07.2007. [DOI] [PMC free article] [PubMed] [Google Scholar]
- Mathis CA, et al. Species-dependent metabolism of the amyloid imaging agent [C-11]PIB. J Nucl Med. 2004;45 Suppl:114P. [Google Scholar]
- Oddo S, et al. Abeta immunotherapy leads to clearance of early, but not late, hyperphosphorylated tau aggregates via the proteasome. Neuron. 2004;43:321–332. doi: 10.1016/j.neuron.2004.07.003. [DOI] [PubMed] [Google Scholar]
- Paxinos G, Watson C. The Rat Brain in Stereotaxic Coordinates. San Diego: Academic Press; 2005. [Google Scholar]
- Phelps ME, Barrio JR. Correlation of brain amyloid with "aerobic glycolysis": A question of assumptions? Proc Natl Acad Sci U S A. 2010;107:17459–17460. doi: 10.1073/pnas.1012684107. [DOI] [PMC free article] [PubMed] [Google Scholar]
- Protas HD, et al. FDDNP binding using MR derived cortical surface maps. Neuroimage. 2010;49:240–248. doi: 10.1016/j.neuroimage.2009.08.035. [DOI] [PMC free article] [PubMed] [Google Scholar]
- Rinne JO, et al. 11C–PiB PET assessment of change in fibrillar amyloid-beta load in patients with Alzheimer's disease treated with bapineuzumab: a phase 2, double-blind, placebo-controlled, ascending-dose study. Lancet Neurol. 2010;9:363–372. doi: 10.1016/S1474-4422(10)70043-0. [DOI] [PubMed] [Google Scholar]
- Rowe CC, et al. Imaging of amyloid beta in Alzheimer's disease with 18F-BAY94-9172, a novel PET tracer: proof of mechanism. Lancet Neurol. 2008;7:129–135. doi: 10.1016/S1474-4422(08)70001-2. [DOI] [PubMed] [Google Scholar]
- Rowe CC, et al. Imaging beta-amyloid burden in aging and dementia. Neurology. 2007;68:1718–1725. doi: 10.1212/01.wnl.0000261919.22630.ea. [DOI] [PubMed] [Google Scholar]
- Shoghi-Jadid K, et al. Localization of neurofibrillary tangles and beta-amyloid plaques in the brains of living patients with Alzheimer disease. Am J Geriatr Psychiatry. 2002;10:24–35. [PubMed] [Google Scholar]
- Small GW, et al. PET of brain amyloid and tau in mild cognitive impairment. N Engl J Med. 2006;355:2652–2663. doi: 10.1056/NEJMoa054625. [DOI] [PubMed] [Google Scholar]
- Suckow C, et al. Multimodality rodent imaging chambers for use under barrier conditions with gas anesthesia. Mol Imaging Biol. 2009;11:100–106. doi: 10.1007/s11307-008-0165-0. [DOI] [PMC free article] [PubMed] [Google Scholar]
- Tai YC, et al. Performance evaluation of the microPET focus: a third-generation microPET scanner dedicated to animal imaging. J Nucl Med. 2005;46:455–463. [PubMed] [Google Scholar]
- Thakker DR, et al. Intracerebroventricular amyloid-beta antibodies reduce cerebral amyloid angiopathy and associated micro-hemorrhages in aged Tg2576 mice. Proc Natl Acad Sci U S A. 2009;106:4501–4506. doi: 10.1073/pnas.0813404106. [DOI] [PMC free article] [PubMed] [Google Scholar]
- Thie JA. Understanding the standardized uptake value, its methods, and implications for usage. J Nucl Med. 2004;45:1431–1434. [PubMed] [Google Scholar]
- Toga AW, et al. A 3D digital map of rat brain. Brain Res Bull. 1995;38:77–85. doi: 10.1016/0361-9230(95)00074-o. [DOI] [PubMed] [Google Scholar]
- Tolboom N, et al. Molecular imaging in the diagnosis of Alzheimer's disease: visual assessment of [11C]PIB and [18F]FDDNP PET images. J Neurol Neurosurg Psychiatry. 2010;81:882–884. doi: 10.1136/jnnp.2009.194779. [DOI] [PubMed] [Google Scholar]
- Tolboom N, et al. Detection of Alzheimer pathology in vivo using both 11C–PIB and 18F-FDDNP PET. J Nucl Med. 2009;50:191–197. doi: 10.2967/jnumed.108.056499. [DOI] [PubMed] [Google Scholar]
- Toyama H, et al. PET imaging of brain with the beta-amyloid probe, [11C]6-OH-BTA-1, in a transgenic mouse model of Alzheimer's disease. Eur J Nucl Med Mol Imaging. 2005;32:593–600. doi: 10.1007/s00259-005-1780-5. [DOI] [PubMed] [Google Scholar]
- Tucker SM, et al. Limited clearance of pre-existing amyloid plaques after intracerebral injection of Abeta antibodies in two mouse models of Alzheimer disease. J Neuropathol Exp Neurol. 2008;67:30–40. doi: 10.1097/nen.0b013e31815f38d2. [DOI] [PMC free article] [PubMed] [Google Scholar]
- Vandenberghe R, et al. 18F-flutemetamol amyloid imaging in Alzheimer disease and mild cognitive impairment: a phase 2 trial. Ann Neurol. 2010;68:319–329. doi: 10.1002/ana.22068. [DOI] [PubMed] [Google Scholar]
- Verhoeff NP, et al. In-vivo imaging of Alzheimer disease beta-amyloid with [11C]SB-13 PET. Am J Geriatr Psychiatry. 2004;12:584–595. doi: 10.1176/appi.ajgp.12.6.584. [DOI] [PubMed] [Google Scholar]
- Wilcock DM, et al. Intracranially administered anti-Abeta antibodies reduce beta-amyloid deposition by mechanisms both independent of and associated with microglial activation. J Neurosci. 2003;23:3745–3751. doi: 10.1523/JNEUROSCI.23-09-03745.2003. [DOI] [PMC free article] [PubMed] [Google Scholar]
- Wong DF, et al. In vivo imaging of amyloid deposition in Alzheimer disease using the radioligand 18F-AV-45 (florbetapir [corrected] F 18) J Nucl Med. 2010;51:913–920. doi: 10.2967/jnumed.109.069088. [DOI] [PMC free article] [PubMed] [Google Scholar]
- Yang F, et al. Curcumin inhibits formation of amyloid beta oligomers and fibrils, binds plaques, and reduces amyloid in vivo. J Biol Chem. 2005;280:5892–5901. doi: 10.1074/jbc.M404751200. [DOI] [PubMed] [Google Scholar]
- Yaqub M, et al. Evaluation of tracer kinetic models for analysis of [18F]FDDNP studies. Mol Imaging Biol. 2009;11:322–333. doi: 10.1007/s11307-009-0208-1. [DOI] [PMC free article] [PubMed] [Google Scholar]
Associated Data
This section collects any data citations, data availability statements, or supplementary materials included in this article.
Supplementary Materials
Supplemental Figure 1: DAE labeling of Aβ plaques in a sagittal section from a 14 month-old Tg rat. Plaque deposition is visible in cortical and hippocampal regions, but not in the cerebellum.
Supplemental Figure 2: [F-18]FDDNP time-activity curves in cerebellum, frontal cortex, and hippocampus from (A) 9 month-old wild-type and (B) 16 month-old transgenic rats.


