

Abstract
Chemical footprinting methods are widely used to probe the solution structures of nucleic acids and their complexes. Among the many available modifying reagents, hydroxyl radical is exceptional in its ability to provide nucleotide-level information on the solvent accessibility of the nucleic acid backbone. Until recently, hydroxyl radical footprinting has been limited to in vitro experiments. We describe the use of synchrotron X-radiation to generate hydroxyl radicals within cells for effective footprinting of RNA-protein complexes in vivo. This technique gives results that are consistent with in vitro footprinting experiments, with differences reflecting apparent structural changes to the RNA in vivo.
1. Introduction
Hydroxyl radical footprinting has been utilized for over thirty years in the study of nucleic acids and their interactions (Tullius and Dombroski 1986; Burkhoff and Tullius 1987). Hydroxyl radicals cleave nucleic acids by abstracting a hydrogen atom from the ribose (Hertzberg and Dervan 1984), providing a readout of the solvent accessibility of the nucleic acid backbone (Latham and Cech 1989; Tullius and Greenbaum 2005). While the earliest enzymatic footprinting experiments were designed to determine the sequence specificity of a DNA binding protein (Galas and Schmitz 1978), footprinting techniques have evolved to provide detailed structural insight into nucleic acids and nucleic acid-protein complexes (Revzin 1993). Recent advances in time-resolved hydroxyl radical footprinting and the development of new chemical footprinting reagents have enabled much larger molecular complexes to be analyzed (Wilkinson et al. 2006; Shcherbakova et al. 2008).
Despite the enormous value of in vitro footprinting experiments, questions often remain as to whether the structures observed in the test tube accurately reflect the complexes within living cells. Footprinting nucleic acid complexes in vivo would settle these uncertainties. Some footprinting probes have been used in vivo, but they can have serious limitations. For example, DNase I footprinting has been invaluable for defining DNA-protein contacts in vivo, but the cells require potentially disruptive pre-treatment with ethanol to allow the entry of the nuclease (Cassler et al. 1999). Other reagents, such as dimethylsulfate (DMS) (Climie and Friesen 1988; Mayford and Weisblum 1989; Wells et al. 2000; Waldsich et al. 2002) and kethoxal (Balzer and Wagner 1998), require no permeabilization to probe the structures of nucleic acids in vivo, but have base specificities that limit their resolving power. Additionally, most reagents used in vivo require exposure times of several minutes, limiting their utility in detecting short-lived intermediates.
Synchrotron X-ray-dependent hydroxyl radical footprinting overcomes these limitations. Hydroxyl radicals cleave DNA and RNA equally well with little or no sequence specificity (Sclavi et al. 1997). Their small size and lack of base specificity allow for acquisition of structure information at the single nucleotide level (Tullius and Dombroski 1986; Tullius et al. 1987). In vitro, hydroxyl radicals are most commonly generated through the Udenfriend variation of the Fenton reaction (Udenfriend et al. 1954), where Fe(II)-EDTA reacts with peroxide to create hydroxyl radicals. However, hydroxyl radicals can also be created and used for footprinting reactions through the ionization of intracellular water by X-rays (Hayes et al. 1990; Ottinger and Tullius 2000).
We describe a technique for rapidly footprinting RNA in vivo using a synchrotron X-ray beam. X-rays have been successfully used for the time-resolved footprinting of RNA folding in vitro, with exposure times of 1 to 10 milliseconds (Sclavi et al. 1998). We find that a 100 millisecond exposure to the high flux of a synchrotron X-ray beam is sufficient to probe the structure of intracellular RNAs, without the need to perturb cells with high concentrations of chemical reagents (Adilakshmi et al. 2006). The combined penetrating power of X-rays and the utility of hydroxyl radicals as a structural probe together provide a significant advantage over nuclease or chemical footprinting techniques for probing nucleic acid dynamics inside cells.
2. Beamline setup for in vivo footprinting
Hydroxyl radicals and free electrons are produced by the ionization of water (Klassen 1987).
Any source of ionizing radiation is sufficient to catalyze this reaction. For example, hydroxyl radical generation by exposure to a 137Cs gamma ray source for 15 min was used to footprint lambda repressor–DNA complexes in vivo (Ottinger and Tullius 2000). However, a high flux “white light” synchrotron X-ray beam shortens the necessary exposure times to 100 ms or less. In our experiments, we use beamline X28C at the National Synchrotron Light Source (NSLS). X28C is a bending-magnet beamline administered and operated by the Case Western University Center for Synchrotron Biosciences that is dedicated to the footprinting of nucleic acids and proteins.
For X-ray footprinting experiments, the shape and flux density of the beam are important. The cross-section of the beam must be large enough to irradiate the entire surface area of the sample. However, an unnecessarily diffuse beam reduces flux density, requiring longer exposure times. A beam with a configurable focusing mirror is ideal because these parameters can be varied for individual experiments. The X28C beamline utilizes a cylindrical toroidal mirror to focus the 6 mrad of horizontal radiation it receives from the NSLS X-ray storage ring. When configured to a point focus with a cross-section area of approximately 0.2 mm2, the beam delivers a more than 350-fold increase in flux density as compared to the unfocused beam (Sullivan et al. 2008). This increase in flux density translates to shorter exposure times.
For the purposes of in vivo synchrotron footprinting the narrowest (and most intense) beam that will irradiate the entire surface area of the sample should be used. Although sample heating is also increased at higher flux densities, this is generally offset by the shortened exposure time (Sullivan et al. 2008). Equally important to the quality of the results is that samples are aligned with the most intense region of beam using photodiode mounted behind the sample holder. The output from the diode is used to control the position of the motorized stage supporting the sample holder, via LabView software and a servo-motor controller (Gupta et al. 2007).
For synchrotron footprinting applications, the exposure time must be controlled to within a few milliseconds. The X28C beamline utilizes a Uniblitz XRS6 shutter (Vincent associates, NY) especially designed for X-ray applications, which allows beam extinction >104 up to 30 keV X-ray energy. The shutter can reliably open within 3.2 milliseconds at a maximum rate of 50 exposures per second. The sample holder and the shutter are aligned to the peak of the beam intensity using a precision motorized table (Dhavan et al. 2003).
To minimize thermal damage, cells are kept frozen at −34 to −38ºC during exposure to the beam through a cryo-statted sample holder. This temperature is sufficient to hold the cytoplasm in a frozen state while still permitting the formation of hydroxyl radicals (Mazur 1984). Although we cannot exclude the possibility of local heating during irradiation, no breakdown of the cells is observed upon irradiation. Recently, X28C has been upgraded with a cooled 23-sample holder mounted to a motorized stage that is controlled from outside the experimental hutch, allowing multiple samples to be exposed without re-entering the hutch (Figure 1) (S. Gupta, personal communication).
Figure 1.

Multiple sample holder for irradiation of cell pellets. Block holding 23 samples can be cooled to −38 ºC was custom fabricated for use at beamline X28C. Samples are automatically aligned with the X-ray beam using a photodiode and motorized table. Exposure times are gated by an electronic shutter. Figure courtesy of S. Gupta, Brookhaven National Laboratory.
3. Preparation of Samples
Obtaining high quality, intact RNA is the most critical requirement for the success of synchrotron footprinting experiments. For this reason, the standard precautions for handling RNA must be followed at all times. RNase-free reagents and deionized (18 Mohm) water should be used in the preparation of all samples. Gloves must be worn, and plastic consumables should be used new from the package.
Frozen samples to be irradiated are prepared in advance and shipped to the beamline. Flash-freezing cells before irradiation makes it possible to take ‘snapshots’ of macromolecules in various stages of metabolism, while stabilizing cells against heat damage. Our experiments are performed with E. coli, but the protocol could be adapted to other types of cells as long as suitable methods for RNA isolation and analysis are available.
To prepare samples, inoculate a single bacterial colony into 3–5 mL of appropriate medium and grow overnight at the appropriate temperature. The next day, dilute the culture 1:100 or 1:250 in 50 ml media and grow to OD600 of 0.6–1.0 (mid-log). This should take 2–3 hours. If growth is too slow, reduce the dilution factor. When the culture has reached the desired density, rapidly cool the flask by swirling it vigorously in a dry ice/ethanol bath for 20–30 sec. It is critical that the culture is cooled but not frozen at this stage, as freezing the culture will damage the cells.
Pellet the cells by centrifuging the culture in pre-chilled tubes at 6,000 x g for 5 min at 4ºC. Carefully decant the supernatant, leaving the pellet as dry as possible. Wash the cell pellet with 300- 500 μl TM buffer (10 mM Tris-HCl, pH 7.5 and 1 mM MgCl2). This wash is essential for removing extracellular exonucleases. Resuspend the cell pellet in 300 μl of TM buffer (~6 μl/μg wet cells or 1.5 × 10¹¹ cells/ml).
Dispense 5–10 μL aliquots of the cell suspension into sample tubes suitable for use at your beamline. The sample holder at X28C is designed for use with 0.2 mL BrandTech Thin Wall PCR Tubes with Attached Caps (Fisher catalog # 13-882-58). It is of utmost importance that the suspension be deposited at the very bottom of the tube, and that there are no droplets left clinging to the sides. The tubes cannot be centrifuged in a fixed angle rotor to collect the cell pellet, because the pellet will be displaced to one side and will not be aligned with the beam. A swinging bucket rotor may be used to collect the pellet at the bottom of the tube.
Snap-freeze the pellets in a dry ice/acetone bath (or liquid nitrogen) and store at −80ºC until further use. Inclusion of glycerol or DMSO for stabilizing cells under freezing conditions could be considered, but may increase the exposure times tremendously as these reagents are efficient free radical scavengers. We have also used purified 70S ribosomes (Nierhaus and Dohme 1974), divided into 10 μL aliquots (1 μM) and snap-frozen in a dry ice/acetone bath as controls (Adilakshmi et al. 2006).
Samples must be carefully packaged in a Styrofoam container with dry ice for overnight shipment to the beamline. Some samples should be kept aside for controls against the samples being damaged in shipping—these are "No shipping" controls. It is recommended to package the samples with at least 4 kg of dry ice to ensure they do not thaw en route. Samples that thaw at any time before RNA extraction should be discarded. Alternatively, a liquid nitrogen dry-shipper may be considered for shipping samples.
4. Exposure of cells to X-Ray beam
4.1 Fluorescent assay for calibration of beam intensity
As the condition of the beam can vary from day-to-day, and even within a day as the ring current decreases between injections, it is helpful to begin experiments by gauging the relative beam intensity with a fluorescent assay as described by (Gupta et al. 2007). This is done by generating a dose-response curve using a fluorescent dye, which is photobleached upon exposure to the X-ray beam. The assay is performed with the samples at ambient temperature, before the sample holder has been cooled for use with the frozen cell samples. A 2 μM solution of fluorophore such as Alexa488 is prepared in sample buffer, such as TM (Gupta et al. 2007). Six 5 μL aliquots are placed in 0.2 mL tubes and irradiated for 0, 10, 20, 30, 40 and 50 ms, respectively. The samples are diluted to 1 mL with distilled water and the fluorescence intensity measured with a standard fluorimeter or plate reader. The rate constant obtained by plotting fluorescence against exposure time can be compared against future experiments to ascertain the consistency of the beam over time and to allow the re-evaluation of sample exposure times, if necessary.
4.2 Sample exposure
Following completion of the fluorophore dose response curve the sample holder is cooled to −35ºC in preparation for exposing the frozen cells. Samples are brought to the beamline on dry ice and placed in the area outside the experimental hutch (or in a −80 ºC freezer if convenient). Samples awaiting exposure should not be left in the hutch when the beam is on, as the high level of stray radiation within the hutch can lead to high background levels of cleavage. Some samples should be set aside and kept outside the hutch, as controls against stray radiation. We term these samples "No hutch" controls.
After the sample holder has been completely cooled, samples are uncapped and loaded for exposure. After loading samples the experimenter leaves the hutch, engaging the safety interlock to allow the beam to be activated. The position of the sample holder, the alignment, and the shutter, are operated from outside the hutch through a PC interfaced to the hardware components. This allows the experimenter to rapidly expose 23 samples at a time without re-entering the hutch. To measure the level of background cleavage within the hutch, “mock exposed” samples are placed in the sample holder without opening the shutter. These are "In hutch" controls.
After all samples have been exposed, they should be re-packaged for shipment to the home institution in the same way as they were shipped to the beam-line. Alternatively, if laboratory facilities are available, the RNA can be extracted at the beamline site before shipment to the home institution for analysis. The purified RNA is less sensitive to degradation should samples thaw.
4.3 Determination of optimal exposure times
For reliable footprinting results, each molecule must be cleaved no more than once. This can be achieved by limiting the extent of cleavage of the target RNA or DNA fragment to 10–30% (Hsieh and Brenowitz 1996). Many factors influence the absorption of X-rays by the sample, the production of hydroxyl radicals and the extent of their reaction with the target molecule. Therefore, the X-ray dose needed to achieve the optimal extent of cleavage must be determined empirically for each type of sample (Sclavi et al. 1997).
As described above, free radicals are produced when water molecules within the cell absorb a photon. The radicals can diffuse within the cytoplasm up to ~10 Å before recombining with each other or reacting with another molecule (Dreyer and Dervan 1985). In general, longer exposure times are needed to cleave nucleic acids in cells than in solution. First, the creation of hydroxyl radicals is limited by dehydration of the cell cytoplasm, while their diffusion is limited by molecular crowding (Mazur 1984). Second, the cell interior is filled with free radical scavengers such as cysteine (Roberts et al. 1995). Third, the slower diffusion of free radicals in frozen or supercooled water is expected to reduce the frequency of strand breaks in frozen cells (Huttermann et al. 1992; Ohshima et al. 1996). Despite this, in hydrated DNA at −196ºC most of the radiation damage is attributed to indirect action of hydroxyl radicals rather than the direct absorption of X-rays (Gregoli et al. 1982; Huttermann et al. 1992; Ohshima et al. 1996).
To determine the correct exposure time, a dose-response curve is generated by exposing samples to the X-ray beam for varying times (Figure 2). After extraction of total cellular RNA, the extent of cleavage is determined by extending a molar excess of 5′-32P-labeled primer complementary to the 3′ end of the RNA with reverse transcriptase. By plotting the intensity of the cDNA corresponding to the full-length RNA versus the exposure time, and fitting the data to an exponential equation, the exposure time corresponding to 20% cleavage can be calculated.
Figure 2.
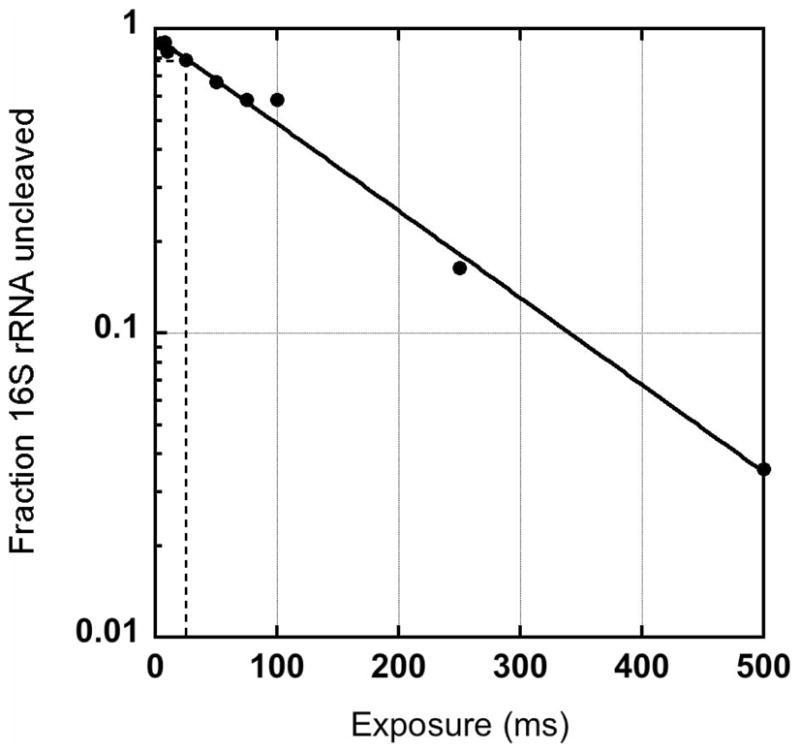
Determining the correct X-ray dose for footprinting. Dose-response curve showing relative fraction of intact 16S rRNA versus time of X-ray exposure of intact, frozen E. coli cells. The optimal dose in this experiment is obtained after 25–50 ms exposure. The relative amount of intact rRNA was determined by primer extension as described in the text.
A good dose response curve will range from exposures that induce very little cleavage to exposures that cleave nearly all of the RNA within the cell. With the current X28C configuration, we find that an exposure range from 8–500 ms is satisfactory for our samples, with an optimal dose of 75 ms for approximately 20% cleavage (Figure 2). Of course, it is not always possible to determine the appropriate exposure time in advance. Since the X28C multi-sample holder allows irradiation of hundreds of samples a day, however, it is possible to expose duplicate samples to the beam for different times, in order to ensure that at least one set of samples will provide RNA suitable for analysis.
5. Isolation of Total RNA from irradiated cells
Structural analysis by hydroxyl radical footprinting requires high quality RNA templates, to reduce background signals from extraneous sources of RNA damage. The current generation of commercial kits specialized for prokaryotic total RNA extraction produce a good yield of high-quality, nick-free RNA from irradiated cell pellets. We have used the Qiagen RNeasy Protect Bacteria Mini Kit and the Ambion RiboPure™-Bacteria Kit with satisfactory results. In our hands the Qiagen RNeasy kit gives superior yields, with a typical recovery of 20 μg of RNA from a 10 μL cell pellet.
5.1 RNA isolation using the TRIzol method
RNA isolation using the TRIzol protocol also yields good-quality RNA suitable for primer extension analysis and can be less costly (Adilakshmi et al. 2006). Add 100 μL TRIzol reagent directly to frozen cells and mix by pipeting until the cell pellet thaws. Repeat the freeze thaw cycle to ensure lysis of the cell wall. Alternatively, the cells can be resuspended in Max Bacterial Enhancement Reagent (Invitrogen) composed of chelating agents, detergent, and a buffer that inactivates endogenous RNases and promotes protein denaturation. This reagent is designed for use with TRIzol Reagent to improve the isolation of intact total RNA from Gram-positive and Gram-negative bacteria.
Following lysis, extract RNA with the addition of 20 μl of chloroform. Collect the aqueous phase by centrifugation at 12,000 g for 15 min at 4ºC. Repeat the extraction of the sample with more TRIzol and chloroform to obtain high quality RNA. Precipitate the RNA by incubating the sample with equal volume of isopropanol at room temperature for 10 min followed by centrifugation at 12000 g for 15 min at 4ºC. Wash the RNA pellet with 70% ethanol and resuspend in 20 μl RNase free water. The quality of the RNA can be analyzed by loading 2 μl of the sample on 1.2% agarose gel prepared in 50 mM Tris-acetate and 1 mM EDTA. Estimate the RNA concentration by measuring its absorbance at 260 nm. Purified RNA can be stored at −80 ºC for several weeks until further use.
5.2 Further considerations on RNA isolation from bacteria
The quality of the total RNA isolated from irradiated cells is critical for the success of in vivo footprinting experiments. If frozen cells are to be used for the experiments, it is essential that they remain completely frozen during the entire process, including shipping. Thawing and refreezing damages the cell membrane, resulting in breakdown of cellular RNA. RNA stabilization reagents such as RNAlater (Ambion) do not interfere with X-ray cleavage. In our hands, such reagents do not significantly improve the quality of the RNA.
Cellular disruption is the most critical step, affecting the yield and quality of the isolated RNA. Slow disruption of the cell membrane, for example by placing cells or tissue in lysis solution without any additional physical shearing, may result in RNA degradation by releasing endogenous RNases before proteins are fully denatured. On the other hand, incomplete disruption of cells decreases the yield of RNA.
One solution is to digest bacterial cell walls with lysozyme to form spheroplasts. Gram positive bacteria usually require more rigorous digestion (increased incubation time, increased incubation temperature) than Gram negative bacteria. The spheroplasts can then be easily lysed with vigorous vortexing or sonication in guanidine isothiocyanate buffer. Resuspend the pellet in 300 μl of 10 mM Tris-HCl, 1 mM EDTA containing lysozyme (freshly prepared). The final concentration of lysozyme should be 3 mg/ml for Gram positive bacteria and 0.4 mg/ml for Gram negative bacteria. Incubate at room temperature 5–10 minutes for Gram positive bacteria and 3–5 minutes for Gram negative bacteria.
6. Primer Extension
Synchrotron footprinting cleavage patterns are analyzed through gene-specific priming of cDNA synthesis by reverse transcriptase. The primer extension terminates at nicks in the RNA template upstream of the primer binding site. Traditionally, primers have been 5′-labeled with 32P to produce labeled cDNA that may be separated by denaturing PAGE and analyzed through autoradiography. Recently, protocols have been established for using fluorophore labeled primers and separating products using capillary gel electrophoresis on the Beckman-Coulter CEQ-8000 (Mitra et al. 2008). The protocol used by our laboratory for the analysis of rRNA with radiolabeled or dye-labeled primers is given below for convenience. This protocol is adapted from similar protocols for RNA structure probing in the literature (Inoue and Cech 1985; Pikielny and Rosbash 1985; Moazed et al. 1986; Merryman et al. 1999).
6.1 Labeling primers
Primers annealing at different regions of the target RNA should be designed such that the entire RNA sequence can be analyzed. For use with traditional PAGE gels, primers should be spaced about every 200 nucleotides along the length of the RNA of interest in order to ensure full coverage.
Primers are either conjugated with a dye (see below) or 5′-[32P]-labeled with T4 polynucleotide kinase according to standard protocols. To ensure adequate specific activity, label 10 pmol primer with 50 μCi gamma-[32P]-ATP (3,000 Ci/mmol) and 5–10 U enzyme for 30 min at 37°C. Inactivate the kinase by incubating the reaction at 65 °C for 10 minutes. Next, dilute samples with 30 μl nuclease free water and remove unincorporated nucleotides using a size-exclusion spin column (eg, TE-10, BD Sciences) as per the manufacturer’s instructions.
6.2 Analysis of cleaved RNA by primer extension
Total RNA (0.25–0.5 μg) is used for primer extension with 5′-labeled primers that anneal to various regions of the rRNA. We recommend the use of Northstar AMV reverse transcriptase (Cape Cod Associates) for the best extensions with minimal pausing. In addition to experimental samples and controls, dideoxy sequencing reactions and a pausing control reaction are performed for each RNA to be analyzed.
Prepare the following buffers:
10X RT-Mg: 500 mM Tris-HCl pH 8.3, 600 mM NaCl, 100 mM DTT
10X RT+Mg: 500 mM Tris-HCl pH 8.3, 600 mM NaCl, 100 mM DTT, 60 mM Mg-acetate
Also prepare:
5X ddNTPs (one for each nucleotide A, C, G, T): 20 μL 5 mM ddNTP, 10 μL 10X RT+Mg, 70 μL nuclease-free H2O
5X dNTPs: 3 μL each 100 mM dATP, dCTP, dGTP, dUTP; 16 μL 10X RT+Mg; 132 μL nuclease-free water
1X RT+Mg: 10 μL 10X RT+Mg, 90 μL nuclease-free water
These reagents and buffers may be prepared in advance and stored at −20 °C for several months.
Next, prepare the following cocktails in the amounts needed to perform the desired number of primer extension reactions.
SL cocktail (for sequencing reactions)
This is the master mix for the 4 sequencing lanes and 1 reverse transcriptase (RT) pausing control lane. Purified native RNA provides the best control for RT pausing, but an in vitro transcript may also be used.
| Unmodified RNA (2 μM) | 2.0 μL |
| Labeled primer | 3.3 μL |
| 10X RT-Mg | 5.0 μL |
| nuclease-free H2O | 33.7 μL |
Primer cocktail
A buffer without Mg2+ is used for the annealing step, because heating RNA in the presence of Mg2+ will lead to degradation due to RNA hydrolysis. Make enough cocktail for the number of RNA samples you have, not including sequencing and pausing control lanes.
| per sample: | |
|---|---|
| Labeled primer | 0.66 μL |
| 10X RT-Mg | 1.0 μL |
| nuclease-free H2O | 5.14 μL |
dNTP cocktail
Make enough cocktail for all your samples plus five for the sequencing and pause lanes.
| per sample: | |
|---|---|
| nuclease-free H2O | 1.2 μL |
| 1X RT+Mg | 2.0 μL |
| 5X dNTP | 1.0 μL |
Primer annealing
Apportion 2μL (0.25–0.5 μg) of total RNA to each reaction tube or well of a 96-well plate, keeping samples on ice. Add 6.8 μL of Primer cocktail to each RNA aliquot. Anneal the primers and RNA by heating the reaction tubes and the SL cocktail to 90ºC for 1 minute, and then return the tubes to ice. For sequencing reactions, put 0.6 μL each 5X ddNTP solution into a separate tube (four total). Transfer 8.8 μL from the SL cocktail to each of the four sequencing tubes. The remaining SL cocktail will serve as the RT pausing control.
Reverse transcriptase
This sensitive enzyme should be diluted into the reaction buffer at the last moment. Dilute enough RT for each sample and the five sequencing tubes.
| per sample: | |
|---|---|
| 10X RT+Mg | 0.1 μL |
| AMV RT (20–30 U/μL) | 0.1μL |
| Nuclease free water | 0.8μL |
Add the diluted RT to the dNTP cocktail tube. Mix gently but thoroughly. Add 5.2 μL dNTP cocktail containing enzyme to all tubes (including sequencing reactions). Immediately incubate at 48ºC for 20–90 minutes, depending on the length of the expected product. Return to ice.
Add 1.5 μL 3 M sodium acetate pH 5.2 and 45 μL 100% ethanol to each reaction, and chill 20 min at −80 ºC or overnight at −20 ºC. Pellet RNA by centrifugation at 12,000 x g for 20–30 min at 4ºC, wash pellet once with 45 μL 70% ethanol (crucial to remove excess salt) and dry briefly under vaccum. If cDNAs are not to be separated immediately, freeze the dry pellets at −20ºC. When you are ready to run the gel, resuspend them in 5–10 μL formamide gel loading buffer (for 10 mL: 9.5 mL deionized formamide, 400 μL 10 X TBE, 50 μL 2% xylene cyanol, 50 μL 2% bromphenol blue; store at −20ºC in 0.5 mL aliquots, avoiding excessive freeze-thaw cycles). Electrophorese heat-denatured samples on an 8% 1X TBE sequencing gel at 55 W according to standard protocols (Figure 3). Gels may be run from 2–4 hours to resolve different portions of the RNA sequence. Dry gels on Whatman 3MM paper. Dried gels are exposed to phosphor storage screens and scanned using an imager.
Figure 3.

X-ray footprinting of ribosomes in intact E. coli. Primer extension of purified 70S ribosomes (A) or rRNA isolated from irradiated cells (B). Exposure times are given at the top of the gel. Radiolabeled primer anneals after nt 560 of the 16S rRNA. Product bands were assigned by comparison with dideoxy sequencing lanes. Redrawn from (Adilakshmi et al. 2006).
6.3 Alterations for capillary gel electrophoresis
We have successfully used this primer extension protocol with fluorophore-labeled primers designed for capillary gel electrophoresis with the Beckman CEQ-8000 Gene Analyzer. Use a 10 μM working stock of the primer labeled with an appropriate fluorophore such as Cy5 or a Beckman WellRED dye. When handling primer stock solutions, avoid bright light that will bleach the fluorophore. A second 70% ethanol wash step following primer extension is recommended to remove excess unincorporated primer.
Unlike 32P-labeled cDNA, fluorophore-labeled cDNA cannot be stored as a dry pellet. Samples should be resuspended in 40 μL Sample Loading Solution (Beckman-Coulter) and separated immediately. If samples must be stored, cover each with a drop of mineral oil to minimize oxidation, then wrap in foil to protect from photobleaching. Protocols for separating products on the CEQ-8000 and analyzing resulting data may be found elsewhere (Mitra et al. 2008).
7. Analysis of X-Ray Footprinting Experiments
We have used two methods for the quantitation of footprinting data in sequencing gels. Most simply, the intensities of electrophoretic bands present on the digital autoradiograms can be determined using the software provided with the scanner, such as ImageQuant (Molecular Dynamics). This method involves manually defining integration areas around individual bands in each lane, which can be time consuming and may introduce inconsistencies. An advantage of this method, however, is that the more compressed bands in the upper half of the gel can still be analyzed.
Semi-Automated Footprinting Analysis software (SAFA) allows for faster and more consistent quantitation of band intensities (Das et al. 2005), but works best on very good quality gels. In our experience, around ninety nucleotides may be integrated using SAFA from a high quality gel. Using either method, band intensities are downloaded into a spreadsheet program such as Microsoft Excel for further analysis and for export to plotting programs. The sequence of each band is identified by comparing the footprinting lanes to sequencing ladders run on the same gel.
It is important to compare exposed samples to No Shipping, No Hutch, and In Hutch controls to determine background rates of cleavage as well as intrinsic reverse transcriptase pause sites. If the background is too high, the source of the problem can be isolated by performing primer extension reactions on RNA transcribed in vitro or on linear plasmid DNA of the same sequence. High quality primer extension reactions on these templates should produce mostly full-length cDNA with only a few pauses at regions of strong secondary structure. Suboptimal cDNA synthesis can result from a poorly designed primer, inhibition of the enzyme by salt or other impurities, inactive enzyme or an inadequate amount of template. If the problem is confined to cellular RNA templates, it can often be resolved by reisolating RNA from a duplicate set of irradiated cells.
8. Results on E. coli RNAs
We have used X-ray footprinting to probe the structure of ribosomal RNA in frozen E. coli cells. The conformation of the 16S rRNA was inferred from the pattern of cleavage intensities (Figure 4). Strongly cleaved residues (relative to background) represent riboses that are exposed to the bulk solvent, while less cleaved or “protected” residues represent riboses that are inaccessible to solvent. At most positions, the hydroxyl radical cleavage rate also correlates well with the predicted solvent accessible surface area of C4′ and C5′ atoms, which were computed from crystallographic coordinates (Wimberly et al. 2000; Schuwirth et al. 2005) using the program Calc-surf (Gerstein, 1992). Deviations from the predicted cleavage pattern can provide insight into the mechanism of assembly in vivo or substrate interactions.
Figure 4.

Solvent accessibility of rRNA by hydroxyl radical footprinting. Sequencing gels in Figure 3 were quantified using a Phosphorimager. In this region of the gel, peaks due to individual nucleotides are well-resolved. Black, 70S ribosomes (in vitro); red, E. coli cells (in vivo). (A) Region from 16S 3′ domain. (B) Region from 16S 5′ domain. Reprinted from (Adilakshmi et al. 2006).
In our experience, the X-ray footprinting pattern of 16S rRNA in frozen E. coli cells agrees well with the footprints of purified 30S ribosomal subunits or 70S ribosomes obtained with Fe(II)-EDTA in vitro (Figures 3, 4), suggesting that the cleavage in vivo is primarily caused by attack of hydroxyl radical on RNA backbone (Adilakshmi et al. 2006). Some base damage is expected due to the reactivity of nucleobases with hydroxyl radicals, which could contribute to the pattern of cDNA synthesis by reverse transcription. In practice, however, such base damage rarely results in cleavage of the phosphodiester backbone (Duplaa and Teoule 1985; Dizdaroglu 1986; Cadet et al. 2004). The lack of sequence bias in the cleavage sites also suggests that the most common base damage events are by-passed by reverse transcriptase, as expected from studies of other DNA polymerases (Wallace 1998).
While our work has primarily focused on rRNA, this technique is also useful for studying other complexes such as RNase P, which is one tenth as abundant as ribosomal subunits during rapid growth (Dong et al. 1996). In vivo protections of residues in P6, P17, P16 and L15 regions of the M1 RNA subunit of E. coli RNase P (Adilakshmi et al. 2006) correlated well with previous hydroxyl radical footprinting data in the presence of pre-tRNA (Westhof et al. 1996; Torres-Larios et al. 2005). We have also been able to footprint the pre-rRNA leader, despite the fact that the immature pre-rRNA is 10 to 100-fold less abundant than the mature rRNA (A.T., unpublished).
9. Future of Footprinting
Because X-rays easily penetrate intact cells and even whole tissues, we expect this method to be applicable to a wide range of biological systems. The relatively short irradiation times and the ability to use frozen cells would enable this method to visualize changes in cell components after viral infection or during the course of development. The range of potential footprinting applications could be increased by the use of electrospray mass spectrometry to footprint proteins (Maleknia et al. 1999) or ligation-mediated PCR to amplify footprinting patterns of single-copy genes or low-abundance mRNAs in eukaryotic cells (Grange et al. 1997). Thus, in vivo X-ray-dependent hydroxyl radical footprinting offers a new approach for obtaining detailed information about the three-dimensional structure of nucleic acids in situ.
Acknowledgments
The authors thank Sayan Gupta, Mike Sullivan and Mark Chance for their valuable assistance with experiments at X28, and Michael Brenowitz for development of footprinting protocols and data analysis. This work was supported by the NIH (GM60819). The Center for Synchtroton Biosciences and beamline X28C are supported by the NIH (P41-EB0001979) and DOE.
References
- Adilakshmi T, Lease RA, Woodson SA. Hydroxyl radical footprinting in vivo: mapping macromolecular structures with synchrotron radiation. Nucleic Acids Res. 2006;34(8):e64. doi: 10.1093/nar/gkl291. [DOI] [PMC free article] [PubMed] [Google Scholar]
- Balzer M, Wagner R. A chemical modification method for the structural analysis of RNA and RNA-protein complexes within living cells. Anal Biochem. 1998;256(2):240–242. doi: 10.1006/abio.1997.2499. [DOI] [PubMed] [Google Scholar]
- Burkhoff AM, Tullius TD. The unusual conformation adopted by the adenine tracts in kinetoplast DNA. Cell. 1987;48(6):935–943. doi: 10.1016/0092-8674(87)90702-1. [DOI] [PubMed] [Google Scholar]
- Cadet J, Bellon S, Douki T, Frelon S, Gasparutto D, Muller E, Pouget JP, Ravanat JL, Romieu A, Sauvaigo S. Radiation-induced DNA damage: formation, measurement, and biochemical features. J Environ Pathol Toxicol Oncol. 2004;23(1):33–43. doi: 10.1615/jenvpathtoxoncol.v23.i1.30. [DOI] [PubMed] [Google Scholar]
- Cassler MR, Grimwade JE, McGarry KC, Mott RT, Leonard AC. Drunken-cell footprints: nuclease treatment of ethanol-permeabilized bacteria reveals an initiation-like nucleoprotein complex in stationary phase replication origins. Nucleic Acids Res. 1999;27(23):4570–4576. doi: 10.1093/nar/27.23.4570. [DOI] [PMC free article] [PubMed] [Google Scholar]
- Climie SC, Friesen JD. In vivo and in vitro structural analysis of the rplJ mRNA leader of Escherichia coli. Protection by bound L10-L7/L12. J Biol Chem. 1988;263(29):15166–15175. [PubMed] [Google Scholar]
- Das R, Laederach A, Pearlman SM, Herschlag D, Altman RB. SAFA: semi-automated footprinting analysis software for high-throughput quantification of nucleic acid footprinting experiments. Rna. 2005;11(3):344–354. doi: 10.1261/rna.7214405. [DOI] [PMC free article] [PubMed] [Google Scholar]
- Dhavan GM, Chance MR, Brenowitz M. Kinetics analysis of DNA–protein interactions by time resolved synchrotron X-ray footprinting. In: Johnson KA, editor. Kinetic Analysis of Macromolecules: A Practical Approach. IRL Press at Oxford University; Oxford: 2003. pp. 75–86. [Google Scholar]
- Dizdaroglu M. Characterization of free radical-induced damage to DNA by the combined use of enzymatic hydrolysis and gas chromatography-mass spectrometry. J Chromatogr. 1986;367(2):357–366. doi: 10.1016/s0021-9673(00)94856-8. [DOI] [PubMed] [Google Scholar]
- Dong H, Kirsebom LA, Nilsson L. Growth rate regulation of 4.5 S RNA and M1 RNA the catalytic subunit of Escherichia coli RNase P. J Mol Biol. 1996;261(3):303–308. doi: 10.1006/jmbi.1996.0461. [DOI] [PubMed] [Google Scholar]
- Dreyer GB, Dervan PB. Sequence-specific cleavage of single-stranded DNA: oligodeoxynucleotide-EDTA X Fe(II) Proc Natl Acad Sci U S A. 1985;82(4):968–972. doi: 10.1073/pnas.82.4.968. [DOI] [PMC free article] [PubMed] [Google Scholar]
- Duplaa AM, Teoule R. Sites of gamma radiation-induced DNA strand breaks after alkali treatment. Int J Radiat Biol Relat Stud Phys Chem Med. 1985;48(1):19–32. doi: 10.1080/09553008514551031. [DOI] [PubMed] [Google Scholar]
- Galas DJ, Schmitz A. DNAse footprinting: a simple method for the detection of protein-DNA binding specificity. Nucleic Acids Res. 1978;5(9):3157–3170. doi: 10.1093/nar/5.9.3157. [DOI] [PMC free article] [PubMed] [Google Scholar]
- Grange T, Bertrand E, Espinas ML, Fromont-Racine M, Rigaud G, Roux J, Pictet R. In vivo footprinting of the interaction of proteins with DNA and RNA. Methods. 1997;11(2):151–163. doi: 10.1006/meth.1996.0401. [DOI] [PubMed] [Google Scholar]
- Gregoli S, Olast M, Bertinchamps A. Radiolytic pathways in gamma-irradiated DNA: influence of chemical and conformational factors. Radiat Res. 1982;89 (2):238–254. [PubMed] [Google Scholar]
- Gupta S, Sullivan M, Toomey J, Kiselar J, Chance MR. The Beamline X28C of the Center for Synchrotron Biosciences: a national resource for biomolecular structure and dynamics experiments using synchrotron footprinting. J Synchrotron Radiat. 2007;14(Pt 3):233–243. doi: 10.1107/S0909049507013118. [DOI] [PubMed] [Google Scholar]
- Hayes JJ, Kam L, Tullius TD. Footprinting protein-DNA complexes with gamma-rays. Methods Enzymol. 1990;186:545–549. doi: 10.1016/0076-6879(90)86148-o. [DOI] [PubMed] [Google Scholar]
- Hertzberg RP, Dervan PB. Cleavage of DNA with methidiumpropyl-EDTA-iron(II): reaction conditions and product analyses. Biochemistry. 1984;23(17):3934–3945. doi: 10.1021/bi00312a022. [DOI] [PubMed] [Google Scholar]
- Hsieh M, Brenowitz M. Quantitative kinetics footprinting of protein-DNA association reactions. Methods Enzymol. 1996;274:478–492. doi: 10.1016/s0076-6879(96)74038-7. [DOI] [PubMed] [Google Scholar]
- Huttermann J, Rohrig M, Kohnlein W. Free radicals from irradiated lyophilized DNA: influence of water of hydration. Int J Radiat Biol. 1992;61(3):299–313. doi: 10.1080/09553009214550981. [DOI] [PubMed] [Google Scholar]
- Inoue T, Cech TR. Secondary structure of the circular form of the Tetrahymena rRNA intervening sequence: a technique for RNA structure analysis using chemical probes and reverse transcriptase. Proc Natl Acad Sci U S A. 1985;82(3):648–652. doi: 10.1073/pnas.82.3.648. [DOI] [PMC free article] [PubMed] [Google Scholar]
- Klassen NV. Primary products in radiation chemistry. In: Farhataziz I, Rodgers MAJ, editors. Radiation chemistry: principles and applications. VCH Publishers; New York: 1987. pp. 29–61. [Google Scholar]
- Latham JA, Cech TR. Defining the inside and outside of a catalytic RNA molecule. Science. 1989;245(4915):276–282. doi: 10.1126/science.2501870. [DOI] [PubMed] [Google Scholar]
- Maleknia SD, Brenowitz M, Chance MR. Millisecond radiolytic modification of peptides by synchrotron X-rays identified by mass spectrometry. Anal Chem. 1999;71(18):3965–3973. doi: 10.1021/ac990500e. [DOI] [PubMed] [Google Scholar]
- Mayford M, Weisblum B. Conformational alterations in the ermC transcript in vivo during induction. EMBO J. 1989;8(13):4307–4314. doi: 10.1002/j.1460-2075.1989.tb08617.x. [DOI] [PMC free article] [PubMed] [Google Scholar]
- Mazur P. Freezing of living cells: mechanisms and implications. Am J Physiol. 1984;247(3 Pt 1):C125–142. doi: 10.1152/ajpcell.1984.247.3.C125. [DOI] [PubMed] [Google Scholar]
- Merryman C, Moazed D, McWhirter J, Noller HF. Nucleotides in 16S rRNA protected by the association of 30S and 50S ribosomal subunits. J Mol Biol. 1999;285(1):97–105. doi: 10.1006/jmbi.1998.2242. [DOI] [PubMed] [Google Scholar]
- Mitra S, Shcherbakova IV, Altman RB, Brenowitz M, Laederach A. High-throughput single-nucleotide structural mapping by capillary automated footprinting analysis. Nucleic Acids Res. 2008;36(11):e63. doi: 10.1093/nar/gkn267. [DOI] [PMC free article] [PubMed] [Google Scholar]
- Moazed D, Stern S, Noller HF. Rapid chemical probing of conformation in 16 S ribosomal RNA and 30 S ribosomal subunits using primer extension. J Mol Biol. 1986;187(3):399–416. doi: 10.1016/0022-2836(86)90441-9. [DOI] [PubMed] [Google Scholar]
- Nierhaus KH, Dohme F. Total reconstitution of functionally active 50S ribosomal subunits from Escherichia coli. Proc Natl Acad Sci U S A. 1974;71(12):4713–4717. doi: 10.1073/pnas.71.12.4713. [DOI] [PMC free article] [PubMed] [Google Scholar]
- Ohshima H, Iida Y, Matsuda A, Kuwabara M. Damage induced by hydroxyl radicals generated in the hydration layer of gamma-irradiated frozen aqueous solution of DNA. J Radiat Res (Tokyo) 1996;37(3):199–207. doi: 10.1269/jrr.37.199. [DOI] [PubMed] [Google Scholar]
- Ottinger LM, Tullius TD. High-Resolution in Vivo Footprinting of a Protein DNA Complex Using γ-Radiation. J Am Chem Soc. 2000;122(24):5901–5902. [Google Scholar]
- Pikielny CW, Rosbash M. mRNA splicing efficiency in yeast and the contribution of nonconserved sequences. Cell. 1985;41(1):119–126. doi: 10.1016/0092-8674(85)90066-2. [DOI] [PubMed] [Google Scholar]
- Revzin A. Footprinting Techniques for Studying Nucleic Acid-Protein Complexes (A Volume of Separation, Detection, and Characterization of Biological Macromolecules) Academic Press; New York: 1993. [Google Scholar]
- Roberts JC, Koch KE, Detrick SR, Warters RL, Lubec G. Thiazolidine prodrugs of cysteamine and cysteine as radioprotective agents. Radiat Res. 1995;143(2):203–213. [PubMed] [Google Scholar]
- Schuwirth BS, Borovinskaya MA, Hau CW, Zhang W, Vila-Sanjurjo A, Holton JM, Cate JH. Structures of the bacterial ribosome at 3.5 A resolution. Science. 2005;310(5749):827–834. doi: 10.1126/science.1117230. [DOI] [PubMed] [Google Scholar]
- Sclavi B, Sullivan M, Chance MR, Brenowitz M, Woodson SA. RNA folding at millisecond intervals by synchrotron hydroxyl radical footprinting. Science. 1998;279(5358):1940–1943. doi: 10.1126/science.279.5358.1940. [DOI] [PubMed] [Google Scholar]
- Sclavi B, Woodson S, Sullivan M, Chance MR, Brenowitz M. Time-resolved synchrotron X-ray "footprinting", a new approach to the study of nucleic acid structure and function: application to protein-DNA interactions and RNA folding. J Mol Biol. 1997;266(1):144–159. doi: 10.1006/jmbi.1996.0775. [DOI] [PubMed] [Google Scholar]
- Shcherbakova I, Mitra S, Beer RH, Brenowitz M. Following molecular transitions with single residue spatial and millisecond time resolution. Methods Cell Biol. 2008;84:589–615. doi: 10.1016/S0091-679X(07)84019-2. [DOI] [PubMed] [Google Scholar]
- Sullivan MR, Rekhi S, Bohon J, Gupta S, Abel D, Toomey J, Chance MR. Installation and testing of a focusing mirror at beamline X28C for high flux x-ray radiolysis of biological macromolecules. Rev Sci Instrum. 2008;79(2 Pt 1):025101. doi: 10.1063/1.2839027. [DOI] [PubMed] [Google Scholar]
- Torres-Larios A, Swinger KK, Krasilnikov AS, Pan T, Mondragon A. Crystal structure of the RNA component of bacterial ribonuclease P. Nature. 2005;437(7058):584–587. doi: 10.1038/nature04074. [DOI] [PubMed] [Google Scholar]
- Tullius TD, Dombroski BA. Hydroxyl radical "footprinting": high-resolution information about DNA-protein contacts and application to lambda repressor and Cro protein. Proc Natl Acad Sci U S A. 1986;83(15):5469–5473. doi: 10.1073/pnas.83.15.5469. [DOI] [PMC free article] [PubMed] [Google Scholar]
- Tullius TD, Dombroski BA, Churchill ME, Kam L. Hydroxyl radical footprinting: a high-resolution method for mapping protein-DNA contacts. Methods Enzymol. 1987;155:537–558. doi: 10.1016/0076-6879(87)55035-2. [DOI] [PubMed] [Google Scholar]
- Tullius TD, Greenbaum JA. Mapping nucleic acid structure by hydroxyl radical cleavage. Curr Opin Chem Biol. 2005;9(2):127–134. doi: 10.1016/j.cbpa.2005.02.009. [DOI] [PubMed] [Google Scholar]
- Udenfriend S, Clark CT, Axelrod J, Brodie BB. Ascorbic acid in aromatic hydroxylation. I. A model system for aromatic hydroxylation. J Biol Chem. 1954;208(2):731–739. [PubMed] [Google Scholar]
- Waldsich C, Grossberger R, Schroeder R. RNA chaperone StpA loosens interactions of the tertiary structure in the td group I intron in vivo. Genes Dev. 2002;16 (17):2300–2312. doi: 10.1101/gad.231302. [DOI] [PMC free article] [PubMed] [Google Scholar]
- Wallace SS. Enzymatic processing of radiation-induced free radical damage in DNA. Radiat Res. 1998;150(5 Suppl):S60–79. [PubMed] [Google Scholar]
- Wells SE, Hughes JM, Igel AH, Ares M., Jr Use of dimethyl sulfate to probe RNA structure in vivo. Methods Enzymol. 2000;318:479–493. doi: 10.1016/s0076-6879(00)18071-1. [DOI] [PubMed] [Google Scholar]
- Westhof E, Wesolowski D, Altman S. Mapping in three dimensions of regions in a catalytic RNA protected from attack by an Fe(II)-EDTA reagent. J Mol Biol. 1996;258(4):600–613. doi: 10.1006/jmbi.1996.0272. [DOI] [PubMed] [Google Scholar]
- Wilkinson KA, Merino EJ, Weeks KM. Selective 2′-hydroxyl acylation analyzed by primer extension (SHAPE): quantitative RNA structure analysis at single nucleotide resolution. Nat Protoc. 2006;1(3):1610–1616. doi: 10.1038/nprot.2006.249. [DOI] [PubMed] [Google Scholar]
- Wimberly BT, Brodersen DE, Clemons WM, Jr, Morgan-Warren RJ, Carter AP, Vonrhein C, Hartsch T, Ramakrishnan V. Structure of the 30S ribosomal subunit. Nature. 2000;407(6802):327–339. doi: 10.1038/35030006. [DOI] [PubMed] [Google Scholar]