

Abstract
Background
Major Depressive Disorder (MDD) has been associated reliably with ruminative responding; this kind of responding is composed of both maladaptive and adaptive components. Levels of activity in the default-mode network (DMN) relative to the task-positive network (TPN), as well as activity in structures that influence DMN and TPN functioning, may represent important neural substrates of maladaptive and adaptive rumination in MDD.
Methods
We used a unique metric to estimate DMN dominance over TPN from blood-oxygen-level dependent data collected during eyes-closed rest in 17 currently depressed and 17 never-disordered adults. We calculated correlations between this metric of DMN dominance over TPN and the depressive, brooding, and reflective subscales of the Ruminative Responses Scale, correcting for associations between these measures both with one another and with severity of depression. Finally, we estimated and compared across groups right fronto-insular cortex (RFIC) response during initiations of ascent in DMN and in TPN activity.
Results
In the MDD participants, increasing levels of DMN dominance were associated with higher levels of maladaptive, depressive rumination and lower levels of adaptive, reflective rumination. Moreover, our RFIC state-change analysis showed increased RFIC activation in the MDD participants at the onset of increases in TPN activity; conversely, healthy control participants exhibited increased RFIC response at the onset of increases in DMN activity.
Conclusions
These findings support a formulation in which the DMN undergirds representation of negative, self-referential information in depression, and the RFIC, when prompted by increased levels of DMN activity, initiates an adaptive engagement of the TPN.
Keywords: Depression, Rumination, Self-reflection, Default-mode network, Task-positive network, Fronto-insular cortex
Introduction
Ruminative responding in Major Depressive Disorder (MDD) is defined as a recurrent, self-reflective, and unintentional focus on depressive symptomatology and its causes and consequences (1, 2). A ruminative response style has been found to predict higher levels of depressive symptoms in depressed individuals (3), perhaps due to disrupted allocation of cognitive resources and increased recall and rehearsal of negative life events (4). While ruminative responding has been shown, in general, to be maladaptive in MDD, recent conceptualizations suggest that depressive rumination is a multidimensional construct with both adaptive and maladaptive components (5, 6). Investigators using correlational and principal components analyses of the Ruminative Responses Scale (RRS; 7), a frequently used self-report measure of rumination, have identified three types of items in this measure: depression-related items (RRS-D; e.g., “How often do you think about how you don’t seem to feel anything anymore?”), items associated with brooding (RRS-B; e.g., “How often do you think ‘Why do I have problems other people don’t have?’”), and items associated with self-reflection (RRS-R; e.g., “How often do you write down what you are thinking and analyze it?”) (8). Treynor and colleagues note that whereas the cognitions represented in the RRS-D and RRS-B subscales are “a passive comparison of one’s current situation with some unachieved standard” (p. 256), items from the RRS-R subscale reflecting opposing processes that entail more agency and adaptive focus, and have been construed as “a purposeful turning inward to engage in cognitive problem solving to alleviate one’s depressive symptoms” (8) (p. 256). Consistent with these interpretations, while depressed persons generally endorse more items from all three RRS subscales than do nondepressed controls, scores on the RRS-R subscale (but not the other subscales) have been found to be associated with lower levels of depressive symptoms at follow-up (8), whereas high scores on the RRS-B (but not on the RRS-R) subscale have been found to be associated with a maladaptive attentional bias to negative stimuli in MDD (9).
Although the neural substrates of adaptive versus maladaptive rumination in depression have not been examined, recent work demonstrating an intrinsic functional organization in the brain suggests an intriguing neural substrate of ruminative responding in MDD. Analyses of resting state and task paradigm BOLD data have revealed macro-scale functional organization in the brain composed of two spatially distinct and anti-correlated networks: the “default-mode” and “task-positive” networks (DMN and TPN, respectively; 10, 11). During performance of attention-demanding tasks, prefrontal and parietal structures comprising the TPN are characterized by increases in activation; in contrast, DMN structures, including posterior cingulate and medial prefrontal cortices, are characterized by decreased activity. During wakeful rest, the opposite pattern emerges, with the DMN becoming more active and the TPN less active (12).
Of particular relevance to the investigation of adaptive and maladaptive rumination in MDD, the DMN has been proposed to undergird passive, self-relational processing (e.g., autobiographical recall, prospection; 13) whereas the TPN has been postulated to subserve active cognitive processing (e.g., executive control, attention, and working memory; 11). Given the evidence cited above that ruminative responding in MDD may involve passive and maladaptive as well as active and adaptive processes, examining the relation of DMN-versus-TPN functioning with ruminative responding in MDD may help to advance neural theory of this disorder. Indeed, a body of research documenting aberrant responding of components of the DMN (14–16) and of the TPN (17, 18) in MDD underscores the importance of examining the interaction of these two systems in this disorder.
Examining responding of the right fronto-insular cortex (RFIC) in the context of assessing DMN-TPN interactions in MDD is important for several reasons. First, recent work implicates this structure in switching between states of relative dominance of the DMN and TPN (19). Moreover, this neural structure has been posited to be involved in awareness of emotion (20) and, more specifically, in interoceptive error detection, that is, in signaling a discrepancy between actual and desired somaticstates (21). Further, increase d insula activation both at resting-state baseline (22) and in response to affective challenge (23) has been reported in MDD, but its role in the pathophysiology of this disorder is not known. To the extent that states of relative TPN and DMN dominance represent desired or undesired somatic states in depression, examining RFIC responding during switching between TPN and DMN dominance should advance our understanding of the role of anomalous insula activation in MDD.
In the present study, we computed relative levels of DMN and TPN activity in depressed and never-disordered persons and examined the associations of DMN-versus-TPN activation (henceforth referred to as DMN dominance) with trait measures of maladaptive and adaptive rumination. Because our metric of DMN dominance, presented below, indexes levels of passive, self-relational thinking relative to effortful cognition, we hypothesized that depressed individuals would show increased DMN dominance, and that increased DMN dominance in MDD would be associated with increased levels of maladaptive rumination and decreased levels of adaptive rumination. In addition, we measured activation in the RFIC during the initiation of states of DMN and of TPN dominance in depressed and nondepressed participants. We hypothesized that depressed persons would recruit the RFIC to a greater extent than would never-disordered individuals at the initiation of states of relative TPN dominance over DMN.
Methods and Materials
Participants
Seventeen adults diagnosed with MDD and 17 control (CTL) participants with no history of any DSM-IV psychiatric disorder participated in this study. All depressed participants met criteria for a DSM-IV diagnosis of MDD based on their responses to the Structured Clinical Interview for DSM (SCID; 24) as administered by trained diagnostic staff; none of the CTL participants met diagnostic criteria for any current or past Axis-I disorder. Depressed individuals taking psychotropic medications at the time of the study or who met criteria for a current, comorbid diagnosis of any Axis-I disorder with the exception of social anxiety disorder were not included in the study; depressed persons with past, but not current, generalized anxiety disorder were included in the study. Participants completed the Beck Depression Inventory-II (BDI-II; 25), the Hamilton Depression Rating Scale (HAM-D; 26) and the Ruminative Responses Scale (RRS; 7). The BDI-II and HAM-D are frequently used and well validated self-report measure of the severity of depressive symptoms. The RRS, described above, is a 22-item, self-report measure of self-focused rumination about depressive mood and its causes and consequences. After a complete description of the study was presented to the participants, written informed consent was obtained.
Procedure
FMRI data acquisition parameters were the same as those from a previous study (27) with the exception that 29 axially prescribed slices of BOLD data were acquired over 180 temporal frames (NFRAMES) using a repetition time (TR) of 2000 ms/frame. Further, 11 of 17 depressed persons and 2 of 17 controls were scanned both in the previous study and in the current study. We present FMRI data preprocessing procedures in Section 1 of the Supplement.
Analyses
Identifying and comparing between groups the DMN and TPN
For each participant, we identified the DMN and TPN using a procedure adapted from Fox and colleagues (11). For details, please see Section 2 of the Supplement. Two binary (one, zero) mask images were created for each participant: one of the DMN and the other of the TPN. To verify the effectiveness of the procedure we used to identify the DMN and TPN, we used these binary masks to create voxel-wise frequency maps depicting for each group the number of subjects for which each voxel belonged to the DMN or the TPN. We then conducted voxel-wise, between-groups chi-square analyses (p = .05, corrected) on these masks to examine regions in which the MDD and CTL groups differed with respect to the spatial extent of DMN or TPN maps so that we could exclude these regions from subsequent analyses.
Operationalizing DMN dominance over TPN
To compute the extent to which levels of DMN activity exceeded TPN activity over the course of the resting scan, we first extracted from each participant’s DMN and TPN masks average, preprocessed, and noise-covariate corrected time-series data (see Section 2, Step 1 in the Supplement for details regarding our noise-covariate correction procedure), excluding those regions in which depressed and control participants differed with respect to the spatial extent of DMN or TPN1. We then constructed an NFRAMES-long vector that was assigned a value of 1 for temporal frames for which DMN BOLD was greater than TPN BOLD and a value of −1 for temporal frames for which TPN BOLD was greater than DMN BOLD. We summed this vector to produce an index of DMN dominance over TPN. This procedure is illustrated in Figure 1A. Finally we compared the DMN dominance measure between groups (p = .05, one-tailed, given a priori prediction of increased DMN dominance in MDD relative to CTL participants). We used this novel, FMRI-based approach, instead of comparing DMN and TPN activity using brain-blood-perfusion scanning methods, because we wanted to identify and compare on a per-subject basis the parts of the TPN and DMN that were most strongly anti-correlated with each other (i.e., that were in the greatest “competition” with each other). Given the respective roles of the DMN and TPN in self-reflection and effortful cognition, identifying and comparing the parts of these networks at greatest apparent odds would seem to have the greatest bearing on understanding opposing ruminative processes indexed by the RRS-D and RRS-R. Note, further, that our approach assumes that increased duration of relative DMN/TPN dominance supports elevated levels of the functions supported by these networks. Supporting this assumption, other studies have found BOLD signal duration to be associated with ruminative tendencies in depressed persons (28) and to distinguish groups at high risk for depression from groups at low risk for depression (29).
Figure 1.

(A) Depiction using actual data of procedure for calculating DMN dominance over TPN. Examples of onset vectors (red) for DMN (B) and TPN (C) in the context of TPN (green) and DMN (blue) time-series data.
Correlating DMN dominance over TPN with rumination
We took a data-driven approach in examining the association between DMN dominance and rumination in depressed and never-disordered persons. Specifically, we determined from the pattern of correlations among the measure of DMN dominance, the three subscales of the RRS, and the BDI-II (see Table 1) which factors we needed to account for in order to determine the associations between unique aspects of the RRS subscales and DMN dominance in each group.
Table 1.
Group-wise correlation matrix of neural and behavioral variables
| TPN Dom | RRS-D | RRS-B | RRS-R | BDI-II | ||
|---|---|---|---|---|---|---|
| TPN Dom | 0.1 | 0.25 | 0.11 | −0.09 | ||
| RRS-D | −0.61 | 0.88 | 0.74 | 0.47 | ||
| RRS-B | −0.24 | 0.39 | 0.63 | 0.48 | CTL | |
| RRS-R | 0.58 | −0.33 | 0.2 | 0.29 | MDD | |
| BDI-II | −0.5 | 0.66 | 0.36 | −0.03 |
Note: Significant (p < .05, one-tailed) effects appear in bold face; marginally significant (.10 > p > .05) effects appear in italics.
First, the correlational data indicate that rumination, as indexed by the RRS, is a unitary construct in the control group (all interscale r > .6; p < .05) but not in the depressed group (all interscale r < .4; p > .05). Consequently, in the control group, but not in the depressed group, we conducted analyses on an aggregate RRS index computed as the mean of the three RRS subscales. Second, the data indicate that in the depressed group there is significant correlation between the RRS-D and BDI-II, a marginally significant correlation between the RRS-D and RRS-B, and a significant correlation between DMN dominance and the BDI-II. Thus, in examining the association between unique features of the RRS-D and DMN dominance in MDD, we first regressed out associations of the RRS-D with the BDI-II and RRS-B, and the association between DMN dominance and the BDI-II. Third, in calculating the correlation between unique features of the RRS-B and DMN dominance in MDD, we factored out marginally significant associations of the RRS-B with the RRS-D and BDI-II, as well as the relation between DMN dominance and the BDI-II. Finally, because there was a marginally significant correlation between the RRS aggregate score and BDI-II in the control group (r = .40; p = .06), we regressed BDI-II effects from the RRS aggregate score before correlating the RRS with DMN dominance in controls.
As an additional precaution, we addressed the potential impact of outlier effects by subjecting significant correlations between appropriately residualized variables to a procedure in which individual cases were iteratively excluded from the correlation calculation; a given correlation was considered significant only if it remained significant at a non-corrected threshold when individual cases were excluded from the calculation. Finally, to keep the possibility of family-wise Type-I error at p < .05, we used the Holm-Bonferroni correction (30) to adjust the significance threshold for the four correlation calculations (DMN dominance with RRS-D, RRS-B, and RRS-R in the depressed group and DMN dominance with RRS in the control group).
State-change analysis of right fronto-insular cortex
We estimated activation in the RFIC, both at initiations of ascent in DMN activity and at initiations of ascent in TPN activity. To do this, we constructed delta-function vectors for each participant corresponding to DMN and to TPN onset, and regressed these vectors against preprocessed time-series data from voxels within the RFIC. The DMN onset vector was a vector of length NFRAMES that was assigned a value of 1 for temporal frames at which there was a trough in the DMN time series (i.e., at the initiation of a subsequent DMN ascent) that corresponded — within ± 2 TRs — to a peak in the TPN time series (i.e., at the initiation of a subsequent TPN descent); we made this correspondence a criterion in order to ensure that ascents in the DMN time series were meaningful in terms of their implications for the DMN-TPN system. The DMN onset vector was assigned a value of 0 for all temporal frames that did not meet both criteria. Similarly, the TPN onset vector was assigned a value of 1 for temporal frames that corresponded to the beginning of TPN ascent and DMN descent, and a value of 0 otherwise. Detection of troughs and peaks in the DMN and TPN time series was performed with a non-derivative-based algorithm (http://billauer.co.il/peakdet.html) implemented in MATLAB (http://www.mathworks.com). Examples of DMN and TPN onset vectors are shown in Figures 1B and 1C, respectively. These onset vectors were convolved with AFNI’s gamma-function model of the hemodynamic response and entered into a voxel-wise regression against preprocessed voxel time-series data from the RFIC. The RFIC region of interest consisted of the Talairach-defined right insula anterior to y = 0 and the part of the right inferior frontal gyrus bounded by the box described by 27 ≤ x ≤ 48, 0 ≤ y ≤ 28, and −19 ≤ z ≤ 15. This regression included the same noise covariates that were used in the regression for identifying the DMN and the TPN. To address in our regression the possibility that the convolved TPN onset function simply aliased the TPN-averaged time series — which could be the case if TPN fluctuations were of the same duration as the hemodynamic response — we also included in the regression the TPN-averaged time series and its first derivative as noise covariates. It was not necessary to include the DMN-averaged time series in this regression because of its high collinearity in all participants with the TPN-averaged time series. The resulting fit coefficients from this regression were entered into a voxel-wise, mixed-model analysis of variance (ANOVA) with one between-subjects factor (Group: MDD, CTL) and one within-subject factor (Network: DMN onset, TPN onset). We examined the interaction of Group and Network in the RFIC (p = .05, corrected) in order to identify voxels that showed differential activity during onset of DMN versus onset of TPN as a function of diagnostic group.
Results
Demographic and clinical variables
Demographic and clinical characteristics of the depressed and nondepressed participants are presented in Table 2; case-by-case demographic and clinical data for participants in the MDD group are presented in Table 3. The two groups of participants did not differ significantly in age, t(32) = 0.84, or gender composition, χ2(32) = 0.0, both p > .10. As expected, the depressed participants had higher scores on the BDI-II, HAM-D, RRS-D, RRS-B, and RRS-R than did the nondepressed participants, ts(32) = 13.53, 13.65, 11.05, 7.01, and 4.31,respectively, all p < .05.
Table 2.
Participant demographic and clinical characteristics
| Control | Depressed | |
|---|---|---|
| Age | 41.94 (2.44) | 45.06 (2.83) |
| Female:Male Ratio | 10:7 | 10:7 |
| RRS - Depression-Related* | 1.38 (0.10) | 3.81 (0.12) |
| RRS - Broodinq* | 1.55 (0.14) | 2.96 (0.14) |
| RRS - Reflection* | 1.56 (0.16) | 2.59 (0.17) |
| Hamilton Depression Rating Scale* | 1.94(.47) | 16.65 (.97) |
| Beck Depression Inventory-II | 2.06 (0.75) | 34.76 (2.30) |
Note:
p < .05; Mean end SE (standard error of the mean) reported where appropriate.
Table 3.
Demographic and clinical characteristics of depressed sample
| Case | Age | Sex | HAM-D | BDI-II | Number of Depressive Episodes | Duration (months) of Current Episode | Comorbidities* |
|---|---|---|---|---|---|---|---|
| 1 | 43 | F | 18 | 39 | 4 | 4 | None |
| 2 | 44 | F | 11 | 36 | 5 | 12 | None |
| 3 | 33 | F | 18 | 33 | 11 | 7 | None |
| 4 | 59 | F | 20 | 42 | U | 54 | Current SAD |
| 5 | 47 | F | 17 | 39 | U | 12 | None |
| 6 | 49 | M | 18 | 29 | 24 | 16 | Current SAD |
| 7 | 50 | F | 21 | 44 | U | 1 | Past GAD |
| 8 | 54 | F | 22 | 46 | U | 12 | Current SAD |
| 9 | 55 | M | 14 | 19 | 2 | 6 | Past GAD |
| 10 | 53 | F | 16 | 34 | U | 4 | Past GAD |
| 11 | 46 | F | 11 | 23 | U | 4 | Current SAD |
| 12 | 33 | M | 14 | 23 | 1 | 180 | Current SAD |
| 13 | 24 | F | 17 | 39 | 1 | 168 | Current SAD |
| 14 | 18 | M | 10 | 36 | U | 1 | None |
| 15 | 51 | M | 13 | 18 | 1 | 244 | None |
| 16 | 58 | M | 19 | 41 | U | 143 | None |
| 17 | 49 | M | 24 | 50 | U | 2 | Current SAD |
Note: GAD = Generalized Anxiety Disorder; SAD = Social Anxiety Disorder; U = Undetermined or too many to correctly recall; Neither dividing the depressed sample according to the presence of a concurrent diagnosis of SAD nor dividing the sample according to the presence of concurrent or past diagnosis of any anxiety disorder yielded a significant effect of anxiety on any of the neural variables measured in this study; all ps > .10.
Spatial extent of DMN and TPN in the depressed and nondepressed groups
Maps summarizing the spatial extent of DMN and TPN in the MDD and CTL groups are presented in Figure 2A. MDD and CTL participants did not differ with respect to the spatial extent of the DMN; however, we observed in the TPN in the MDD group a greater extent of the right fronto-insular cortex (center of mass = 32, 11, −5; k = 54 voxels); see Figure 2B.
Figure 2.
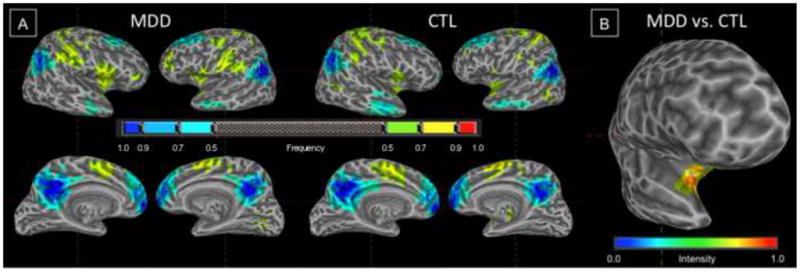
(A) Frequency maps for DMN (cool colors) and TPN (warm colors) derived from regression-defined masks for individuals in MDD and CTL groups. (B) Chi-square statistic map showing increased frequency of inclusion of right fronto-insular cortex in the TPN in the MDD group.
DMN dominance over TPN and its association with rumination
MDD and CTL participants did not differ with respect to dominance of DMN over TPN, t(32) = 1.49, p > .10. In the MDD group, correlating appropriately residualized subscales of the RRS with our measure of DMN dominance indicated that greater DMN dominance was significantly associated with higher RRS-D scores, r(15) = .48, p = .026 (marginally significant, given Holm-Bonferroni criterion of p = .016), and with lower RRS-R scores, r(15) = −.65, p = .002 (less than Holm-Bonferroni criterion of p = .013), see Figure 3. Importantly, both of these correlations remained significant after excluding single cases (see Figure S2 in the Supplement). RRS-B scores were not correlated significantly with level of DMN dominance in the MDD group, r(15) = −.22, p > .10. In the CTL group, the residualized RRS measure was not significantly correlated with DMN dominance, r(15) = .03; p > .10.
Figure 3.
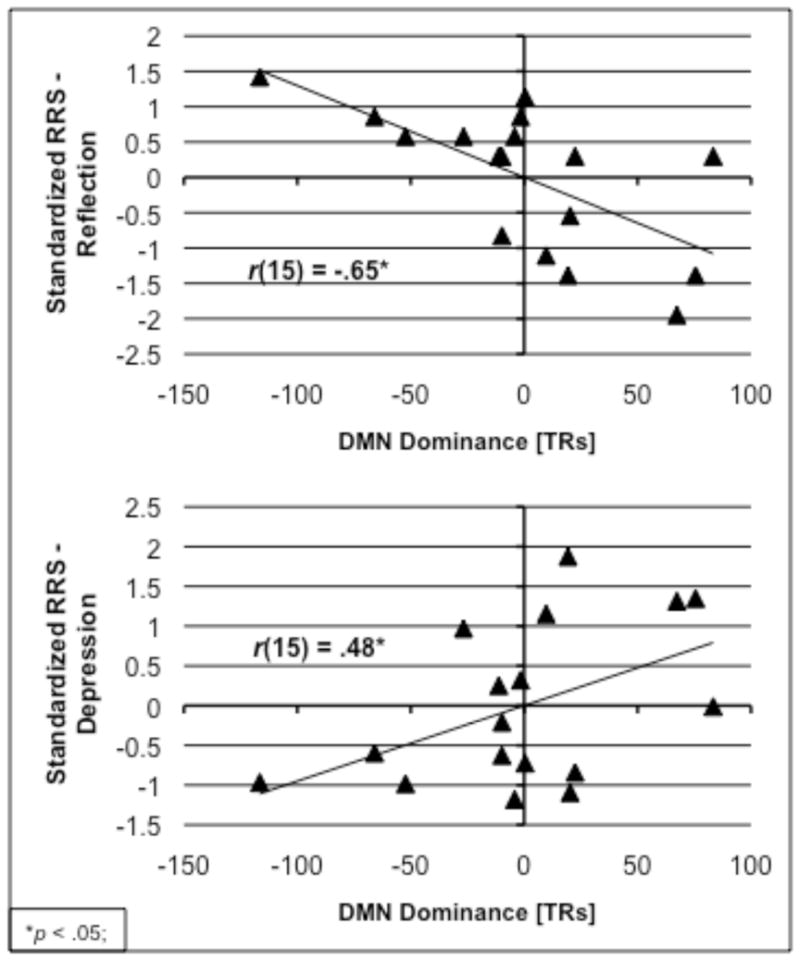
Negative correlation of DMN dominance with RRS-Reflection (top) and positive correlation of DMN dominance with RRS-Depression (bottom) in the MDD group.
State-change analysis of right fronto-insular cortex
The two-way (Group repeated over Network) ANOVA conducted on voxels comprising the RFIC identified a region (center of mass = 40, 21, 6; k = 73 voxels; no overlap was observed between this region and the region identified in the spatial extent analysis) that responded differentially at the onset of increases in DMN and TPN activity as a function of diagnostic group (see Figure 4A for a statistical map of this interaction). As shown in Figure 4B, whereas during the initiation of a rise in TPN activity the RFIC showed increased activation in MDD but not in CTL participants, during the initiation of a rise in DMN activity this region showed increased activation in CTL but not in MDD participants. See Table S1 in the Supplement for results obtained when this same analysis was conducted at the whole-brain level.
Figure 4.
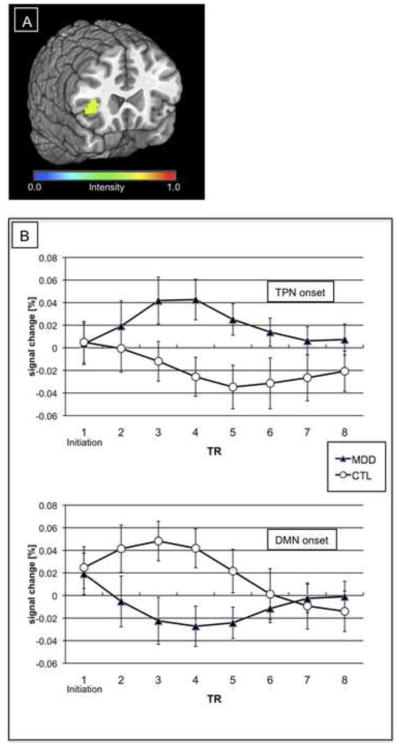
(A) Region in right fronto-insular cortex of significant Network-by-Group interaction. (B) Impulse response functions from region in (A) as a function of Network onset and Group.
Discussion
In the present study we examined the relative dominance of DMN over TPN and its association with adaptive and with maladaptive rumination in major depression. In addition, we examined RFIC responding during initiations of ascent in the DMN and in the TPN in depressed and in never-disordered participants. We found that increasing levels of DMN dominance in depression were associated with higher levels of maladaptive, depressive rumination and lower levels of adaptive, reflective rumination. Further, our RFIC state-change analysis showed that, relative to healthy control participants, depressed participants showed increased RFIC activation at the onset of increases in TPN activity (and decreases in DMN activity); in contrast, healthy control participants exhibited increased RFIC response at the onset of increases in DMN activity (and decreases in TPN activity).
These findings support a formulation in which the neural system composed of the DMN and TPN performs similar operations in depressed and nondepressed persons, but does so on markedly different information. It is important to note that the prediction of maladaptive and adaptive rumination by individual differences in relative levels of DMN and TPN activity in depression is consistent with recent functional characterizations of the DMN and TPN derived from research with nondepressed samples. For example, we found in MDD that greater dominance of DMN — a network that subserves passive, self-relational processes such as recall of autobiographical memories (13) and mind wandering (31) — was associated with higher levels of less effortful, maladaptive, depressive rumination (RRS-D; e.g., “How often do you think about all your shortcomings, failings, faults, mistakes?”). Symmetrically, we also found in MDD that greater dominance of TPN — a network that is active during performance of cognitively demanding tasks that recruit executive control and working memory resources (11) — was associated with higher levels of effortful, reflective processing (RRS-R; e.g., “How often do you analyze your personality to try to understand why you are depressed?”).
Our RFIC state-change analysis showed a double dissociation in RFIC response at the onset of increases in TPN (and decreases in DMN) activity and at the onset of increases in DMN (and decreases in TPN) activity: whereas depressed participants activated the RFIC at TPN troughs (DMN peaks) but not at DMN troughs (TPN peaks), control participants activated RFIC at DMN troughs (TPN peaks) but not at TPN troughs (DMN peaks). Given that the RFIC plays a role in switching between states of relative dominance of DMN and TPN (19) and that its role in interoceptive awareness (20) enables it to detect discrepancies between desired and actual somatic states (21), the present findings also support the hypothesis that the DMN and TPN are operating on different information in depressed and nondepressed individuals. If the RFIC monitors for the presence of undesired bodily states (21) and, as we contend, the DMN supports presumably undesired negative information in MDD, then the RFIC should initiate a DMN-TPN state-change call when a peak in DMN activity occurs, potentially enacting TPN-based affect regulatory mechanisms. Indeed, this is the pattern of results obtained in this study.
It is important to consider that, while our interpretation of our RFIC state-change findings links the literatures concerning the role of the RFIC in both DMN-TPN dominance switching (19) and interoceptive awareness (20), these findings cannot speak to whether the RFIC initiates DMN-TPN state change. Indeed, the present findings are explained equally well by a formulation that, by virtue of its role in interoceptive awareness (20), the RFIC responds to the initiation of TPN dominance in MDD, perhaps reflecting the salience of this switch. The fact that we obtained the opposite pattern of RFIC responding in healthy controls — the RFIC was engaged during TPN peaks (DMN troughs) — is intriguing and may be explained by recent conceptualizations of the DMN as central to positive, creative processes in psychologically healthy persons (32). Thus, in healthy individuals, the RFIC may initiate a call to disengage from more typical analytical processing and engage in more creative DMN-mediated thought. Of course, it is also plausible that, in healthy controls, increased RFIC responding serves simply to mark the onset of DMN dominance.
It is important to note that a primary neural variable used in this study, the metric of DMN dominance over TPN, is novel and involves interpreting relative BOLD signal values that can be influenced by factors not related to neural activity. While the strong positive correlation of our measure of DMN dominance with anterior insula responding during initiations of ascent in DMN activity (see Section 3 in the Supplement: Validation of our metric of DMN dominance) serves as preliminary validation of our metric of DMN dominance, this metric nevertheless requires more direct validation. Additional research examining the relation of our measure of DMN dominance with cross-network comparisons from methods that provide more direct estimates of brain metabolism (e.g., positron emission tomography) is required to strengthen the conclusions that can be drawn about the precise meaning of our metric of DMN dominance.
We should also note that we used trait measures of rumination in this study. Participants were not queried during the resting-state scan about whether they were ruminating or about the content of possible rumination. We took this approach both because rumination is a reliable phenomenon in depression and because we did not want to interfere with either the process of rumination or with TPN-DMN dynamics by probing participants during the resting scan. We note further that, while our findings relating DMN dominance to measures of rumination in MDD are consistent with current conceptions of DMN and TPN function, these findings are nonetheless correlational and, consequently, may be mediated by one or more unmeasured variables.
The present study provides unique insights about the relation between the intrinsic functional organization of the brain and adaptive and maladaptive rumination in depression. The data presented here support a formulation in which the DMN supports representation of negative, self-referential information in depression and, when prompted by increased levels of DMN activity, the RFIC initiates an adaptive engagement of the resources of the TPN. Future work examining the relation between DMN-TPN dynamics and rumination in MDD may benefit from using retrospective questionnaires or experience sampling in order to measure the presence and quality of rumination during scanning.
Supplementary Material
Acknowledgments
Preparation of this manuscript was supported by Grant MH59259 from the National Institute of Mental Health awarded to Ian H. Gotlib and Grant MH79651 from the National Institute of Mental Health and a Young Investigator Award from the National Alliance for Research on Schizophrenia and Depression awarded to J. Paul Hamilton.
Footnotes
As an additional precaution, we calculated the total number of voxels comprising, and the center of mass of, the TPN and DMN for each participant and examined group differences in these indices. The MDD and CTL groups did not differ in the X, Y, and Z extents of the TPN and DMN (all p > .10). The two groups also did not differ with respect to the size of the TPN and DMN (p > .10). In neither the MDD nor the CTL group did the size of the TPN or the DMN correlate with measures of TPN dominance or of rumination (all p > .10).
Financial Disclosures
All authors report biomedical financial interests or potential conflicts of interest.
Contributor Information
J. Paul Hamilton, Department of Psychology, Stanford University
Daniella J. Furman, Department of Psychology, Stanford University
Catie Chang, Department of Radiology, Stanford University
Moriah E. Thomason, Department of Psychology, Stanford University
Emily Dennis, Department of Psychology, Stanford University
Ian H. Gotlib, Department of Psychology, Stanford University
References
- 1.Morrow J, Nolen-Hoeksema S. Effects of responses to depression on the remediation of depressive affect. Journal of Personality and Social Psychology. 1990;58:519–527. doi: 10.1037//0022-3514.58.3.519. [DOI] [PubMed] [Google Scholar]
- 2.Nolenhoeksema S. Responses to depression and their effects on the duration of depressive episodes. Journal of Abnormal Psychology. 1991;100:569–582. doi: 10.1037//0021-843x.100.4.569. [DOI] [PubMed] [Google Scholar]
- 3.Kuehner C, Weber I. Responses to depression in unipolar depressed patients: an investigation of Nolen-Hoeksema’s response styles theory. Psychological Medicine. 1999;29:1323–1333. doi: 10.1017/s0033291799001282. [DOI] [PubMed] [Google Scholar]
- 4.Nolan SA, Roberts JE, Gotlib IH. Neuroticism and ruminative response style as predictors of change in depressive symptomatology. Cognitive Therapy and Research. 1998;22:445–455. [Google Scholar]
- 5.Trapnell PD, Campbell JD. Private self-consciousness and the five-factor model of personality: Distinguishing rumination from reflection. Journal of Personality and Social Psychology. 1999;76:284–304. doi: 10.1037//0022-3514.76.2.284. [DOI] [PubMed] [Google Scholar]
- 6.Watkins E, Teasdale JD. Adaptive and maladaptive self-focus in depression. Journal of Affective Disorders. 2004;82:1–8. doi: 10.1016/j.jad.2003.10.006. [DOI] [PubMed] [Google Scholar]
- 7.Nolen-Hoeksema S, Morrow J, Fredrickson BL. Response styles and the duration of episodes of depressed mood. Journal of Abnormal Psychology. 1993;102:20–28. doi: 10.1037//0021-843x.102.1.20. [DOI] [PubMed] [Google Scholar]
- 8.Treynor W, Gonzalez R, Nolen-Hoeksema S. Rumination reconsidered: A psychometric analysis. Cognitive Therapy and Research. 2003;27:247–259. [Google Scholar]
- 9.Joormann J, Dkane M, Gotlib IH. Adaptive and maladaptive components of rumination? Diagnostic specificity and relation to depressive biases. Behavior Therapy. 2006;37:269–280. doi: 10.1016/j.beth.2006.01.002. [DOI] [PubMed] [Google Scholar]
- 10.Corbetta M, Kincade JM, Shulman GL. Neural systems for visual orienting and their relationships to spatial working memory. Journal of Cognitive Neuroscience. 2002;14:508–523. doi: 10.1162/089892902317362029. [DOI] [PubMed] [Google Scholar]
- 11.Fox MD, Snyder AZ, Vincent JL, Corbetta M, Van Essen DC, Raichle ME. The human brain is intrinsically organized into dynamic, anticorrelated functional networks. Proceedings of the National Academy of Sciences of the United States of America. 2005;102:9673–9678. doi: 10.1073/pnas.0504136102. [DOI] [PMC free article] [PubMed] [Google Scholar]
- 12.Raichle ME, MacLeod AM, Snyder AZ, Powers WJ, Gusnard DA, Shulman GL. A default mode of brain function. Proceedings of the National Academy of Sciences of the United States of America. 2001;98:676–682. doi: 10.1073/pnas.98.2.676. [DOI] [PMC free article] [PubMed] [Google Scholar]
- 13.Spreng RN, Mar RA, Kim ASN. The common neural basis of autobiographical memory, prospection, navigation, theory of mind, and the default mode: a quantitative meta-analysis. J Cogn Neurosci. 2009;21:489–510. doi: 10.1162/jocn.2008.21029. [DOI] [PubMed] [Google Scholar]
- 14.Sheline YI, Barch DM, Price JL, Rundle MM, Vaishnavi SN, Snyder AZ, et al. The default mode network and self-referential processes in depression. Proceedings of the National Academy of Sciences of the United States of America. 2009;106:1942–1947. doi: 10.1073/pnas.0812686106. [DOI] [PMC free article] [PubMed] [Google Scholar]
- 15.Drevets WC, Price JL, Furey ML. Brain structural and functional abnormalities in mood disorders: implications for neurocircuitry models of depression. Brain Structure & Function. 2008;213:93–118. doi: 10.1007/s00429-008-0189-x. [DOI] [PMC free article] [PubMed] [Google Scholar]
- 16.Grimm S, Boesiger P, Beck J, Schuepbach D, Bermpohl F, Walter M, et al. Altered Negative BOLD Responses in the Default-Mode Network during Emotion Processing in Depressed Subjects. Neuropsychopharmacology. 2009;34:932–943. doi: 10.1038/npp.2008.81. [DOI] [PubMed] [Google Scholar]
- 17.Siegle GJ, Thompson W, Carter CS, Steinhauer SR, Thase ME. Increased amygdala and decreased dorsolateral prefrontal BOLD responses in unipolar depression: Related and independent features. Biological Psychiatry. 2007;61:198–209. doi: 10.1016/j.biopsych.2006.05.048. [DOI] [PubMed] [Google Scholar]
- 18.Mayberg HS, Liotti M, Brannan SK, McGinnis S, Mahurin RK, Jerabek PA, et al. Reciprocal limbic-cortical function and negative mood: Converging PET findings in depression and normal sadness. American Journal of Psychiatry. 1999;156:675–682. doi: 10.1176/ajp.156.5.675. [DOI] [PubMed] [Google Scholar]
- 19.Sridharan D, Levitin DJ, Menon V. A critical role for the right fronto-insular cortex in switching between central-executive and default-mode networks. Proceedings of the National Academy of Sciences of the United States of America. 2008;105:12569–12574. doi: 10.1073/pnas.0800005105. [DOI] [PMC free article] [PubMed] [Google Scholar]
- 20.Craig AD. How do you feel - now? The anterior insula and human awareness. Nature Reviews Neuroscience. 2009;10:59–70. doi: 10.1038/nrn2555. [DOI] [PubMed] [Google Scholar]
- 21.Paulus MP, Stein MB. An insular view of anxiety. Biological Psychiatry. 2006;60:383–387. doi: 10.1016/j.biopsych.2006.03.042. [DOI] [PubMed] [Google Scholar]
- 22.Mayberg HS, Lozano AM, Voon V, McNeely HE, Seminowicz D, Hamani C, et al. Deep brain stimulation for treatment-resistant depression. Neuron. 2005;45:651–660. doi: 10.1016/j.neuron.2005.02.014. [DOI] [PubMed] [Google Scholar]
- 23.Fu CHY, Williams SCR, Cleare AJ, Brammer MJ, Walsh ND, Kim J, et al. Attenuation of the neural response to sad faces in major depression by antidepressant treatment - A prospective, event-related functional magnetic resonance imaging study. Archives of General Psychiatry. 2004;61:877–889. doi: 10.1001/archpsyc.61.9.877. [DOI] [PubMed] [Google Scholar]
- 24.First MB, Spitzer RL, Gibbon M, Williams JBW. The Structured Clinical Interview for DSM-III-R Personality-Disorders (SCID-I) Journal of Personality Disorders. 1995;9:83–91. [Google Scholar]
- 25.Beck AT, Rush AJ, Shaw BF, Emery G. Cognitive therapy of depression. New York: The Guilford Press; 1979. [Google Scholar]
- 26.Hamilton M. A rating scale for depression. Journal of Neurology Neurosurgery and Psychiatry. 1960;23:56–62. doi: 10.1136/jnnp.23.1.56. [DOI] [PMC free article] [PubMed] [Google Scholar]
- 27.Hamilton JP, Chen G, Thomason ME, Johnson RF, Gotlib IH. Investigating neural primacy in Major Depressive Disorder: Multivariate granger causality analysis of resting-state fMRI time-series data. Molecular Psychiatry. doi: 10.1038/mp.2010.46. (in press) [DOI] [PMC free article] [PubMed] [Google Scholar]
- 28.Siegle GJ, Steinhauer SR, Thase ME, Stenger VA, Carter CS. Can’t shake that feeling: Assessment of sustained event-related fMRI amygdala activity in response to emotional information in depressed individuals. Biological Psychiatry. 2002;51:693–707. doi: 10.1016/s0006-3223(02)01314-8. [DOI] [PubMed] [Google Scholar]
- 29.Furman DJ, Hamilton JP, Joormann J, Gotlib IH. Altered timing of amygdala activation during sad mood elaboration as a function of 5-HTTLPR. Social Cognitive and Affective Neuroscience. doi: 10.1093/scan/nsq029. [DOI] [PMC free article] [PubMed] [Google Scholar]
- 30.Holm S. A simple sequentially rejective multiple test procedure. Scandinavian Journal of Statistics. 1979;6:65–70. [Google Scholar]
- 31.Christoff K, Gordon AM, Smallwood J, Smith R, Schooler JW. Experience sampling during fMRI reveals default network and executive system contributions to mind wandering. Proceedings of the National Academy of Sciences of the United States of America. 2009;106:8719–8724. doi: 10.1073/pnas.0900234106. [DOI] [PMC free article] [PubMed] [Google Scholar]
- 32.Christoff K, Gordon A, Smith R. The role of spontaneous thought in human cognition. In: Vartanian O, Mandel DR, editors. Neuroscience of Decision Making. London: Psychology Press; (in press) [Google Scholar]
Associated Data
This section collects any data citations, data availability statements, or supplementary materials included in this article.