Abstract
A phosphorescent sensor based on a multichromophoric iridium(III) complex was synthesized and characterized. The construct exhibits concomitant changes in its phosphorescence intensity ratio and phosphorescence lifetime in response to copper(II) ion. The sensor, which is reversible and selective, is able to quantify copper(II) ions in aqueous media and it detects intracellular copper ratiometrically.
Understanding the biological and environmental roles of copper(II) ion requires robust and versatile methods for quantification.1–3 This task is challenging because fast electron and energy transfer involving paramagnetic copper centers results in strong fluorescence quenching for most luminescent sensors.4 The goal has been to devise “turn-on” fluorescent sensors for copper(II), selected strategies for which include opening of a spirolactam,5–7 suppression of non-emissive electronic transitions of a conjugated imine,8,9 excimer formation,10,11 photolysis of a copper(II) ionophore,12 and a displacement assay in a catalytic system for generating a fluorescent indicator.13 These turn-on signals are insufficient for quantification, however. An alternative approach involves sensors that display a change in the ratio of multiple emission bands, providing quantification as a significant advantage.14–16 Few ratiometric fluorescent copper sensors are available,17–19 however, and those that do exist suffer from limited versatility, including instability in a polar medium, long response time, and irreversibility.
A promising approach for ratiometric Cu(II) sensing is a platform that provides dual wavelength emission following single wavelength excitation. This effect is in apparent violation of Kasha’s rule, which dictates single emission from the lowest excited state.20 The known exceptions involve phosphorescent transition metal complexes, such as heteroleptic Ru(II) 21–24 and Re(I)25–28 complexes, in which limited internal conversion between two metal-to-ligand charge transfer (MLCT) transition states accounts for the dual emission. We previously identified multichromophoric centers of phosphorescent heteroleptic Ir(III) complexes. Here, internal conversion depends strongly on ligand structure,29–31 and dual emission occurs for both cationic32 and charge-neutral33 Ir(III) complexes. Encouraged by these observations, we sought to develop a phosphorescence ratiometric sensor based on an Ir(III) construct. Phosphorescent Ir(III) complexes are appealing platforms because they exhibit highly efficient room temperature phosphorescence. In addition, their long lifetime emission (typically several μs) is unaffected by short-lived background noise such as fluorescence and scattered light. As for ratiometric detection, changes in luminescence lifetime are determined solely by the concentration of the analyte of interest.34–36 A combination of phosphorescence ratiometric signals and phosphorescence lifetime therefore offers a powerful tool for quantification of copper(II) ion.
In the present work we prepared a ratiometric copper(II) sensor (ZIr2) based on a multichromophoric Ir(III) complex having one 2-(2′-benzo[b]thienyl)pyridinato (btp) and two cyclometalating 2-phenylpyridinato (ppy) ligands.33 A di(2-picolyl)amine (DPA) copper ion receptor was tethered to the btp ligand by a methylene linker. Dual phosphorescence, green from the ppy ligands and red from the btp ligand, occurs in the absence of copper(II) ion, but copper complexation to the DPA moiety preferentially quenches red emission from the adjacent btp ligand (see photo in Supporting Information (SI), Figure S1). Thus, a ratiometric signal is obtained by dual emission, with green and red bands corresponding to the reference and probe signals, respectively. In addition, a decrease in phosphorescence lifetime of the red emission can be used to validate the copper-induced change.
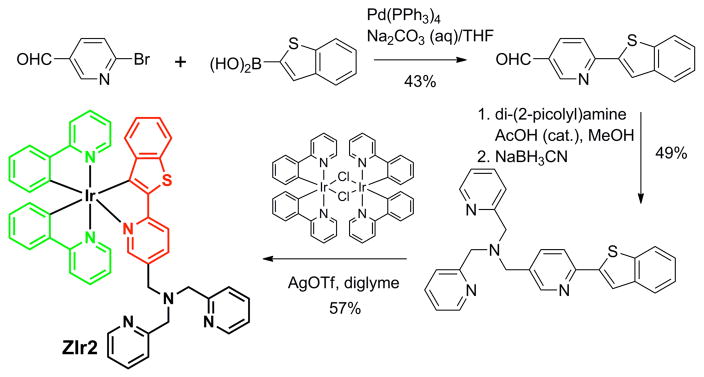
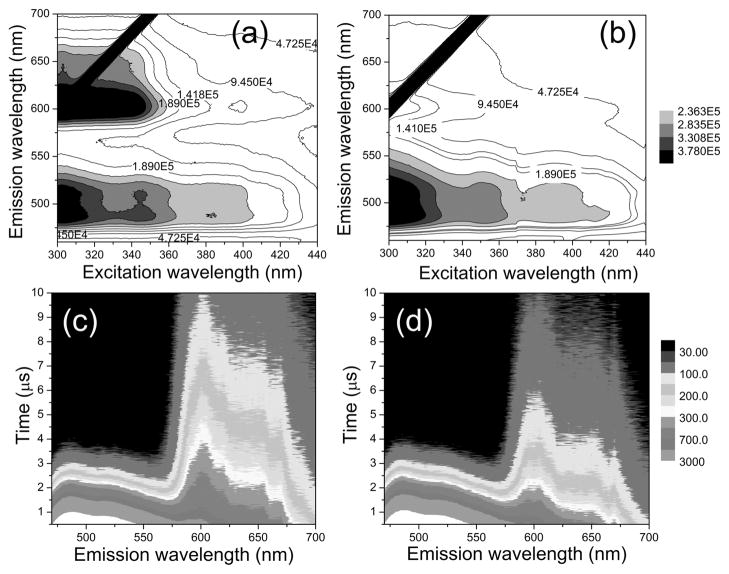
The iridium(III) complex (ZIr2) was prepared in four steps with an overall yield of 9% (Scheme 1) and fully characterized by a variety of spectroscopic methods (SI). A reference iridium(III) complex without the DPA appendage was also prepared for comparison. The phosphorescence behavior of ZIr2 was characterized in pH 7.0 buffer (25 mM PIPES containing <2 vol % of DMSO, air-equilibrated) at 25 °C. The phosphorescence quantum yield of an air-equilibrated buffer of ZIr2 was determined to be 3.0% relative to fluorescein as a standard. The steady-state phosphorescence spectra are characterized by an apparent dual emission in the green (470–570 nm, Ippy) and red (580–700 nm, Ibtp) regions emanating from the ppy and btp ligands, respectively (Figure 1a). Addition of CuCl2 (1 equiv) to the ZIr2 solution predominantly quenched the red emission, effecting a change in the ratio of green to red phosphorescence emission intensity (Figure 1b and SI, Figure S3). The increase in phosphorescence intensity ratio (Ippy/Ibtp) was ca. fourfold.
Scheme 1.
Synthesis and Structure of the Copper(II) Sensor ZIr2
Figure 1.
Steady-state phosphorescence spectrum of ZIr2 in the absence (a) and presence (b) of CuCl2. Time-resolved phosphorescence spectrum of ZIr2 in the absence (c) and presence (d) of CuCl2 (λex = 342 nm). Conditions: 10 μM ZIr2 for steady-state spectra and 20 μM ZIr2 for time-resolved spectra in pH 7.0 buffer (25 mM PIPES containing <2 vol % of DMSO). Black diagonal lines in (a) and (b) are harmonics of the excitation beam.
A time-resolved emission spectrum (TRES) of the ZIr2 solution was acquired with excitation at 342 nm (Figure 1c), revealing a short-lived green (Ippy) and a relatively long-lived red (Ibtp) emission that decays more rapidly in the presence of CuCl2 (Figure 1d). The dual emission decay traces were monitored at 486 and 648 nm, corresponding to the green and red phosphorescence, respectively. The phosphorescence trace at 486 nm was fit to a single exponential decay with a lifetime of 0.53 μs that was unaltered upon addition of CuCl2 (SI, Figure S4). In contrast, the 648 nm emission lifetime decreased significantly in the presence of copper(II) ions (SI, Figure S5). The best fits for the 648 nm trace were obtained when multiexponential decay models were applied, which most likely reflects reversible or partial internal conversion from and to the green-phosphorescent ppy ligands. This result is similar to that obtained for dual-emissive Ru(II) complexes.24 A photophysical scheme that identifies the btp ligand as being responsible for the red phosphorescence emission was derived from quantum chemical calculations based on time-dependent density functional theory (TD-DFT, B3LYP/6-31G**:LANL2DZ; see SI, Table S1). Selective quenching of the red phosphorescence arises from the proximity of the btp ligand to the paramagnetic copper(II) center. The notable decrease in phosphorescence lifetime of ZIr2 is ascribed to facile energy or electron transfer. We rule out the latter because the phosphorescence intensity ratio (Ippy/Ibtp) was not restored to that of apo form as the temperature was lowered (SI, Figure S6). An average phosphorescence lifetime (τavg) of the 648 nm decay trace was calculated by using (i = 1–3)37 with preexponential coefficients (αi) and time constants (τi) obtained by a triple exponential decay model, giving 4.16±0.21 μs and 2.47±0.41 μs for the apo and the copper complexed forms of ZIr2, respectively.
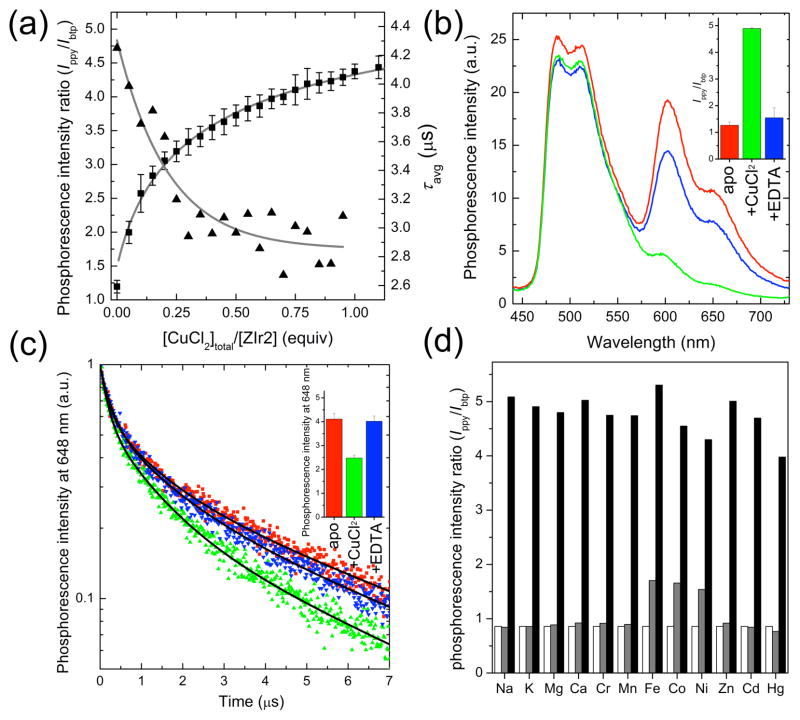
A phosphorescence Job’s plot revealed a 1:2 stoichiometry for CuCl2 and the DPA receptor38–40 of ZIr2 (SI, Figure S7). X-band CW EPR studies of CuCl2 solutions containing various amount of ZIr2 further confirmed this stoichiometry of copper(II) complexation (SI, Figure S8). In addition, the phosphorescence spectrum of a reference Ir(III) complex lacking a DPA arm showed no copper-dependence, indicating that the observed phosphorescence changes are due to DPA-copper ion binding (SI, Figure S9). A binding titration isotherm plotting the phosphorescence intensity ratio (Ippy/Ibtp) against increasing concentrations of CuCl2 (Figure 2a) was fit to a theoretical model based on the calculated concentration of free copper(II) ion, which returned a Kd value of 16 μM (refer to SI for details). Similarly, τavg decreased with increasing CuCl2 concentrations, leveling off at 1:2 binding (Figure 2a). This result is consistent with the Job’s plot and X-band CW EPR titration measurements.
Figure 2.
(a) Phosphorescence titration (squares for phosphorescence intensity ratio (Ippy/Ibtp) and triangles for average phosphorescence lifetime (τavg) of ZIr2 with the addition of CuCl2. See Figures S3 and S5 in Supporting Information for the raw data. (b) Reversible change in phosphorescence spectrum of ZIr2 in response to CuCl2 (red line, Cu(II)-free state; green line, in the presence of CuCl2 (1 equiv); blue line, after subsequent addition of Na2EDTA (100 equiv) to the mixture). The inset depicts the corresponding change in phosphorescence intensity ratio of green (470–570 nm) vs red (580–700 nm) bands. (c) Reversible change in the phosphorescence decay trace of ZIr2 in response to CuCl2 (red symbols, Cu(II)-free state; green symbols, in the presence of CuCl2 (1 equiv); blue symbols, after subsequent addition of Na2EDTA (200 equiv) to the mixture). Black solid lines are fits based on a triple exponential decay model. The inset depicts the corresponding change in the average phosphorescence lifetime. (d) Cu(II) ion selectivity of ZIr2 (white bar, metal-free state; grey bar, in the presence of metal salt (100 equiv for Na+, Mg2+, Ca2+; 10 equiv for Zn2+; 1 equiv for others); black bar, after subsequent addition of CuCl2 (1 equiv)). Conditions: 10 μM ZIr2 for steady-state measurements and 20 μM ZIr2 for time-resolved measurements in pH 7.0 buffer (25 mM PIPES containing <2 vol % of DMSO).
The copper(II) binding and resultant change in phosphorescence intensity ratio and τavg are reversible. The phosphorescence spectrum of the apo form of ZIr2 was restored by the addition of 100 equiv of Na2EDTA to a 1:1 mixture of CuCl2 and ZIr2 (Figure 2b). The decay trace at 648 nm displayed similar reversibility (Figure 2c). The invariance of the phosphorescence intensity ratio and τavg at varying concentration of ZIr2 and its copper complex in solution or as a suspension (pH 7.0 PIPES buffer containing <2 vol % DMSO; SI, Figures S10 and S11) confirms the robustness of the dual signals. In addition, pH titrations of solutions of ZIr2 and its copper complex reveal the independence of the phosphorescence intensity ratio and τavg over the pH range 4.5–9.5 (SI, Figures S12 and S13). ZIr2 exhibits excellent selectivity for copper(II) ion over biologically abundant Na+, K+, Mg2+, and Ca2+ ions, as well as other biologically important transition metal ions, such as divalent Cr, Mn, Fe, Co, Ni, and Zn (Figure 2d).
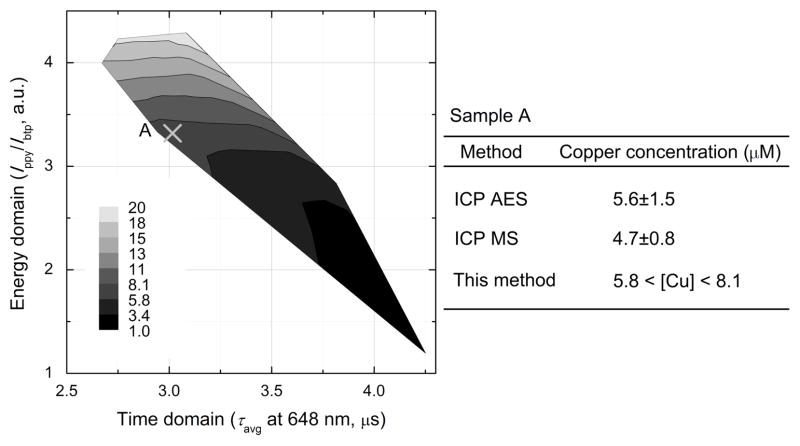
From the dual mode signal outputs we constructed a contour map by which one can quantitate copper(II) ion using our sensor (Figure 3). A notable feature of the map is the availability of two readouts from a single sensor (Ippy/Ibtp and τavg), each of which independently reports on the copper concentration. The limit of copper detection (LOD) of the phosphorescence intensity ratio and the average phosphorescence lifetime were calculated to be as low as 35 ppb and 93 ppb, respectively (SI, Figure S14). These values are below national primary drinking water regulation for copper (1.3 ppm) set by U.S. EPA.41 We therefore employed ZIr2 to investigate real water samples in order to validate its ability to quantify copper concentrations. To water samples collected in Incheon city, Korea (SI), we added ZIr2 (10 μM). The phosphorescence intensity ratio and lifetime of the sample were determined to be 3.0 and 3.3 μs, respectively (SI, Figure S15). These values correspond to a copper(II) concentration between 5.8–8.1 μM, as shown in Figure 3. The accuracy of this measurement was validated by comparison to values obtained by conventional methods employing an ICP AES (5.6±1.5 μM) and an ICP MS (4.7±0.8 μM).
Figure 3.
Contour map showing copper concentration as a function of phosphorescence intensity ratio (Ippy/Ibtp) and average phosphorescence lifetime (τavg) of ZIr2. Also depicted is the quantitation of copper in sample A using the phosphorescence signals. At the right is a comparison of values determined by ICP AES, ICP MS, and the present method.
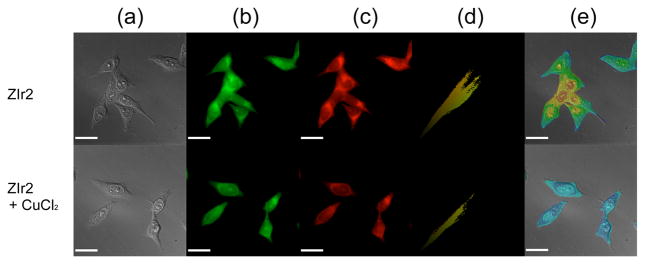
As a final demonstration of its applicability to real problems, we applied our new sensor to detect copper(II) ion exogenously introduced into HeLa cells. An MTT assay revealed that ZIr2 is moderately cytotoxic to HeLa cells (IC50 = 42 μM following incubation for 12 h at 37 °C; SI, Figure S17). Nevertheless, ZIr2 could image intracellular copper(II) ions through the generation of ratiometric phosphorescence signals. HeLa cells were incubated either in the presence or absence of CuCl2 (500 μM, 2 h)42 and then thoroughly washed to remove extraneous CuCl2 and detached cells. The cell morphology was carefully examined to ensure that only live cells were subjected to imaging. Healthy cells were then fixed with MeOH and treated with ZIr2 (10 μM in PBS, 0.5 h). Finally, the cells were rinsed repeatedly with fresh PBS. Phosphorescence images were obtained through both green (510–560 nm) and red (>600 nm) channels. As shown in Figures 4b and c, the extracellular region was not luminescent, indicating limited leakage of the sensor and its copper complex during the time scale of our imaging experiment (<15 min). Copper(II) treatment selectively quenched the red channel intensity of HeLa cells, while the green channel images remained relatively intact. Corresponding phosphorescence ratiometric images, as revealed in Figures 4e, were generated by calculating 2D matrix data representing intensity ratios of the green and red images (SI). Colocalization scatter plots for green and red images are diagonal (Figures 4d), which unambiguously indicates that the green and red phosphorescence signals originate from identical positions for both control and copper(II)-treated HeLa cells. The only shortcoming of ZIr2 for biological applications is its limited compatibility with live cells. Nonetheless, ZIr2 should be useful for other tasks, such as quantification of copper in post-mortem specimens.
Figure 4.
Intracellular copper imaging of fixed HeLa cells treated with 10 μM ZIr2. Cells in the lower panels were incubated with 500 μM CuCl2 prior to ZIr2 treatment. (a) Differential interference contrast images. (b) Phosphorescence acquired through a green channel (excitation band path = 300–390 nm, emission band path = 510–560 nm). (c) Phosphorescence acquired through a red channel (excitation band path = 400–450 nm, emission cut-on for >600 nm). (d) Colocalization scatter plot of green and red channels. (e) Phosphorescence intensity ratio images of green and red channels. Scale bar corresponds to 25 μm, and an identical scale for color mapping was applied to images (e). See Figure S16 in SI for an enlarged version.
To summarize, we synthesized and characterized ZIr2, the first phosphorescent sensor for quantitating copper(II) ion. The dual-emissive platform based on a multichromophoric iridium(III) complex was successfully implemented to afford a multimodal phosphorescence change upon interaction with copper(II). The sensor operates nicely in pH 7.0 PIPES buffer and exhibits excellent reversibility and selectivity for copper(II) ion, with Kd = 16 μM. Its dual modality, comprising phosphorescence intensity ratio and phosphorescence lifetime readouts, affords robust quantification of copper ion in aqueous media. Intracellular copper ion imaging was also achieved by using the ratio of phosphorescence signals acquired through green and red channels. The key advantage of ZIr2 is its unique photophysical design that allows the distinct dual emission. In addition, its long luminescence lifetime should enhance the quality of microscopic signals by application of time-gated acquisition.43 We anticipate that ZIr2 will be a valuable sensor to quantify copper in a range of media.
Supplementary Material
Acknowledgments
This work was supported by a grant from the National Institute of General Medical Sciences (Grant GM065519 to SJL). Spectroscopic instrumentation at the MIT DCIF is maintained with funding from NIH Grant 1S10RR13886-01. The research at EWU was supported by NRF/MEST of Korea through the CRI, GRL (2010-00353), and WCU (R31-2008-000-10010-0). YY acknowledges RP-Grant 2009 of Ewha Womans University. Laser experiments at SNU were supported by CRI Program (RIAMIAM0209 (0417-20090011)).
Footnotes
Supporting Information Available: Experimental details, spectroscopic identification, and optical data are available free of charge via the Internet at http://pubs.acs.org.
References
- 1.Boal AK, Rosenzweig AC. Chem Rev. 2009;109:4760–4779. doi: 10.1021/cr900104z. [DOI] [PMC free article] [PubMed] [Google Scholar]
- 2.Davis AV, O’Halloran TV. Nat Chem Biol. 2008;4:148–151. doi: 10.1038/nchembio0308-148. [DOI] [PMC free article] [PubMed] [Google Scholar]
- 3.Kim BE, Nevitt T, Thiele DJ. Nat Chem Biol. 2008;4:176–185. doi: 10.1038/nchembio.72. [DOI] [PubMed] [Google Scholar]
- 4.Bergonzi R, Fabbrizzi L, Licchelli M, Mangano C. Coord Chem Rev. 1998;170:31–46. [Google Scholar]
- 5.Shao N, Jin JY, Wang H, Zhang Y, Yang RH, Chan WH. Anal Chem. 2008;80:3466–3475. doi: 10.1021/ac800072y. [DOI] [PubMed] [Google Scholar]
- 6.Xiang Y, Tong A, Jin P, Ju Y. Org Lett. 2006;8:2863–2866. doi: 10.1021/ol0610340. [DOI] [PubMed] [Google Scholar]
- 7.Dujols V, Ford F, Czarnik AW. J Am Chem Soc. 1997;119:7386–7387. [Google Scholar]
- 8.Wen Z-C, Yang R, He H, Jiang Y-B. Chem Commun. 2006:106–108. doi: 10.1039/b510546c. [DOI] [PubMed] [Google Scholar]
- 9.Li G-K, Xu Z-X, Chen C-F, Huang Z-T. Chem Commun. 2008:1774–1776. doi: 10.1039/b800258d. [DOI] [PubMed] [Google Scholar]
- 10.Jung HS, Park M, Han DY, Kim E, Lee C, Ham S, Kim JS. Org Lett. 2009;11:3378–3381. doi: 10.1021/ol901221q. [DOI] [PubMed] [Google Scholar]
- 11.Kim HJ, Hong J, Hong A, Ham S, Lee JH, Kim JS. Org Lett. 2008;10:1963–1966. doi: 10.1021/ol800475d. [DOI] [PubMed] [Google Scholar]
- 12.Ciesienski KL, Hyman LM, Derisavifard S, Franz KJ. Inorg Chem. 2010;49:6808–6810. doi: 10.1021/ic1004165. [DOI] [PMC free article] [PubMed] [Google Scholar]
- 13.Wu Q, Anslyn EV. J Am Chem Soc. 2004;126:14682–14683. doi: 10.1021/ja0401038. [DOI] [PubMed] [Google Scholar]
- 14.Demchenko AP. FEBS Letters. 2006;580:2951–2957. doi: 10.1016/j.febslet.2006.03.091. [DOI] [PubMed] [Google Scholar]
- 15.Vinkenborga JL, Koaya MS, Merkx M. Curr Opin Chem Biol. 2010;14:231–237. doi: 10.1016/j.cbpa.2009.11.022. [DOI] [PubMed] [Google Scholar]
- 16.Chang CJ, Jaworski J, Nolan EM, Sheng M, Lippard SJ. Proc Natl Acad Sci USA. 2004;101:1129–1134. doi: 10.1073/pnas.0308079100. [DOI] [PMC free article] [PubMed] [Google Scholar]
- 17.Zhou Y, Wang F, Kim Y, Kim SJ, Yoon J. Org Lett. 2009;11:4442–4445. doi: 10.1021/ol901804n. [DOI] [PubMed] [Google Scholar]
- 18.Royzen M, Dai Z, Canary JW. J Am Chem Soc. 2005;127:1612–1613. doi: 10.1021/ja0431051. [DOI] [PubMed] [Google Scholar]
- 19.Xu Z, Xiao Y, Qian X, Cui J, Cui D. Org Lett. 2005;7:889–892. doi: 10.1021/ol0473445. [DOI] [PubMed] [Google Scholar]
- 20.Kasha M. Faraday Soc Discuss. 1950;9:14–19. [Google Scholar]
- 21.Song L-q, Feng J, Wang X-s, Yu J-h, Hou Y-j, Xie P-h, Zhang B-w, Xiang J-f, Ai X-c, Zhang J-p. Inorg Chem. 2003;42:3393–3395. doi: 10.1021/ic026070j. [DOI] [PubMed] [Google Scholar]
- 22.Spencer BR, Kraft BJ, Hughes CG, Pink M, Zaleski JM. Inorg Chem. 2010;49:11333–11345. doi: 10.1021/ic1011617. [DOI] [PubMed] [Google Scholar]
- 23.Glazer EC, Magde D, Tor Y. J Am Chem Soc. 2005;127:4190–4192. doi: 10.1021/ja0440304. [DOI] [PubMed] [Google Scholar]
- 24.Glazer EC, Magde D, Tor Y. J Am Chem Soc. 2007;129:8544–8551. doi: 10.1021/ja071124f. [DOI] [PMC free article] [PubMed] [Google Scholar]
- 25.Nahhas AE, Consani C, Blanco-Rodríguez AM, Lancaster KM, Braem O, Cannizzo A, Towrie M, Clark IP, Záliš S, Chergui M, Antonín Vlcek J. Inorg Chem. 2011;50:2932–2943. doi: 10.1021/ic102324p. [DOI] [PubMed] [Google Scholar]
- 26.Wallace L, Jackman DC, Rillema DP, Merkert JW. Inorg Chem. 1995;34:5210–5214. [Google Scholar]
- 27.Wallace L, Rillema DP. Inorg Chem. 1993;32:3836–3843. [Google Scholar]
- 28.Wallace L, Woods C, Rillema DP. Inorg Chem. 1995;34:2875–2882. [Google Scholar]
- 29.You Y, Seo J, Kim SH, Kim KS, Ahn TK, Kim D, Park SY. Inorg Chem. 2008;47:1476–1487. doi: 10.1021/ic701778f. [DOI] [PubMed] [Google Scholar]
- 30.You Y, Park SY. J Am Chem Soc. 2005;127:12438–12439. doi: 10.1021/ja052880t. [DOI] [PubMed] [Google Scholar]
- 31.You Y, Kim KS, Ahn TK, Kim D, Park SY. J Phys Chem C. 2007;111:4052–4060. [Google Scholar]
- 32.Lo KKW, Zhang KY, Leung SK, Tang MC. Angew Chem, Int Ed. 2008;47:2213–2216. doi: 10.1002/anie.200705155. [DOI] [PubMed] [Google Scholar]
- 33.Park GY, Kim YS, Ha Y. Curr Appl Phys. 2007;7:390–395. [Google Scholar]
- 34.Erickson K, Braun RD, Yu D, Lanzen J, Wilson D, Brizel DM, Secomb TW, Biaglow JE, Dewhirst MW. Cancer Res. 2003;63:4705–4712. [PubMed] [Google Scholar]
- 35.Berezin MY, Achilefu S. Chem Rev. 2010;110:2641–2684. doi: 10.1021/cr900343z. [DOI] [PMC free article] [PubMed] [Google Scholar]
- 36.Chao S-h, Holl MR, McQuaide SC, Ren TTH, Gales SA, Meldrum DR. Opt Express. 2007;15:10681–10689. doi: 10.1364/oe.15.010681. [DOI] [PubMed] [Google Scholar]
- 37.Ruedas-Rama MJ, Orte A, Hall EAH, Alvarez-Pez JM, Talavera EM. Chem Commun. 2011;47:2898–2900. doi: 10.1039/c0cc05252c. [DOI] [PubMed] [Google Scholar]
- 38.Turba S, Walter O, Schindler S, Nielsen LP, Hazell A, McKenzie CJ, Lloret F, Cano J, Julve M. Inorg Chem. 2008;47:9612–9623. doi: 10.1021/ic800244g. [DOI] [PubMed] [Google Scholar]
- 39.Antonioli B, Büchner B, Clegg JK, Gloe K, Gloe K, Götzke L, Heine A, Jäger A, Jolliffe KA, Kataeva O, Kataev V, Klingeler R, Krause T, Lindoy LF, Popa A, Seichter W, Wenzel M. Dalton Trans. 2009:4795–4805. doi: 10.1039/b901832h. [DOI] [PubMed] [Google Scholar]
- 40.Blindauer CA, Razi MT, Parsons S, Sadler PJ. Polyhedron. 2006;25:513–520. [Google Scholar]
- 41.US EPA, EPA 816-F-09-0004, May 2009
- 42.This incubation condition seems to be cytotoxic to HeLa cells, but there are reports where harsher copper incubation conditions have been employed for fluorescent copper imaging: Domaille DW, Zeng L, Chang CJ. J Am Chem Soc. 2010;132:1194–1195. doi: 10.1021/ja907778b.Jiao L, Li J, Zhang S, Wei C, Hao E, Vicente MGH. New J Chem. 2009;33:1888–1893.Yu M, Shi M, Chen Z, Li F, Li X, Gao Y, Xu J, Yang H, Zhou Z, Yi T, Huang C. Chem Eur J. 2008;14:6892–6900. doi: 10.1002/chem.200800005.
- 43.You Y, Park SY. Adv Mater. 2008;20:3820–3826. [Google Scholar]
Associated Data
This section collects any data citations, data availability statements, or supplementary materials included in this article.


