Abstract
We describe an integrated microfluidic device (µFlowFISH) capable of performing 16S rRNA fluorescence in situ hybridization (FISH) followed by flow cytometric detection for identifying bacteria in natural microbial communities. The device was used for detection of species involved in bioremediation of Cr(VI) and other metals in groundwater samples from a highly-contaminated environmental site (Hanford, WA, USA). The µFlowFISH seamlessly integrates two components: a hybridization chamber formed between two photopolymerized membranes, where cells and probes are electrophoretically loaded, incubated and washed; and a downstream cross structure for electrokinetically focusing cells into a single-file flow for flow cytometry analysis. The device is capable of analyzing a wide variety of bacteria including aerobic, facultative and anaerobic bacteria and was initially tested and validated using cultured microbes, including Escherichia coli, as well as two strains isolated from Hanford site: Desulfovibrio vulgaris strain RCH1, and Pseudomonas sp. strain RCH2 that are involved in Cr(VI) reduction and immobilization. Combined labeling and detection efficiencies of 74–97% were observed in experiments with simple mixtures of cultured cells confirmed specific labeling. Results obtained were in excellent agreement with those obtained by conventional flow cytometry confirming the accuracy of µFlowFISH. Finally, the device was used for analyzing water samples collected on different dates from the Hanford Site. We were able to monitor the numbers of Pseudomonas sp. with only 100–200 cells loaded into the microchip. The µFlowFISH approach provides an automated platform for quantitative detection of microbial cells from complex samples, and is ideally suited for analysis of precious samples with low cell numbers such as those found at extreme environmental niches, bioremediation sites, and the human microbiome.
Keywords: fluorescence in situ hybridization, flow cytometry, microbiome, lab-on-a-chip, microfluidics, photopolymerization
Introduction
Microbes, the most abundant species on earth, play an important role in ecological processes in making, breaking down, and recycling the essential chemicals of life. Microbes are also related to human health and are abundant in our bodies -- in a normal human, microbial cells outnumber human cells by a factor of 10 1. Despite their importance, it is estimated that 90–99% of microbes have not been characterized because they cannot be cultured in the laboratory. Examples of important but poorly characterized microbial communities are those found at environmental sites contaminated with oil spills or toxic chemicals. For example, it was recently shown that microbes played a major role in degrading oil during the 2010 BP oil spill 2. Similarly, natural and accelerated bioremediation of chromium (VI) and other heavy metals at contaminated waste sites has been promising 3, 4. Metal contaminants present the most difficult remediation problems-- they are not easily destroyed, are reactive with soil and sediment constituents, and can remain hazardous at extremely low concentrations for centuries or indefinitely 5, 6. Understanding and accelerating the process of in situ bioremediation of metal contaminants requires that we understand the microbial diversity, as well as trace the changes of key species, at these locations with respect to the geobiochemical processes.
Since most of the microbes in the environment cannot easily be cultured 7, 8, we have to rely on culture-independent techniques to detect and analyze microbes; these techniques include fluorescence in situ hybridization (FISH) 9, PCR 10, microarrays 11, and sequencing of 16S rRNA 12. While amplification-based approaches, including PCR, microarrays, and sequencing, have been extensively used to identify microbes and microbial genes in complex backgrounds, they require lysis of cells to extract DNA or RNA before amplification and hence, have two serious drawbacks. 1) Presence of 16S rRNA cannot be traced back to the original cells to facilitate further molecular analysis. 2) They can provide only qualitative information on species present i.e., they can identify the species present but cannot provide the number or stoichiometry of each species. Fluorescence in situ hybridization (FISH), a method which does not require amplification of nucleic acids, identifies individual microbial cells in complex mixtures 13, 14 based on hybridization of a dye-labeled oligonucleotide probe complementary to an RNA sequence (usually the 16S rRNA) within a cell. FISH is commonly performed in two formats: with surface-bound cells, i.e. on a microscope slide or filter membrane, using conventional epifluorescence or confocal microscopy for detection, or with cells in suspension using flow cytometry (FC) detection. 15, 16 The flow cytometry approach offers higher throughput and a potentially more quantitative readout than imaging, but both formats are tedious involving multiple centrifugation and/or washing steps leading to loss and lysis of cells. This is particularly detrimental to direct analysis of uncultured microbes in precious samples or samples with low microbial abundance. For example, environmental samples such as groundwater and sea water may be available in high volume, but have inherently low microbial cell density. Certain types of human-derived clinical samples such as tissue cores or biopsies may contain small numbers of microbes (in the absence of infection), and by their nature these samples are highly site-specific and limited in volume. Other sites within the human body, such as the skin, normally have higher microbial densities, but surface sampling techniques such as swabs or scraping collect only minute amounts of material, and analysis is typically limited to culturing or genetic testing on the whole community rather than enumeration of individual cell types.
Several efforts have been dedicated to miniaturizing FISH analysis onto microfluidic platforms, for the sake of improved performance, reduced cost, automation, and smaller instrumentation footprint. Interphase (chromosomal) FISH has previously been demonstrated with immobilized peripheral blood mononuclear cells on a microfluidic chip, with imaging as a readout 17. 18S rRNA FISH was demonstrated with Giardia lamblia cysts in a flow-through microchannel device with a micropatterned “weir” structure, although no attempt to perform flow cytometry or quantitative imaging on the labeled cysts was reported 18. Finally, 16S rRNA FISH has been demonstrated on individual cultured microbes deposited on a slide following plug-based stochastic confinement in a microfluidic “chemostrode” 19; the microfluidic device in this study serves to compartmentalize and deposit individual cells on a slide, with an otherwise conventional FISH labeling and microscopy performed after cell deposition. The flow cytometry capability of the Agilent 2100 Bioanalyzer has been used to analyze FISH-labeled marine pelagic bacterial communities, although FISH was performed on cells in suspension following conventional protocols 20. To our knowledge, however, no microsystem has been demonstrated to integrate both FISH labeling and quantitative cytometric detection on a single microfabricated platform. Combining multiple operations onto a single device is an attractive approach for automating FISH analysis, and ensures that labeling and detection happen at the same volume scale, which minimizes sample loss. This is particularly attractive for samples from harsh environments and clinical samples, which are often available in limited quantity.
In this paper, we present an integrated microfluidic device which we call “µFlowFISH” for performing FISH and flow cytometry detection on bacterial cells from samples smaller than 100 µL, with as few as 100 cells demonstrated, using the naturally occurring groundwater bacteria at Hanford Site as a test case. The US Department of Energy Hanford 100H Site, is a mostly decommissioned plutonium production complex on the Columbia River in Washington. While major releases of radioactive material and other heavy metals ended with the reactor shutdown in the 1970s, parts of the Hanford Site remain heavily contaminated 21, 22. Many of the most dangerous wastes are contained, but there are ongoing concerns about groundwater contaminated with radionuclides (e.g. uranium), Cr(VI), and other metals migrating into the Columbia River. To clean up the groundwater, a pilot field experiment, called “biostimulation”, has been actively tested at the 100H site. In this approach, lactate (in the form of Hydrogen Release Compound—HRCTM) is injected into chromium-contaminated groundwater through an injection well, causing indirect or direct bioreduction of Cr(VI) and precipitation of insoluble Cr(III) on soil particles by microbial cells 21, 23.
The bacterial consortium at this site is complex, with more than 100 phylotypes. Strain RCH1 (a sulfate-reducing bacterium similar to Desulfovibrio vulgaris Hildenborough) and strain RCH2 (a denitrifying strain similar to Pseudomonas stutzeri) are cultured representatives of species found to play important roles in the bioremediation process at Hanford 4, 21. We used these two cultured isolates (along with E. coli) for initial development and proof-of-concept testing for our µFlowFISH device. To demonstrate the usefulness of our device in analyzing real-life samples, we obtained water samples at two different time of the year (October and February) from Hanford site and analyzed them to monitor levels of Pseudomonas. The results obtained in our device are in excellent agreement with those obtained by conventional FISH and flow cytometry analysis.
Materials and Methods
1. Bacterial strains and growth conditions
Initial development and tests of the microsystem were performed with cultured Escherichia coli, and Hanford bacterial strains RCH1 (Desulfovibrio vulgaris) and RCH2 (Pseudomonas; >99% sequence similarity to P. stutzeri). Culture and fixation protocols for these microbes are described in the supplementary text.
2. Hanford sample preparation
Three water samples were collected from well 45 at Hanford 100H site at different time points (one on October 2009, the other two on February 2010 at two different depths). Samples were fixed immediately after collection with a final concentration of 1% paraformaldehyde (v/v) for 16 h at 4°C. Portions (10 mL) were filtered on 0.22 µm, 13-mm-diameter polycarbonate membrane (type GTBP; Millipore, Billerica, MA), washed with 10 mL of DI H2O, and stored at −20 °C. Prior to FISH analysis, cells were detached from the membrane by vortexing the membrane at 1400 rpm in 20 mM Tris-HCl (pH 7.4) buffer containing 100 mM NaCl and 0.01% SDS (sodium dodecyl sulfate).
3. Microchip design and fabrication
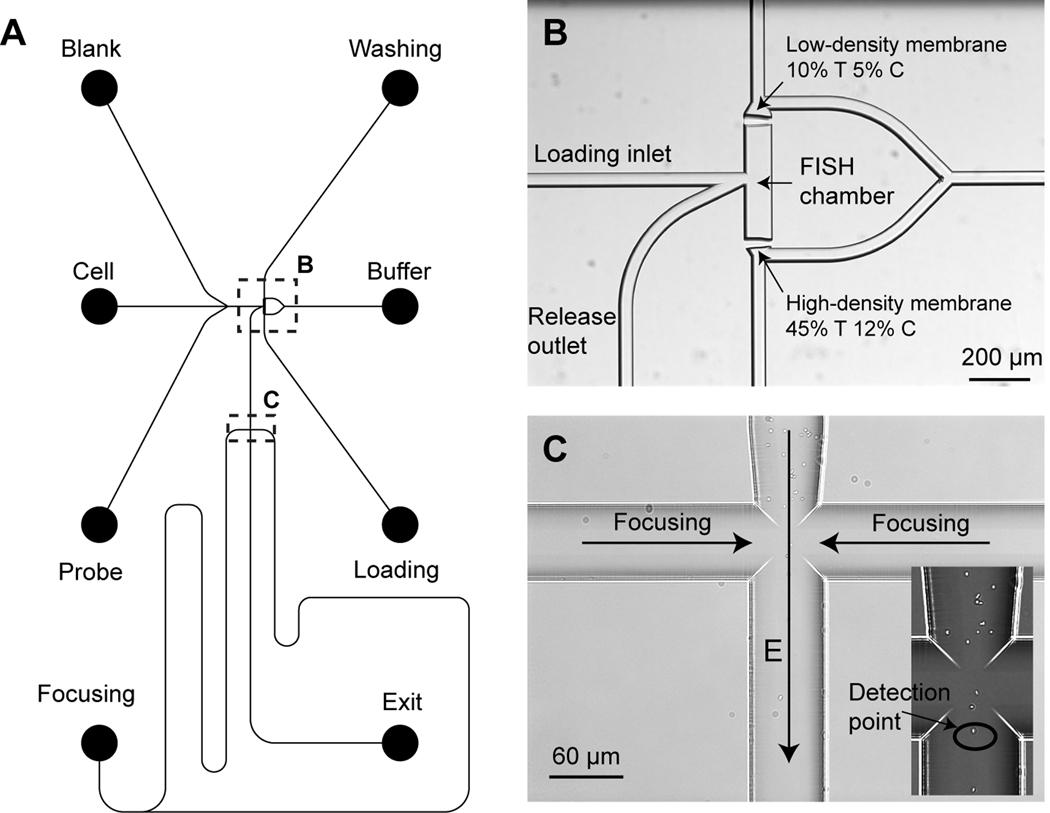
The glass microfluidic device designed for performing both fluorescence in situ hybridization (FISH) and flow cytometry (FC) is illustrated in Figure 1. The µFlowFISH device (dimensions of 22 × 37 mm) consists of two functional components: a FISH chamber bounded by two photopolymerized polyacrylamide membranes, and a channel cross structure for electrokinetically focusing cells to the center of the channel for flow cytometry detection. The glass chip was made following standard protocols for photolithography and 20-µm isotropic wet chemical etching, which were performed by Caliper Life Sciences (Mountain View, CA). All channels were designed with a line width of 20 µm on the photomask, except that the FISH chamber is 80 µm wide.
Figure 1.
Schematic of the microchip design for fluorescence in situ hybridization (FISH) and flow cytometry (µFlowFISH). (A) The mask design of the µFlowFISH chip. (B) An image of the FISH chamber formed by two photopolymerized membrane in the channel. (C) The cross-channel structure for electrokinetically focusing microbial cells into a single stream line along the center of the vertical channel for flow cytometry. The enlarged image of the channel cross shows Escherichia coli being focused in the center of the channels.
As shown in Figure 1B, two photopolymerized polyacrylamide gel membranes were located on each side of the FISH chamber. One of the membranes is made of high concentration, highly cross-linked polyacrylamide (45% T, 12% C, where % T refers to the total monomer mass concentration, and % C refers to the mass of crosslinker as a percentage of the total monomer). The pore size of this membrane is sufficiently small to block passage of oligonucleotide probes, and thus cells and probes can be concentrated and incubated together. The other membrane is low-concentration and porous (10% T, 5% C), which readily permits passage of probes, while retaining cells for washing. Two channels are connected to the side of the chamber to serve as an inlet and outlet of the FISH chamber. The outlet channel leads to a simple channel cross, where an electric field is applied from the two side channels to focus cells into the center of the channel for flow cytometry detection. The detection point is immediately downstream of the cross as indicated in Figure 1C.
4. Photopolymerization of membranes
N,N-methylene bisacrylamide powder, acrylamide monomer powder, and 40% acrylamide monomer solution were purchased from Sigma Aldrich (St. Louis, MO). The water-soluble photoinitiator 2,2’-azobis[2-methyl-N-(2-hydroxyethyl)propionamide] (VA-086) was purchased from Wako Chemicals (Richmond, VA). The photopolymerization of gel membranes on the microchip was similar to the procedure described previously 24, 25. Briefly, the glass channel walls were coated with 3-(trimethoxysilyl) propyl methacrylate (Sigma Aldrich) for 30 minutes to provide a point for covalent anchoring of the membranes to the channel walls. Then the entire device was filled with a 45% (7.3:1) acrylamide/bisacrylamide solution containing 0.2% (w/v) VA-086. A drop of viscous 3% hydroxyethyl cellulose (HEC, MW: 1.3 MDa, Sigma Aldrich) gel was added into each reservoir to minimize hydrodynamic flow within the channels. Using a 355-nm solid state UV laser setup described previously, a narrow 50-µm membrane was photopolymerized in the channel, using five exposure cycles (10-s exposure and 50-s wait). The channels were rinsed, and then refilled with a low-concentration monomer solution (10% (19:1) acrylamide/bis-acrylamide, 0.2% VA-086) for fabrication of the low-concentration membrane using the UV laser. Finally, a 5% acrylamide monomer solution (with no crosslinker) containing 0.1% VA-086 was loaded into the channels, and the entire chip was exposed to 365-nm UV light in a Spectrolinker XL 1500 UV oven for 10 min. This step produced a linear polyacrylamide coating throughout the device, capping off the remaining methacrylate groups on the channel surface, and eliminating cell adsorption and electroosmotic flow. The prepared microchip was rinsed thoroughly with DI water and stored in water at 4 °C.
5. Sample preparations for FISH
The oligonucleotide probes and specificities used for fluorescence in situ hybridization are listed in Table 1; additional details and primary references for probes other than Eco681 can be found in probeBase (http://www.microbial-ecology.net/probebase/default.asp) 26. Probes were labeled at the 5’ end with either AlexaFluor 488 or Cy3, and synthesized by IDT (Coralville, IA).
Table 1.
Oligonucleotide probes used for microfluidic FISH and flow cytometry.
| Probe Name | Sequence | Specificity | Probe base accession number / reference |
|---|---|---|---|
| EUB338 | GCTGCCTCCCGTAGGAGT | Most bacteria (positive control) | pB-00159 |
| NON338 | ACTCCTACGGGAGGCAGC | Complement to EUB338 (negative control) | pB-00243 |
| Eco681 | CATTTCACCGCTACACCT | E. coli | 29 |
| DSV1292 | CAATCCGGACTGGGACGC | Some Desulfovibrio spp. | pB-00086 |
| PSM G | CCTTCCTCCCAACTT | Pseudomonas spp. | pB-00380 |
For on-chip FISH experiments, 100 µL fixed cells was washed once and suspended in 100 µL of the hybridization buffer, followed by ultrasonication in a low-power sonicating bath for 7 min to declump cells. The FISH probes were diluted to a concentration of 15 ng/µL in the hybridization buffer. The hybridization buffer contains 400 mM NaCl, 20 mM Tris-HCl, pH 9.2, 0.05% BSA (bovine serum albumin), and 0.01% SDS. In an effort to reduce use of organic solvents, temperature rather than formamide was used to adjust stringency of hybridization. A temperature of 46 °C for E. coli with Eco681, and 48 °C was used for RCH1 and RCH2 with DSV1292 and PSM G during FISH experiments. The washing buffer was 50 mM NaCl, 20 mM Tris-HCl, pH 9.2, 0.1 % BSA, and 0.01% SDS.
6. Operating procedure
To prepare on-chip FISH and flow cytometry, the microdevice was filled with hybridization buffer and mounted in a fluidic manifold (information on hardware and instrumentation is given in the supplementary text). 80 µL of the hybridization buffer was added into the buffer reservoir with only 20 µL in the washing and the loading reservoirs. This generates a gentle, constant flow in the channels, which keeps the ion composition stable during the analytical process. 80 µL of cell solution was pipetted into the cell reservoir and the remaining four reservoirs were loaded with 80 µL of a high-viscosity 3% HEC solution to suppress hydrodynamic flows in the remaining channels. The device was placed on the stage of an inverted microscope (IX-71, Olympus, Melville, NY) and a heater attached to the manifold was turned on to equilibrate at the hybridization temperature for 10 min before the experiment.
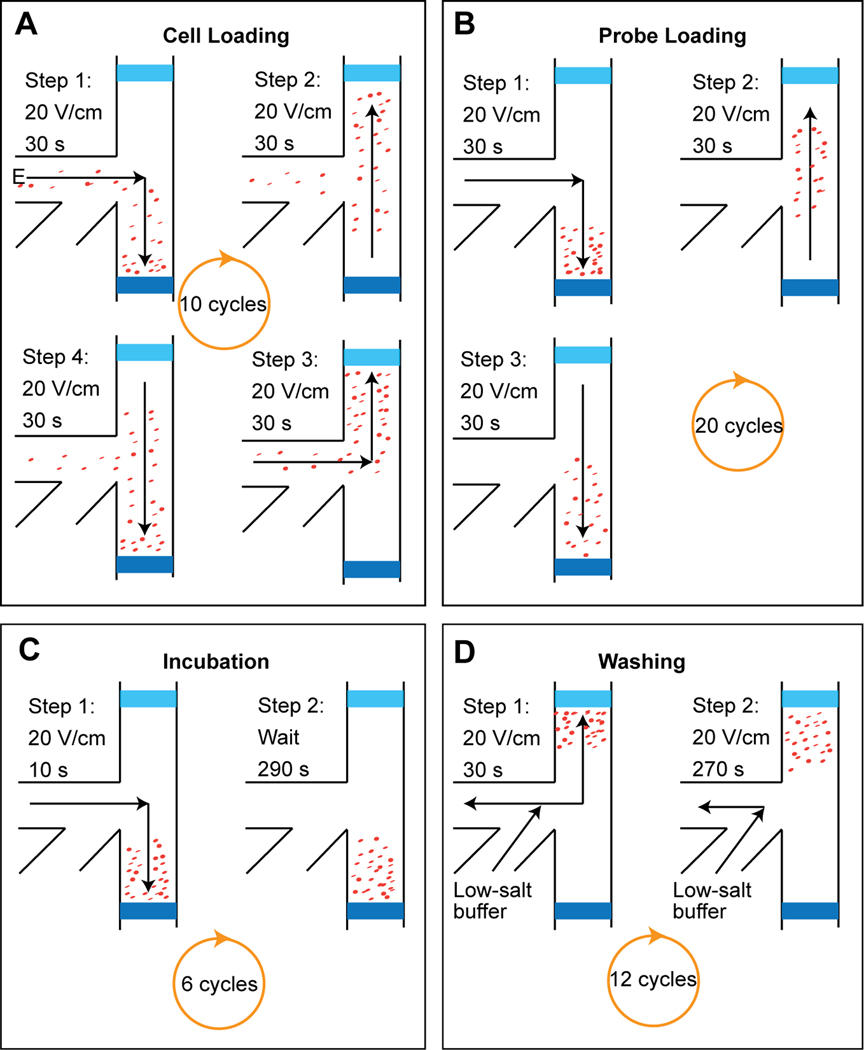
A schematic of the on-chip FISH is shown in Figure 2. To load the cells into the FISH chamber, an electric field of 20 V/cm was applied to mobilize cells towards the high-concentration loading membrane for 30 s. A cyclic loading strategy, illustrated in Figure 2A, in which the field was switched between four different configurations, was employed to keep cells moving continuously between the two membranes. This loading strategy prevents cells from settling and becoming stuck to the membranes. After the cell loading, the cell reservoir was refilled with 3% HEC gel, and the probe reservoir was refilled with 80-µL FISH probe solution. The probe loading (Figure 2B) is performed following a similar, cyclic method as the cell loading, except that the probes were only concentrated against the loading membrane. After 20 probe loading cycles, the incubation step was begun by mobilizing both microbes and probes toward the loading membrane. The field is turned off for 290 seconds, during which time cells and probe diffuse freely. A 20 V/cm electric field is then applied for 10 s to re-concentrate cells and probe at the loading membrane. This incubation procedure is repeated for a total of six 5-minute cycles. The final step is washing, in which a low ionic strength buffer was employed to achieve a high-stringency wash, and to assist with declumping of cells. The probe reservoir and exit reservoir were refilled with washing buffer, and an electric field of 20 V/cm was applied to mobilize the cells towards the washing membrane. Again, a cyclic process is used: for 30 seconds, the field is applied across the washing membrane, which forces probe through the membrane. For 270 seconds, no field is applied within the chamber. Probes, which have much higher diffusivity than cells, gradually diffuse out of the FISH chamber and are swept away by an electric field applied from the exit reservoir to the probe reservoir. This washing procedure comprises twelve 5-minute cycles. The entire on-chip FISH process including loading, incubation, and washing was completed in about 2.5 hours.
Figure 2.
Schematic procedure for on-chip FISH. (A) Cell loading. Microbial cells loaded into the cell reservoir are mobilized into the FISH chamber under an electric field of 20 V/cm. The direction of the electric field is switched every 30 seconds, alternating cell loading between the two membranes. A total 10 cycles are performed. (B) Probe loading. The probes in the probe reservoir are loaded into the FISH chamber following the same method as that of cell loading, except that probes are not loaded towards the washing membrane. Twenty loading cycles are conducted, during which probes are concentrated against the loading membrane. (C) Incubation. The loaded cells and probes are incubated together near the loading membrane. After every 290 s of incubation, the mixture is pushed against the loading membrane for 10 s. (D) Washing. The cells are moved to the washing membrane in this step. Excess probes are washed through the membrane under an electric field, or diffused out of the chamber via channel inlet/outlet. The total analysis time of the on-chip FISH is about 2.5 hours.
Once the on-chip FISH was completed, a 3% HEC gel was added to the probe and exit reservoirs to suppress hydrodynamic flow in these arms of the chip. By applying potentials of 200 V at the exit reservoir, 0 V on the focusing reservoir, and 80 V on the washing reservoir, cells were electrokinetically mobilized towards the exit reservoir and focused to form a single–file line in the cross structure for single-cell detection with a custom-made laser induced fluorescence detection system. After the flow cytometry was finished, a high electric field (over 100 V/cm) was applied across the membranes and the FISH chamber to clean out any residual cells. The microchip was then removed from the manifold, and thoroughly rinsed with DI water.
On-chip results for Hanford samples were compared to results obtained using conventional FISH-FC methods. Protocols for conventional FISH and flow cytometry analysis can be found in the supplementary text.
Results & Discussion
1. Proof-of-concept for µFlowFISH with E. coli
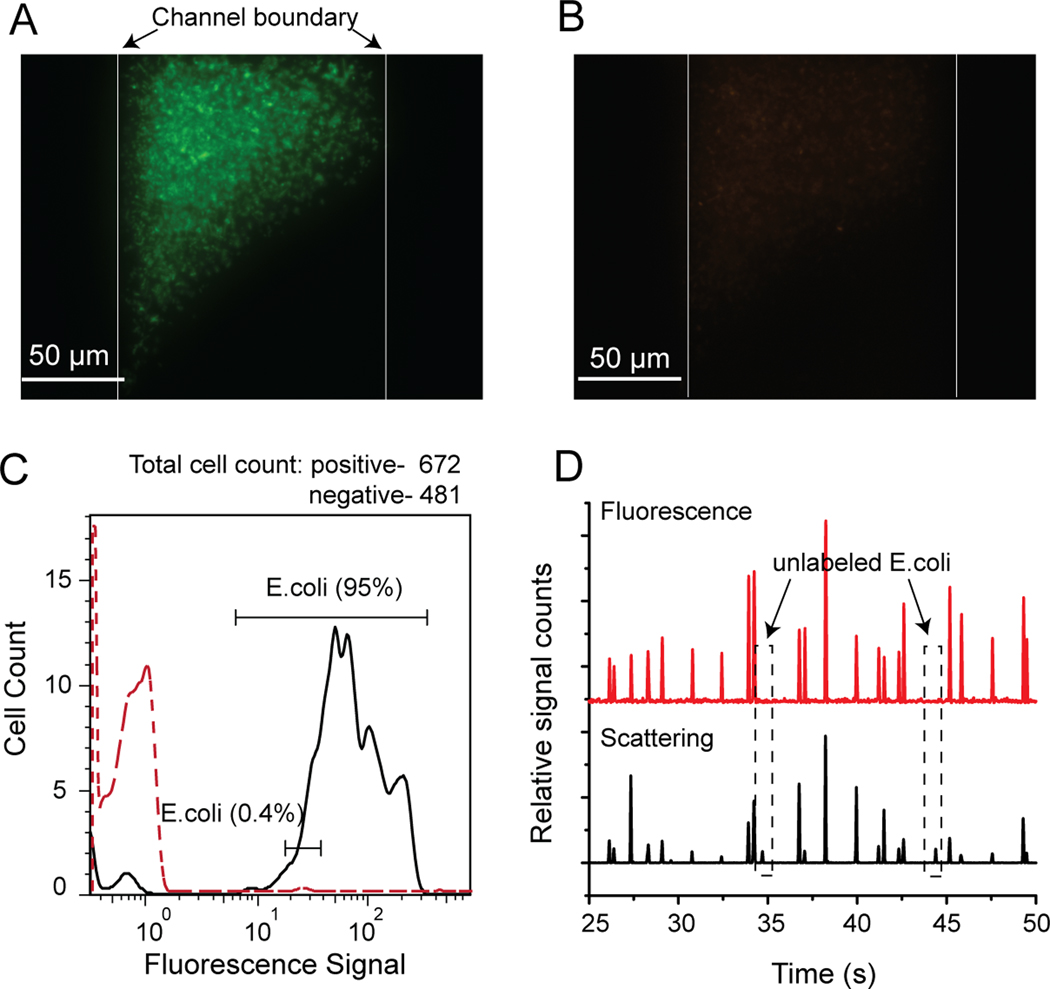
To verify and optimize µFlowFISH, E. coli cells were tested using the Alexa488-labeled Eco681 and Cy3-labeled NON338 probes. As shown in Figure 3A and B, the E. coli cells were successfully labeled with E. coli-specific Eco681 probes in the FISH chamber, while no signals were observed using the negative control or “nonsense” NON338 probe (images were acquired using similar imaging parameters in both the green (Alexa 488) and orange (Cy3) channels). After FISH staining, all the cells were freely floating in the chamber without observable clumping.
Figure 3.
µFlowFISH analysis of Escherichia coli. (A) Fluorescence image of E. coli hybridized with Alexa488-labeled Eco681 probes in the FISH chamber. Two vertical lines indicate the boundaries of the chamber. (B) Very weak fluorescence signals in the negative control using Cy3-labeleed NON338. (C) On-chip flow cytometry results of E. coli. The black line is the positive control experiment using Eco681 probes, showing about 95% of the cells were successfully labeled with probes. The red dashed line indicates that only 0.4% of the cells have strong fluorescence signals when incubated with the negative control NON338 probes. (D) Typical raw data traces obtained from the flow cytometry detection system. Unlabeled cells, as indicated in the dashed rectangles, produce only scattering peaks (bottom trace) without corresponding fluorescence peaks (top trace), while labeled E. coli cells have aligned peaks in both channels.
The flow cytometry results demonstrated that 95% of 672 total E. coli cells were stained with Eco681, whereas only 0.4% of 481 cells (i.e. 2 cells total) were stained with NON338 (Figure 3C). A portion of the raw data of the flow cytometry of the positive Eco681 experiment obtained from the laser induced fluorescence detection system are shown in Figure 3D to illustrate the data analysis algorithm. As indicated in the dashed boxes, some cells only produced scattering peaks (bottom trace) without corresponding fluorescence peaks (top traces), indicating that these cells were not labeled with the fluorescent probes. The other scattering peaks have corresponding fluorescence peaks, indicating these cells are labeled with probes.
2. Cultured isolates from Hanford site
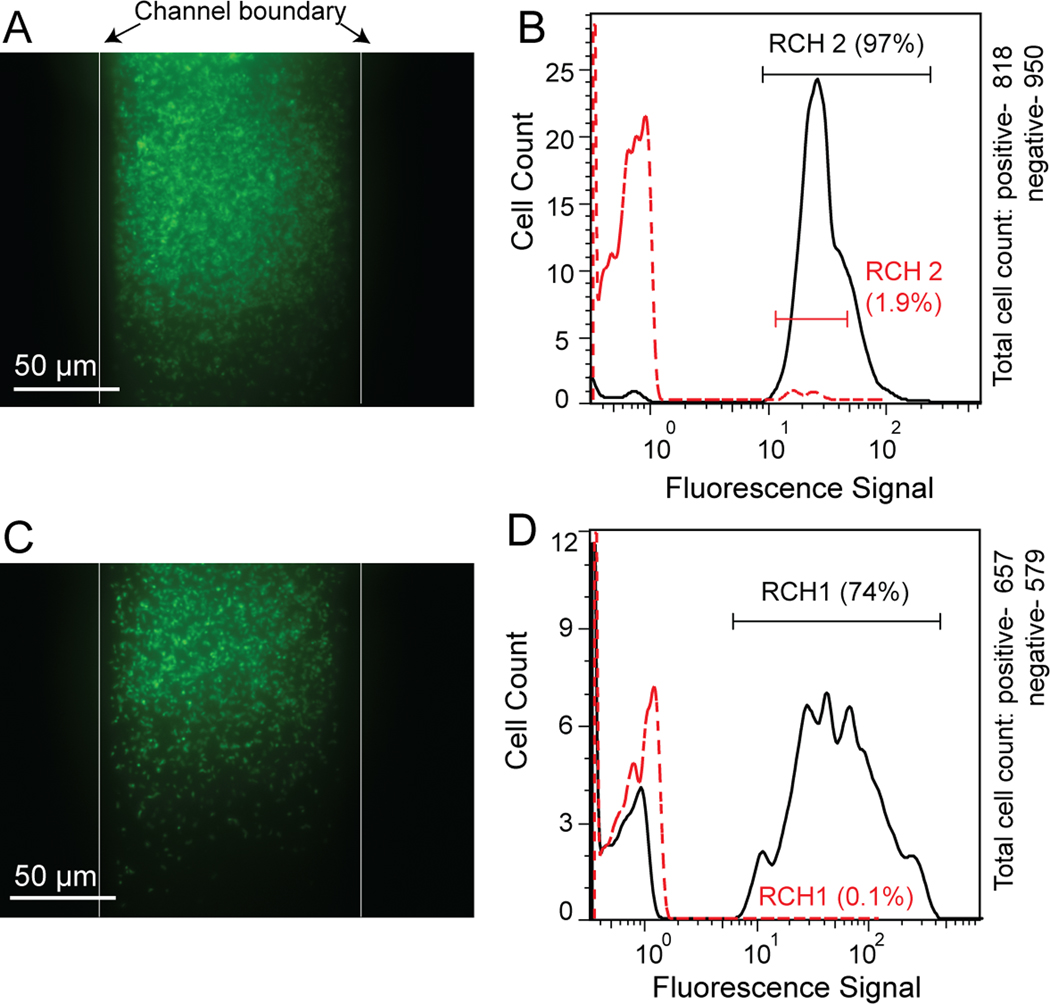
Following system optimization with E. coli, we analyzed cultured microbes from the groundwater consortium from the DOE Hanford 100H Site in Washington. To test the efficacy of our system for detecting these microbes, we analyzed simple mixtures of cultured strains RCH1 (similar to Desulfovibrio vulgaris) and RCH2 (similar to Pseudomonas stutzeri) on the system, using genus-specific 16S FISH probes, DSV1292 and PSM G, as well as the negative control NON338 probe. As shown in Figure 4A and C, images of on-chip FISH experiments show that both cultured RCH1 and RCH2 cells can be successfully labeled with their respective Alexa488 labeled probes. The following on-chip flow cytometry detections confirmed that about 97% of the RCH2 and 74% of the RCH1 cells were successfully labeled with their corresponding probes. As an initial test of FISH labeling specificity, negative control experiments using the Alexa488-labeled NON338 probes were conducted on both bacteria. As shown in Figure 4B and D, only 1.9% of the RCH2 and 0.1% of the RCH1 cells emitted detectable fluorescence signals.
Figure 4.
µFlowFISH analysis of cultured Hanford isolates RCH1 and RCH2. (A) On-chip FISH of cultured RCH2 using Alexa488-labeled PSM G probe. (B) On-chip flow cytometry result showing 97% of RCH2 cells were hybridized with PSM G probes and only 1.9% of cells emitted fluorescence with Alexa488-NON338 probes. (C) FISH staining of cultured RCH1 with Alexa488-labeled DSV1292 probes. (D) Flow cytometry results of the stained RCH1 cells with Alexa488-DSV1292 and Alexa488-NON338. 74% and 0.1% of the cell population are stained, respectively.
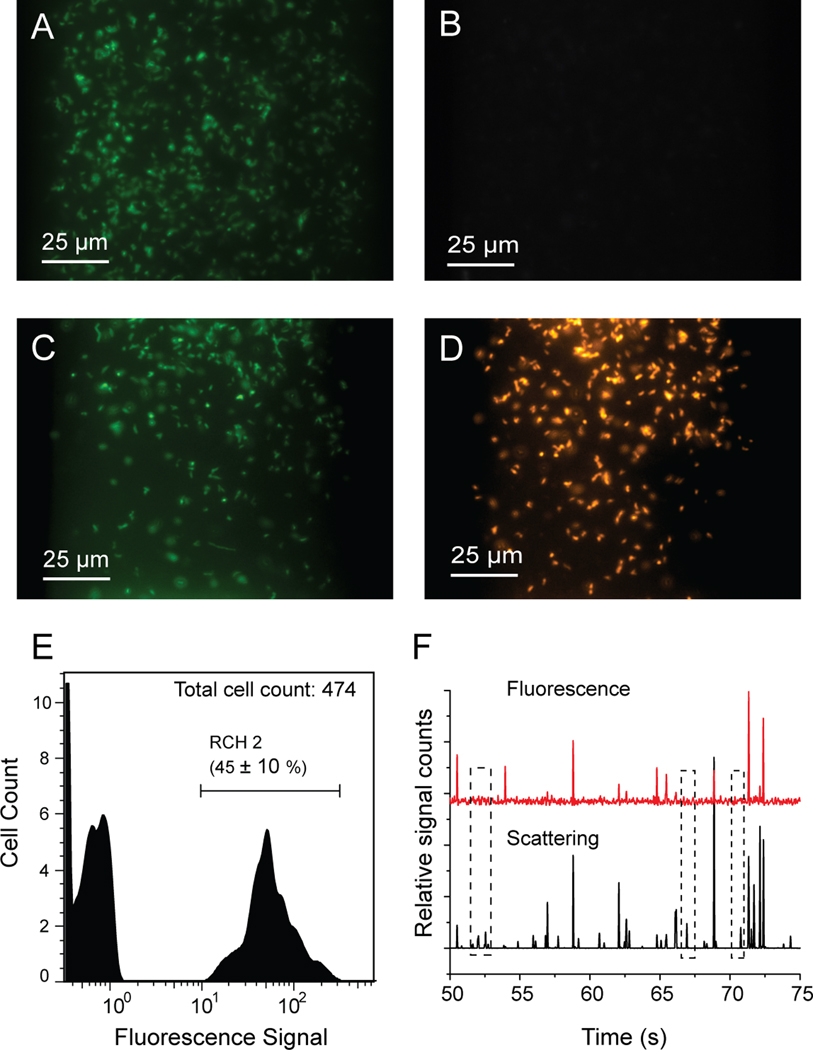
A binary mixture of RCH1 and RCH2 at a ratio of 1:1 was also analyzed using the microsystem. First, positive and negative control experiments using EUB338-Alexa488 and NON338-Cy3 were conducted, demonstrating (as expected) complete labeling and non-labeling of the mixture samples, as shown in Figure 5A and B. After that, by using a probe mixture of Alexa488-labeled PSM G and Cy3-labeled DSV1292, the RCH1 and RCH2 cells in the mixture sample were simultaneously labeled with their respective probes, shown in Figure 5C and D. Finally, the 1:1 mixture of RCH1 and RCH2 was incubated on chip with PSM G-Alexa488 only, and analyzed by on-chip flow cytometry, with a 45 ± 10% showing a positive signal by flow cytometry. Compared to the 97% of the labeling rate in the RCH2-only samples, 45% in the mixture sample is in good accordance with the mixing ratio of 1:1. Figure 5F shows typical traces obtained from the flow cytometry detection system. As indicated in the dashed boxes, unlabeled cells produced peaks in the scattering channel without corresponding peaks in the fluorescence channel. These results illustrate the effectiveness and specificity of the microsystem for FISH and flow cytometry analysis of the Hanford isolates.
Figure 5.
Analysis of a mixture of RCH1 and RCH2 at a ratio of 1:1 using µFlowFISH. (A) The FISH staining of the mixture with Alexa488-EUB338. (B) Negative control of the same mixture sample with Cy3-NON338 probes. (C) RCH2 in the mixture labeled with probe Alexa488-PSM G. (D) RCH1 in the mixture hybridized with probe Cy3-DSV1292. (E) Flow cytometry results of the mixture sample analysis where only Alexa488-PSM G probe was used to detect RCH2 cells revealing that 45 ± 10% of the cell population were stained with PSM G probes. (F) Representative flow cytometry traces showing labeled cells have both the scattering and the fluorescence peaks while unlabeled only have the scattering signals.
3. Groundwater sample analysis
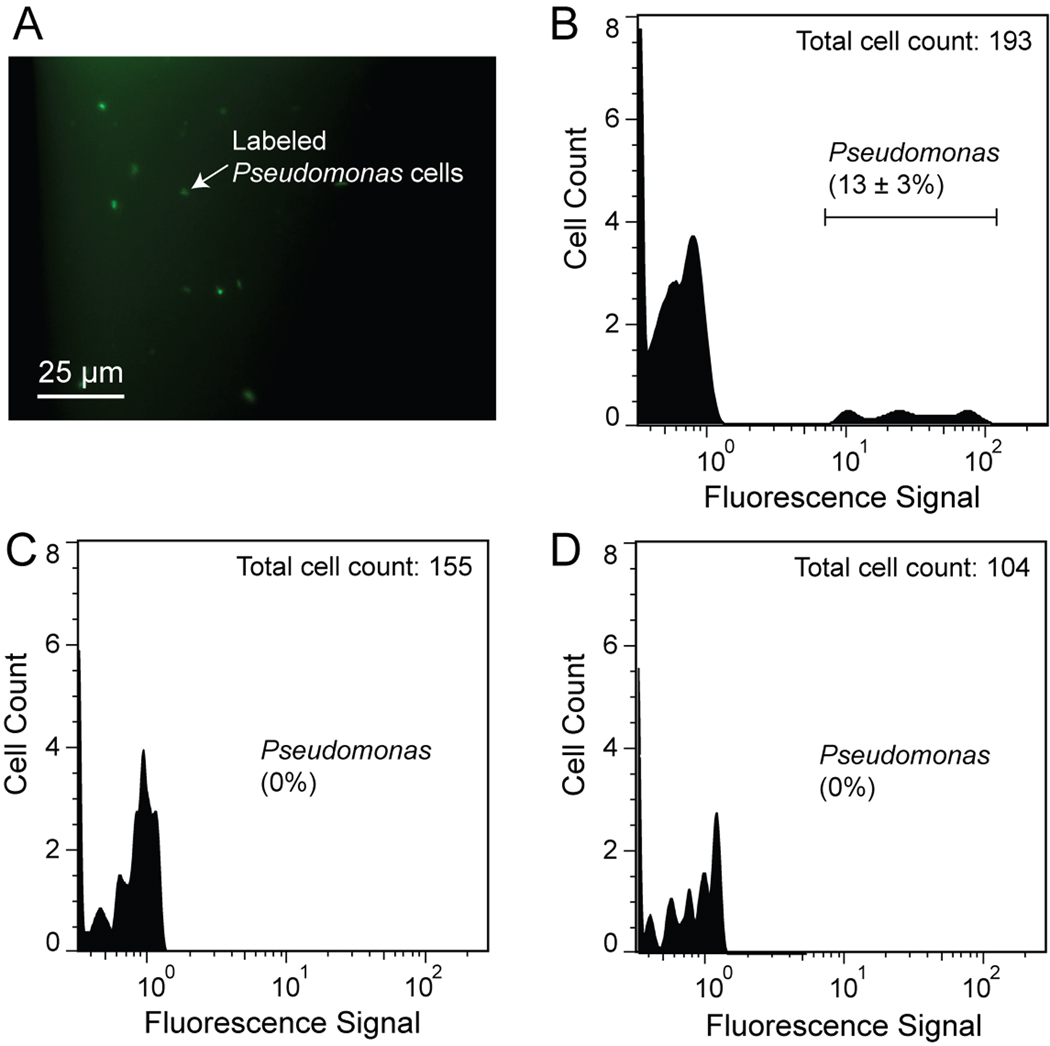
After thoroughly testing the microsystem using cultured RCH1 and RCH2 cells, we analyzed underground water samples collected from the Hanford 100H site for Pseudomonas cells, as determined by hybridization with probe PSM G (this probe is complementary to the 16S rRNA of most Pseudomonas species, including RCH2 and most other Pseudomonads that may be present). A total of three samples collected on two different dates were analyzed on the system. Using our µFlowFISH system, we found that the first sample contains about 12±3% of Pseudomonas cells. As shown in Figure 6A, the bright green spots are the cells labeled with the Alexa488-labeled PSM G probes. In contract, the other two samples showed no labeled cells in our on-chip tests. The reason for the dramatic difference in the Pseudomonas population between the two sampling times October 2009 and January 2010 is not known. But these two samples functioning as negative controls verified the specificity of the on-chip FISH labeling in the first sample test.
Figure 6.
Analysis of Hanford groundwater samples using µFlowFISH. (A) On-chip FISH of the first water sample. The green spots indicate RCH2 cells were stained with Alexa488-PSM G probes. (B) The on-chip flow cytometry result of the same sample. About 12±3% of the cells are identified as Pseudomonas. In contract, the other two water samples (C and D) have no detectable Pseudomonas cells.
To validate the µFlowFISH results, we analyzed the same samples using the conventional FISH-in-suspension method followed by flow cytometry on a state-of-the-art commercial instrument (BD FACSAria II). The conventional analysis shows that about 15% of the cells in the first sample are labeled by probe PSM G, and the other two samples only have about 0.2% of PSM G- positive cells, in good agreement with our on-chip experiments. To further validate these results, we attempted to perform microarray (PhyloChip) analysis of the same samples. However, attempts to analyze the community by microarray were unsuccessful, due to insufficient DNA (possibly due to low biomass). The apparent difficulty of extracting usable DNA from some environmental samples for microarray analysis highlights the need for complementary techniques such as µFlowFISH which can process low biomass samples with minimal sample preparation or user intervention.
Conventional FISH labeling experiments for other species such as Desulfovibrio spp. (e.g. RCH1) showed few or no Desulfovibrio cells from samples on both dates, and thus chip experiments for this cell type in the Hanford 100H samples are not presented here.
Conclusions
We have developed an integrated microdevice capable of performing fluorescence in situ hybridization and flow cytometry analysis from small-volume microbial samples. Microscale format enables analysis of small number of cells typically found in samples with low cell density (such as environments contaminated with toxic chemicals or clinical samples). For example, we can analyze a sample with cells as few as 100–200, a feat not feasible with conventional approaches that require 10,000 or more cells. Furthermore, the integrated, automated analysis reduces loss in cells during various centrifugation and washing steps. The device works for both aerobic and anaerobic bacteria and was validated by testing with E. coli, cultured RCH1 (Desulfovibrio spp.) and RCH2 (Pseudomonas spp.) cells. The electrokinetic approach to cell mobilization is particularly well suited for multiplexing to a larger number of chambers on a single device. In the future, size reduction of the detection system will enable deployment of such microsystems in the field where we can monitor microbial communities real-time. In addition, the on-chip FISH can be integrated with a cell sorting structure to allow analysis on a targeted subpopulation of cells, even to the level of individual cells. Microscale devices are inherently scaled for single-cell analysis 27, 28, and we anticipate that a microfluidic process of labeling and single-cell sorting, followed by downstream genomic or transcriptomic analysis may confer advantages over conventional approaches to performing single-cell isolation,sorting and analysis of environmental and clinical (e.g., human microbiome) samples.
Supplementary Material
Acknowledgements
This work was funded by ENIGMA, a Lawrence Berkeley National Laboratory Scientific Focus Area Program supported by the U.S. Department of Energy, Office of Science, Office of Biological and Environmental Research, Genomics: GTL Foundational Science through contract DE-AC02-05CH11231 between Lawrence Berkeley National Laboratory and the U.S. Department of Energy. The development of the microfluidic platform was also funded in part by (5 R01 DE020891) from the National Institute of Dental and Craniofacial Research at the NIH. Sandia is a multi program laboratory operated by Sandia Corp., a Lockheed Martin Co., for the United States Department of Energy under Contract DE-AC04-94AL85000.
References
- 1.Savage DC. Annual Review of Microbiology. 1977;31:107–133. doi: 10.1146/annurev.mi.31.100177.000543. [DOI] [PubMed] [Google Scholar]
- 2.Hazen TC, Dubinsky EA, DeSantis TZ, Andersen GL, Piceno YM, Singh N, Jansson JK, Probst A, Borglin SE, Fortney JL, Stringfellow WT, Bill M, Conrad ME, Tom LM, Chavarria KL, Alusi TR, Lamendella R, Joyner DC, Spier C, Baelum J, Auer M, Zemla ML, Chakraborty R, Sonnenthal EL, D'Haeseleer P, Holman HYN, Osman S, Lu ZM, Van Nostrand JD, Deng Y, Zhou JZ, Mason OU. Science. 2010;330:204–208. doi: 10.1126/science.1195979. [DOI] [PubMed] [Google Scholar]
- 3.Anderson RT, Vrionis HA, Ortiz-Bernad I, Resch CT, Long PE, Dayvault R, Karp K, Marutzky S, Metzler DR, Peacock A, White DC, Lowe M, Lovley DR. Applied and Environmental Microbiology. 2003;69:5884–5891. doi: 10.1128/AEM.69.10.5884-5891.2003. [DOI] [PMC free article] [PubMed] [Google Scholar]
- 4.Han R, Geller JT, Yang L, Brodie EL, Chakraborty R, Larsen JT, Beller HR. Environmental Science & Technology. 2010;44:7491–7497. doi: 10.1021/es101152r. [DOI] [PubMed] [Google Scholar]
- 5.Gadd GM. Microbiology-Sgm. 2010;156:609–643. doi: 10.1099/mic.0.037143-0. [DOI] [PubMed] [Google Scholar]
- 6.Goulhen F, Gloter A, Guyot F, Bruschi M. Applied Microbiology and Biotechnology. 2006;71:892–897. doi: 10.1007/s00253-005-0211-7. [DOI] [PubMed] [Google Scholar]
- 7.Tringe SG, Rubin EM. Nature Reviews Genetics. 2005;6:805–814. doi: 10.1038/nrg1709. [DOI] [PubMed] [Google Scholar]
- 8.Petrosino JF, Highlander S, Luna RA, Gibbs RA, Versalovic J. Clinical Chemistry. 2009;55:856–866. doi: 10.1373/clinchem.2008.107565. [DOI] [PMC free article] [PubMed] [Google Scholar]
- 9.Amann R, Fuchs BM. Nature Reviews Microbiology. 2008;6:339–348. doi: 10.1038/nrmicro1888. [DOI] [PubMed] [Google Scholar]
- 10.Baker GC, Smith JJ, Cowan DA. Journal of Microbiological Methods. 2003;55:541–555. doi: 10.1016/j.mimet.2003.08.009. [DOI] [PubMed] [Google Scholar]
- 11.Call DR, Borucki MK, Loge FJ. Journal of Microbiological Methods. 2003;53:235–243. doi: 10.1016/s0167-7012(03)00027-7. [DOI] [PubMed] [Google Scholar]
- 12.Andersson AF, Lindberg M, Jakobsson H, Backhed F, Nyren P, Engstrand L. Plos One. 2008;3:e2836. doi: 10.1371/journal.pone.0002836. [DOI] [PMC free article] [PubMed] [Google Scholar]
- 13.Delong EF, Wickham GS, Pace NR. Science. 1989;243:1360–1363. doi: 10.1126/science.2466341. [DOI] [PubMed] [Google Scholar]
- 14.Amann RI, Ludwig W, Schleifer KH. Microbiological Reviews. 1995;59:143–169. doi: 10.1128/mr.59.1.143-169.1995. [DOI] [PMC free article] [PubMed] [Google Scholar]
- 15.Amann RI, Binder BJ, Olson RJ, Chisholm SW, Devereux R, Stahl DA. Applied and Environmental Microbiology. 1990;56:1919–1925. doi: 10.1128/aem.56.6.1919-1925.1990. [DOI] [PMC free article] [PubMed] [Google Scholar]
- 16.Wallner G, Amann R, Beisker W. Cytometry. 1993;14:136–143. doi: 10.1002/cyto.990140205. [DOI] [PubMed] [Google Scholar]
- 17.Sieben VJ, Marun CSD, Pilarski PM, Kaigala GV, Pilarski LM, Backhouse CJ. Iet Nanobiotechnology. 2007;1:27–35. doi: 10.1049/iet-nbt:20060021. [DOI] [PubMed] [Google Scholar]
- 18.Zhang Q, Zhu L, Feng HH, Ang S, Chau FS, Liu WT. Analytica Chimica Acta. 2006;556:171–177. doi: 10.1016/j.aca.2005.07.003. [DOI] [PubMed] [Google Scholar]
- 19.Liu WS, Kim HJ, Lucchetta EM, Du WB, Ismagilov RF. Lab on a Chip. 2009;9:2153–2162. doi: 10.1039/b904958d. [DOI] [PMC free article] [PubMed] [Google Scholar]
- 20.Gerdts G, Luedke G. Journal of Microbiological Methods. 2006;64:232–240. doi: 10.1016/j.mimet.2005.05.001. [DOI] [PubMed] [Google Scholar]
- 21.Faybishenko B, Hazen TC, Long PE, Brodie EL, Conrad ME, Hubbard SS, Christensen JN, Joyner D, Borglin SE, Chakraborty R, Williams KH, Peterson JE, Chen JS, Brown ST, Tokunaga TK, Wan JM, Firestone M, Newcomer DR, Resch CT, Cantrell KJ, Willett A, Koenigsberg S. Environmental Science & Technology. 2008;42:8478–8485. doi: 10.1021/es801383r. [DOI] [PubMed] [Google Scholar]
- 22.Hubbard SS, Williams K, Conrad ME, Faybishenko B, Peterson J, Chen JS, Long P, Hazen T. Environmental Science & Technology. 2008;42:3757–3765. doi: 10.1021/es071702s. [DOI] [PubMed] [Google Scholar]
- 23.Da Silva MLB, Daprato RC, Gomez DE, Hughes JB, Ward CH, Alvarez PJJ. Water Environment Research. 2006;78:2456–2465. doi: 10.2175/106143006x123111. [DOI] [PubMed] [Google Scholar]
- 24.Herr AE, Hatch AV, Throckmorton DJ, Tran HM, Brennan JS, Giannobile WV, Singh AK. Proceedings of the National Academy of Sciences of the United States of America. 2007;104:5268–5273. doi: 10.1073/pnas.0607254104. [DOI] [PMC free article] [PubMed] [Google Scholar]
- 25.Meagher RJ, Hatch AV, Renzi RF, Singh AK. Lab on a Chip. 2008;8:2046–2053. doi: 10.1039/b815152k. [DOI] [PubMed] [Google Scholar]
- 26.Loy A, Maixner F, Wagner M, Horn M. Nucleic Acids Research. 2007;35:D800–D804. doi: 10.1093/nar/gkl856. [DOI] [PMC free article] [PubMed] [Google Scholar]
- 27.Marcy Y, Ouverney C, Bik EM, Losekann T, Ivanova N, Martin HG, Szeto E, Platt D, Hugenholtz P, Relman DA, Quake SR. Proceedings of the National Academy of Sciences of the United States of America. 2007;104:11889–11894. doi: 10.1073/pnas.0704662104. [DOI] [PMC free article] [PubMed] [Google Scholar]
- 28.Ottesen EA, Hong JW, Quake SR, Leadbetter JR. Science. 2006;314:1464–1467. doi: 10.1126/science.1131370. [DOI] [PubMed] [Google Scholar]
- 29.Fuchs BM, Wallner G, Beisker W, Schwippl I, Ludwig W, Amann R. Applied and Environmental Microbiology. 1998;64:4973–4982. doi: 10.1128/aem.64.12.4973-4982.1998. [DOI] [PMC free article] [PubMed] [Google Scholar]
Associated Data
This section collects any data citations, data availability statements, or supplementary materials included in this article.


