Abstract
The contributions that de novo differentiation of new hepatocyte lineages makes to normal liver physiology are unknown. Here a system that uniquely marks cells during a finite period following primary activation of a serum albumin gene promoter/enhancer-driven Cre transgene (albCre) was used to investigate birthrates of new hepatocyte lineages from Alb-naïve precursors in mice. Elapsed time was measured using a two-color fluorescent marker-gene that converts from expressing tdTomato (tdT, red-fluorescent) to expressing GFP (green-fluorescent) upon exposure to Cre. Accumulation of GFP and decay of tdT each contributed to a regular fluorescence transition, which was calibrated in vivo. In normal adults, this system revealed that a steady-state level of 0.076% hepatocytes had differentiated within the previous four days from cell lineages that had never previously expressed albCre. As compared to resting adult livers, the relative abundance of these newborn hepatocytes was elevated 3.7-fold in normal growing livers of juveniles and 8.6-fold during liver regeneration following partial hepatectomy in normal adults.
Conclusion:
Newborn hepatocyte lineages arising from Alb-naïve cells contribute to liver maintenance under normal conditions. Hepatocyte lineage birthrates can vary in response to the liver’s physiological status.
Keywords: hepatic stem cell, liver development, liver regeneration, liver maintenance, hepatocyte lineage life history
Hepatocytes are one of few differentiated cell types that can replicate DNA and proliferate (1, 2). Mouse liver grows more than 500-fold in mass between embryonic day 14.5 and postnatal day 56 (P56) (3). This increase in liver mass is accompanied by changes in the relative proportions of populations of resident cell types as hepatocyte populations expand to replace hematopoietic cells that migrate to the bone marrow (4, 5); by increases in hepatocyte cell size; and by increases in total numbers of hepatocytes in the organ (3, 6). The hepatocyte proliferative component of this growth has been estimated to underlie at least a 30- to 100-fold increase in the number of hepatocyte genomes during this developmental transition (3).
Hepatocytes in adult animals can also transiently proliferate in response to hepatocyte loss resulting from partial hepatectomy, toxic exposures, or other insults that reduce hepatocyte numbers (7, 8). For example, surgical removal of 2/3 of rodent liver induces rapid synchronous entry of nearly all remaining hepatocytes into the cell cycle, resulting in full regeneration of liver mass in about ten days (9, 10).
Likely hidden within the dramatic backdrop of hepatocyte replication during these periods of proliferative growth are the subtle contributions of proliferation and differentiation of low-abundance pre-hepatocyte cells into new proliferative hepatocyte lineages. Currently it is unclear whether pre-hepatocyte cells, variously called “hepatic stem cells”, “oval cells”, “bi-potential cells”, or “progenitor/stem cells”, are all equivalent or represent different types or degrees of lineage commitment; however all have in common the ability to differentiate into hepatocytes (2, 11, 12). Previous studies have been unable to detect substantial contributions of pre-hepatocyte cells to postnatal developmental or acute regenerative growth (2, 13-15), and we are unaware of any previous studies showing a role for differentiation of new hepatocyte lineages in normal liver maintenance. However, the abundance of pre-hepatocyte cells can be increased by conditions that chronically compromise hepatocytes while impeding hepatocyte proliferation (2, 12, 16-18). Since most previous studies on pre-hepatocyte cells relied on expansion of their populations by such means, it is unclear which of their ascribed properties truly reflect characteristics of pre-hepatocyte cell types in normal liver and which reflect atypical or intermediately differentiated states that arise in response to the induction conditions (19-21). Clearly there is a need for improved means to study the activities of pre-hepatocyte cell types under conditions that may be relevant to normal human health and exposures.
In the study presented here, we combined existing transgenic mouse lines to develop a sensitive system to quantify the abundance of newly differentiated hepatocytes that arise from albumin-(Alb-) naïve cells. Using this system, we show that newborn hepatocyte lineages contribute to developmental liver growth in normal juvenile mice, to liver maintenance in normal adult mice, and to liver regeneration following partial hepatectomy. Our results suggest that newborn hepatocyte lineages may play an important role in growth, maintenance, and repair of normal liver.
Experimental Procedures
Mouse lines and care conditions
All animal care and use protocols were approved by the Montana State University Institutional Animal Care and Use Committee. C57Bl/6J and Gt(ROSA)26Sortm4(ACTB-tdTomato,-EGFP)Luo/J (22) (here abbreviated “ROSAmT-mG“) mice, B6;129-Gt(ROSA)26Sortm1(cre/Esr1)Nat/J (“ROSACreER”) (23), or mice bearing the “albCre” transgene (B6.Cg-Tg(Alb-cre)21Mgn/J) were purchased from Jackson Labs (stock numbers 000664, 007576, 004847, and 003574, respectively). Genomic DNA samples were collected before weaning from all pups and genotypes were determined by PCR using previously reported primers (24). All mice are maintained under conditions of sterilized feed (PicoLab 5058), water, bedding, and enrichment materials; forced HEPA-filtered-air caging systems (Tecniplast); and a 14:10-hour light:dark cycle. AdCre administration was performed as described previously (24). Where used, the CDE diet consisted of choline-deficient rodent chow pellets (MP Biomedicals) and water supplemented to 0.075% (w/v) with DL-ethionine (Alfa Aesar) (17, 25).
Tissue harvests, surgeries, fluorescence microscopy, and data analyses
Animals of ages indicated in text, figures, and legends were sacrificed and liver samples were frozen fresh in OCT medium (Tissue-Tec). For Alb immunostaining, animals were perfused by cardiac-puncture/portal-draining with 5- to 10-ml sterile saline to remove cross-reactive serum albumin from vessels and capillaries. Immunostaining used polyclonal goat-anti-mouse albumin (Bethyl no. A90-134A) and Alexa Fluor-350-labeled donkey-anti-goat secondary antibody (Molecular Probes, no. A21081), as we described previously (26); polyclonal rabbit-anti-HNF-4 (Santa Cruz no. sc-8987) (27) and Alexa Fluor-350-labeled donkey-anti-rabbit secondary antibody (Invitrogen no. A-10039); or monoclonal rat Monts-4 antibody (28) (generously provided by Dr. M.A. Jutila, Montana State University) and Alexa Fluor-350-labeled goat-anti-rat secondary antibody (Invitrogen no. A-10093). Where indicated, 2/3-hepatectomies were performed as described previously (3, 10). Cryosections (5 μmeter) were fixed in 75% acetone/25% ethanol and were mounted with Fluoromount-G or Fluoromount-G containing DAPI (Southern Biotech), as indicated (due to the blue emission of Alexa Fluor-350, DAPI was excluded from all immunofluorescence slides). Monochromatic images were captured digitally on a Nikon Eclipse 80i, a Nikon Eclipse E800, or an Olympus BX60 microscope, each using standard DAPI- (blue), FITC- (green), or TRITC- (red) filter sets. Within each experiment, all images were captured using the same microscope and camera system. Some micrographs were electronically enlarged or reduced within Photoshop CS3 software. Scale bars in figures were set by photographing a micrometer-scale under each magnification used and subjecting these images to the same electronic enlargement or reduction as the biological images shown. For quantitative pixel analyses, monochromatic images were captured using uniform microscope and camera settings for each color and no further adjustments were made. Exposure settings for quantitative pixel analyses generally underexposed images to prevent signal saturation by strongly fluorescent cells. Green- and red-pixels were counted using the “Histogram” function in Photoshop CS3 software. For other monochromic images, the whole area shown was adjusted using the “Autocontrast” function in Photoshop. All monochrome image merging was performed in Photoshop CS3 software (see Fig. S1). For merging, images were captured separately for each color channel and were layered using Photoshop software with the blue channel forming the background at 100% opacity; green next at ~50% opacity, and red as the top layer at ~40% opacity; opacity values were chosen empirically to give the best aesthetic balance of blue, red, and green fluorescence (see Fig. S1). All layers were merged and were uniformly adjusted using the “Autocontrast” function in Photoshop. In cases where images were overexposed, a “black-point” was set inside the darkest region of a major capillary using the Photoshop CS3 “Levels” function. With the exception of the images of newly differentiated hepatocytes, all micrographs were representative of the whole organ. Newly differentiated hepatocytes were distributed in clusters. Images were taken to show these, as indicated in figure legends. All image adjustments were performed uniformly to the entire image. None of these adjustments qualitatively or quantitatively affect the interpretations or conclusions arising from the data, but instead serve useful aesthetic functions and ease visualization and enumeration of important biological characteristics of each sample. For quantification of newborn hepatocytes, arbitrary fields of view were counted on a series of sections from each mouse until at least 30 fields were evaluated and 30 remarkably red hepatocytes were counted. Statistical analyses used at least three biological replicates (i.e., from different animals) for each condition. Graphical data are presented as means ± s.e.m. Significance was tested using the Student’s T test.
Results
ROSAmT-mG fluorescent switch kinetics in hepatocytes*
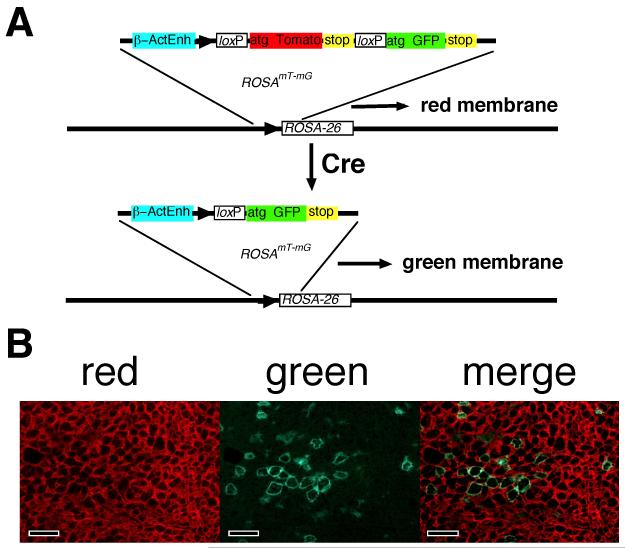
The ROSAmT-mG allele was developed as a strong ubiquitously expressed two-color fluorescent marker to distinguish Cre-naïve from Cre-exposed cell lineages in mice (22). Briefly, it is a targeted insertion into the non-essential ubiquitously expressed ROSA26 locus on chromosome 6 (29). Expression levels were augmented by incorporation of enhancer elements from the chick β-actin gene and from cytomegalovirus (22). Downstream of the promoter is a loxP-flanked modified tdTomato (tdT) cistron followed by a modified enhanced green fluorescent protein (GFP) cistron (22). The cassette was engineered to direct both fluorescent proteins to the outer membrane (22). ROSAmT-mG has no overt affects on mouse physiology (22). A schematic of ROSAmT-mG is shown in Fig. 1A.
Fig. 1. Labeling hepatocytes with ROSAmT-mG.
(A) Schematic of ROSAmT-mG before and after conversion. The allele drives strong membrane-associated red fluorescence (tdT) in the pre-recombined Cre-naïve state (top). Cre excises the tdT cistron and uncovers a membrane-targeted GFP. Since recombination is genomic, allelic quality (red or green) is inherited by daughter cells at replication. (B) Fluoromicrographs of liver sections from a normal adult ROSAmT-mG/+ mouse transduced I.V. 3-weeks earlier with 108 PFU of AdCre showing red, green, and merged images from the same frame. Green cells were transduced with AdCre and converted from red- to green-fluorescence. Red cells are Cre-naïve. Scale bars 100 μmeters.
Expression of Cre recombinase in cells containing ROSAmT-mG results in excision of the tdT cistron. This uncovers the GFP cistron causing an irreversible switch from red to green outer membrane fluorescence (Fig. 1A)(22). Because this is a genetic modification, the fluorescence-state of the allele is passed to daughter cells at replication. As such, ROSAmT-mG marks cell lineages green that have, at any point in their history, transiently expressed Cre; only truly Cre-naïve lineages fluoresce red.
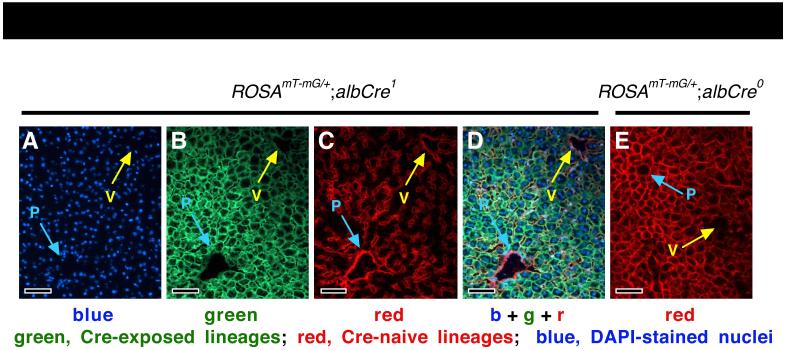
Intravascular (I.V.) inoculation of ROSAmT-mG/+ mice with a hepatocyte-tropic replication-defective adenoviral vector that expresses Cre (AdCre) results in roughly synchronous conversion of a mosaic subset of hepatocytes from red- to green-fluorescent in vivo (Fig. 1B) (3, 24). In mice harboring both ROSAmT-mG and the albCre transgene (ROSAmT-mG/+;albCre1 mice), which expresses Cre under the control of the serum albumin (alb) gene promoter and enhancer (30), all differentiated hepatocytes have expressed Cre and fluoresce green (Fig 2B,D), whereas non-hepatocytic cells including endothelial cells surrounding blood vessels and capillaries, as well as other non-hepatocyte liver cells, remain Cre-naïve and fluoresce red (Fig. 2C,D) (3, 24, 26). Because, in ROSAmT-mG/+;albCre1 mouse livers, GFP labels the outer membranes of only differentiated hepatocytes, green-fluorescent images reveal subtle zonal differences in hepatocyte cell size and hepatocyte membrane fluorescence (Fig. 2B,D), which corresponds to differences in the density of the endothelia cell-lined capillary networks observed in the red channel (Fig. 2C). Around portal circulation (P), hepatocyte sizes are smaller and green fluorescence is more intense than that seen around venous circulation (V). ROSAmT-mG/+;albCre0 mice, which do not express Cre, have red membranes in all cells, yet the zonal pattern of global fluorescence, with increased intensity around portal circulation, is still observed (Fig. 2E). This zonal variation in hepatocyte membrane fluorescence is reminiscent of previously reported zonal differences in metabolic activity and gene expression (31, 32) and may have a related underlying cause (32). Importantly, using ROSAmT-mG/+ mice, this variation appears equivalent for both the red and green markers (see below).
Fig. 2. Zonal fluorescence variance in ROSAmT-mG/+;albCre1 and ROSAmT-mG/+;albCre0 mice.
(A-D) Blue, green, red, and merged fluorescence is shown from the same frame on a section from a normal ROSAmT-mG;albCre1 mouse. (A) DAPI-stained nuclei. (B) Green image shows that hepatocytes are generally smaller and fluorescence is more intense near portal (p, blue arrows) as compared to venous (v, yellow arrows) circulation. (C) The density of capillary beds, seen as red endothelial cell networks, is greater among the small hepatocytes surrounding portal circulation. (D) Merged image. (E) Red image shows that ROSAmT-mG/+;albCre0 livers have red hepatocytes and show a similar zonal pattern of fluorescence intensity. This suggests that zonal variance in red- and green-fluorescence is similar. Scale bars 100 μmeters.
ROSAmT-mG as an in vivo chronometer
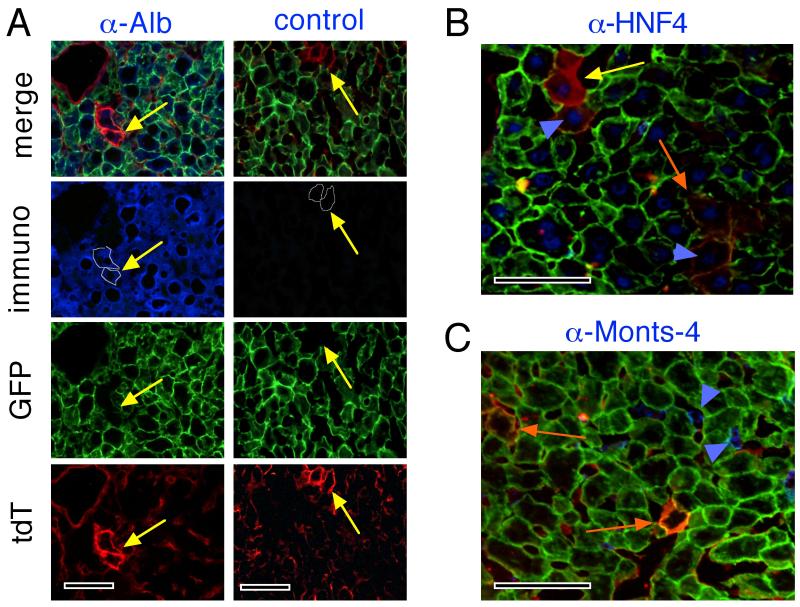
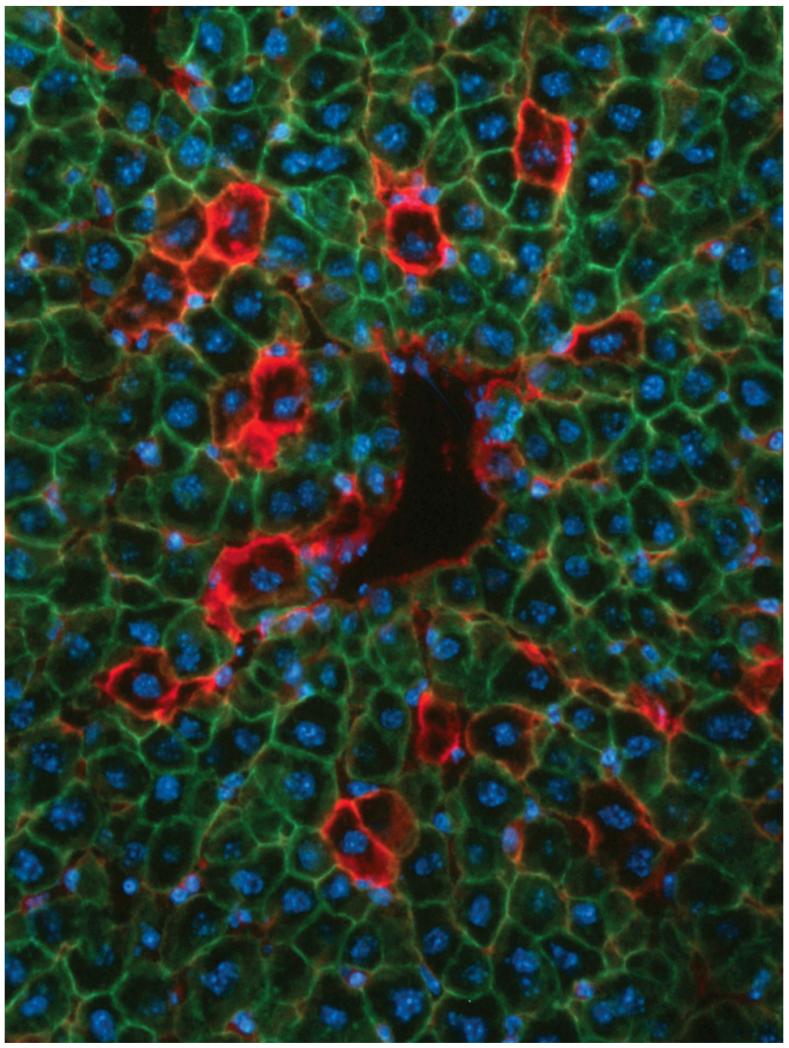
We previously observed that, during regeneration in ROSAmT-mG/+;albCre1 mice, a rare subset of periportal hepatocytes could be found having a substantial level of red fluorescent protein expression on their membranes (Fig. S1) (3). These cells, despite being heterozygous for the ROSAmT-mG allele and therefore only able to express either tdT or GFP, not both (Fig. 1A), exhibited both red and green outer membrane fluorescence (see below). Theoretically, a somatic mutation in either the albCre transgene or the ROSAmT-mG allele could cause “Cre-failure” and result in the rare appearance of a purely red hepatocyte in a ROSAmT-mG/+;albCre1 mouse; however few physiological situations could allow an individual cell to express both tdT and GFP. The most likely was that these cells had been actively expressing tdT until very recently, and then had converted to GFP expression. During an interim period, one might expect pre-formed tdT protein to persist coincident with newly formed GFP protein accumulating in the membranes, resulting in a transient period during which both proteins coexisted in single cells. This situation would only be expected to occur in newly differentiated hepatocytes that had very recently activated the albCre transgene, and had not yet fully converted from red- to green-fluorescent protein accumulation (3). To test this possibility, we immunostained cryosections from perfused regenerating ROSAmT-mG/+;albCre1 mouse livers with an anti-mouse Alb antibody (α-Alb), or no primary antibody (control), followed by a blue-fluorescent secondary antibody (Fig. 3A; yellow arrows denote same point in each vertical series of exposures). Results verified that these “reddish” cells (circumscribed by fine white lines in blue immunofluorescence panels) had cytoplasmic Alb protein, indicating that they were actively expressing their endogenous alb genes and synthesizing serum albumin. We also immunostained sections of regenerating liver for HNF-4, a hepatocyte-specific transcription factor (27) and for Monts-4, a cell-surface marker of tissue-resident macrophages, including Kupffer cells (28) (Fig. 3B,C). Results showed that these “reddish” cells contained nuclear HNF-4 protein and were not a part of the Monts-4-expressing hepatic cell population. Based on cell morphology, cytosolic Alb protein, nuclear HNF-4 protein, and the absence of surface Monts-4 staining, these cells were differentiated hepatocytes and not Kupffer cells (27, 28, 33-37). Based on the presence of both tdT and GFP in their membranes, they were recently Cre-naïve cells that had activated the albCre transgene but not yet lost all preexisting tdT. Thus, we concluded that the ROSAmT-mG marker could be used not only to trace Cre-exposed cell lineages, but also, in combination with albCre, as a short-term in vivo chronometer for detecting hepatocyte lineages that had recently undergone primary differentiation from a Alb- and Cre-naïve pre-hepatocyte cell type (3).
Fig. 3. Alb and HNF-4 expression, but not Monts-4 expression, in “reddish hepatocytes”.
Four days following 2/3 hepatectomy of ROSAmT-mG/+;albCre1 mice, animals were sacrificed, perfused with saline to flush serum albumin from the hepatic circulation, and livers were harvested. (A) Cryosections were immunostained for Alb using anti-mouse Alb antibody (α-Alb, left column of images) or no primary antibody (control, right column of images) followed by Alexa Fluor-350- (blue-) labeled secondary antibody. Slides were mounted without DAPI and were photographed by fluorescence microscopy. Columns of images represent the same frames photographed with the color channels indicated at left. “Reddish hepatocytes” (yellow arrows) in each frame are circumscribed with a fine white line in the Alb images. Yellow arrows are in the same position in each frame of each column of images. (B, C) merged fluoromicrographs of cryosections as in A stained for HNF-4 (B) or Monts-4 (C). Yellow and orange arrows indicate hepatocytes with less (younger) or more (older) green in membranes, respectively. Blue arrowheads indicate representative nuclei in reddish hepatocytes that stained blue for HNF-4 (panel B) or representative Kupffer cells that stained blue for Monts-4 (panel C). Scale bars 100 μmeters.
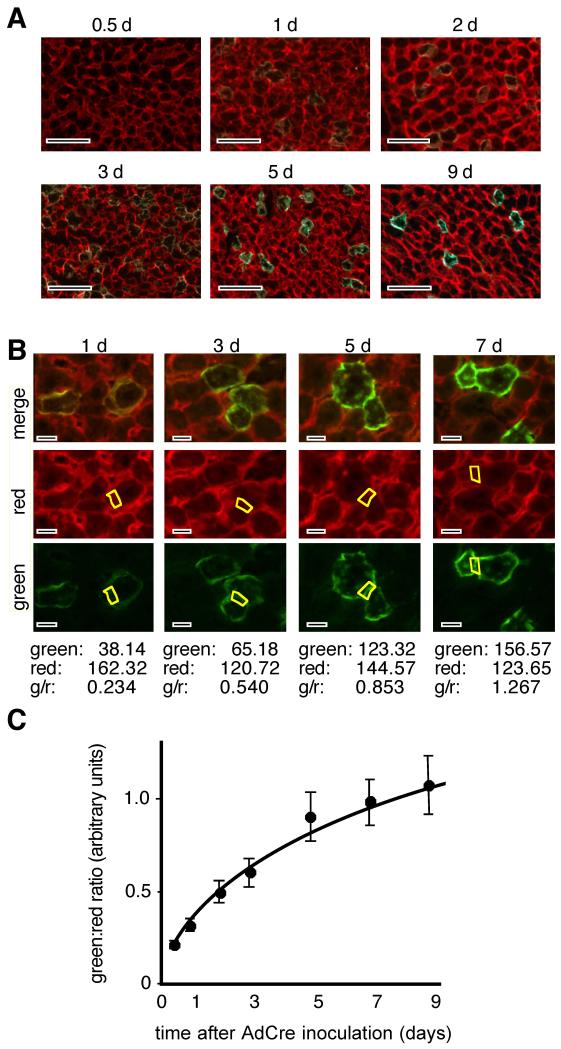
To calibrate this chronometer in hepatocytes, we induced synchronous expression of Cre in the hepatocytes of ROSAmT-mG/+ mice by I.V. administration of AdCre (24). Mice were harvested in triplicate over a nine-day time-course thereafter and liver sections were photographed for red- and green-fluorescence (Fig. 4A,B). Green and red pixels were quantified in regions containing only hepatocyte membranes and the green:red pixel ratios were calculated (Fig. 4B,C). Data showed that, within a given liver, green:red pixel ratios varied by ≤ 10%, verifying that zonal variation in hepatocyte fluorescence intensities were similar for both GFP and tdTomato fluorescence (Fig. 2A,D). Green:red pixel ratios were plotted versus time, giving a calibration curve for the rate of fluorescent protein conversion following Cre expression in ROSAmT-mG/+ hepatocytes in vivo (Fig. 4C). A similar calibration curve was obtained by triggering Cre activity in ROSAmT-mG/CreER mice (3) with a pulse of 4-hydroxyTamoxifen (Fig. S2).
Fig. 4. Calibrating the ROSAmT-mG chronometer.
(A) Adult mice (postnatal day 56 – 63, P56 - 63) were inoculated with AdCre and were harvested at the indicated times thereafter. Merged red and green fluoromicrographs show representative sections at each time point. Scale bars 100 μmeters. (B) Method for quantifying green:red ratios in individual hepatocytes. Top, merged images. Regions of hepatocyte membranes that did not overlap with non-hepatocyte cell membranes were identified. Below, regions were selected and red- and green-pixels were quantified using unadjusted monochrome images and the “Histogram” function in Photoshop CS3 software (tabulated below each column of images). Although overall fluorescence intensity varied zonally (see Fig. 2), within hepatocytes this variation was roughly equivalent for both tdT and GFP, such that green:red ratios were similar in membranes of hepatocytes from any region of a given liver. Below each column of images is tabulated the pixel counts for the selected region (yellow boxes) of the red and green images above. Scale bars 25 μmeters. (C) Quantitative calibration of the hepatocyte lineage age chronometer from 30 hepatocytes from each of 3 animals at each time point; mean ± s.e.m..
Whereas the transition from having purely red-fluorescent to purely green-fluorescent outer membranes takes roughly ten days to complete in hepatocytes in vivo, at later times in this transition, the hepatocytes are only subtly red (Fig. 4B,C). In ROSAmT-mG/+;albCre1 livers, where fields are dramatically green from the abundance of differentiated hepatocytes yet are also intertwined with red-fluorescent endothelial cells (Figs 2D, S1), hepatocytes with low levels of residual red fluorescence can be difficult to discern from older purely-green hepatocytes. Pragmatically, newly differentiated hepatocyte lineages are “noticeably red” for about four days following Cre expression (Figs 4C, S2), after which they become difficult to identify in screens. Therefore, values for “newborn hepatocyte lineages” in this study are for those up to about four days following primary induction of albCre expression.
“Newborn hepatocyte lineages” in ROSAmT-mG;albCre1 mice
In ROSAmT-mG cells, conversion from red to green is irreversible (22). In ROSAmT-mG/+;albCre1 mice, which have only a single allele of ROSAmT-mG, any purely red-fluorescent cell must be on a lineage that has never expressed albCre, and any cell that exhibits both red- and green-fluorescence must have expressed mT recently enough to retain pre-formed tdT protein in the membrane, but must also have expressed albCre to excise the mT cistron and uncover expression of mG (Fig. 1A). This situation should occur only in newborn hepatocyte lineages during a brief period following primary expression of the albCre transgene.
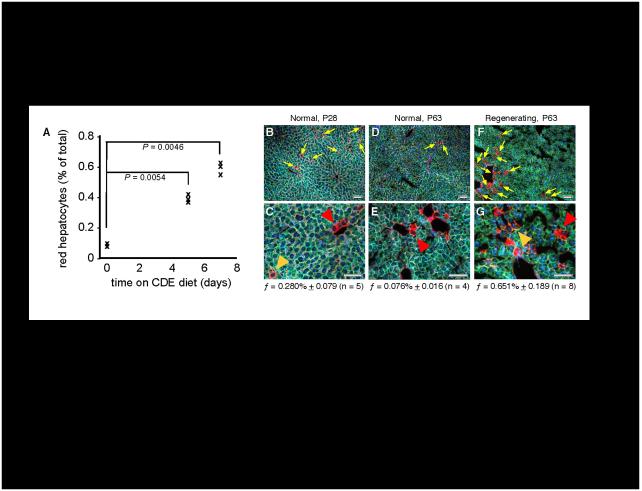
Some conditions of hepatotoxicity result in expansion of pre-hepatocyte cell populations. One established protocol for enriching pre-hepatocyte cells in rodent liver is by maintenance of animals on a choline-deficient diet supplemented with ethionine (CDE diet) (17, 25, 38, 39). Livers harvested from resting adult ROSAmT-mG/+;albCre1 mice on a normal diet showed 0.076% of all hepatocytes were ≤ 4 days old (Fig. 5A,D,E). Maintenance of mice on a CDE diet resulted in an increase in levels of these newborn hepatocytes to 0.4% at 5 days and 0.6% at 7 days (5- and 8-fold higher, respectively; Fig. 5A), consistent with these cells arising anew from the expanded populations of pre-hepatocyte cells induced by these conditions.
Fig. 5. Quantification of newborn hepatocyte lineages in ROSAmT-mG/+;albCre1 mice.
(A) Increased abundance of newborn hepatocyte lineages during maintenance on hepatotoxic diet. Adult (P56 - P63) mice were initiated on CDE diet at time 0 and were harvested in triplicate at 0 (controls), 5, and 7 days. Graph shows values for each animal. (B-G) Abundance of newborn hepatocyte lineages in developing (P28, panels B,C), resting adult (P63, panels D,E), and regenerating adult (2/3-hepatectomy at P63, harvest at P66, panels F,G) mice. Yellow arrows indicate “noticeably red” newborn hepatocytes in panels B, D, and F. Hepatocytes 0-2 days old based on the chronometer (e.g., red arrowheads), are redder than those 2-4 days old (e.g., orange arrowheads) in panels C, E, and G. At bottom of each pair of panels, the average frequency (f) of newborn hepatocytes (≤ 4 days old; mean ± s.e.m.) is indicated from the specified number of animals (n). Scale bars 100 μmeters.
Next, we used ROSAmT-mG/+;albCre1 mice to quantify the percentages of hepatocytes on newborn lineages in juvenile liver undergoing developmental growth and in regenerating adult liver three-days after partial hepatectomy (Fig. 5B-G). Whereas 0.076% of all hepatocytes in resting adult livers were newborn, as evidenced by tdT fluorescence in their outer membranes (Fig. 5D, E), during developmental growth (Fig. 5B, C) or regeneration (Fig. 5F, G), 0.28% or 0.65% of all hepatocytes, respectively, were newborn. This indicates that birth of new hepatocyte lineages contributes to liver maintenance, development, and regeneration in post-natal animals, and that this contribution varies between each of these conditions.
Discussion
Although it is known that liver contains a small population of stem cells, measurement of pre-hepatocyte cell contributions to normal postnatal liver physiology has proven difficult. The current study used the “chronometer” provided by the intrinsic fluorescent protein accumulation and turnover kinetics following conversion of the ROSAmT-mG marker allele (22), in combination with a “trigger” provided by differentiation-induced expression of albCre (30), to quantify the representation of hepatocytes arising anew from Alb-naïve cells in mouse livers. Using this system, we were able, for the first time, to quantify the contributions of birth of new hepatocyte lineages to growth, maintenance, and regeneration of normal mouse liver.
Resting adult livers contained a steady-state level of 0.076% hepatocytes that were born within the previous four days. Since hepatocytes are proliferative, the newborn hepatocytes detected in this study are each expected to give rise to a lineage, which may proliferate to contain many cells before it expires or senesces. Although we do not yet know how many replicative cycles a typical hepatocyte lineage might undergo before it expires, if they were able to undergo six consecutive proliferative cycles before extinction, for example, then each newborn hepatocyte lineage would eventually yield 64 hepatocytes. In this scenario, sufficient new hepatocyte lineages would be born every four days in resting adults to replace 4.8% (64 × 0.076%) of the liver, which is a substantial rate of hepatocyte lineage turnover. Thus, the apparently subtle rate of birth of new hepatocyte lineages reported here likely translates into a substantial contribution to the liver’s cellular dynamics and represents an unexpected level of genome renewal from Alb-naïve precursors in this organ.
The system employed here measures only birth of new hepatocyte lineages from Alb-naïve lineages. By contrast, some oval cells express low levels of Alb (20, 40-42), and thus may represent a pre-hepatocyte cell-type whose contributions would not have been detected here. Most studies that have characterized oval cells have used either diseased states, such as cirrhotic and/or cancerous human livers, or have augmented oval cell populations in rodent livers with hepatotoxic treatments (20, 40-43). Importantly, “resident” pre-hepatocyte cells in normal livers have gene expression characteristics that are distinct from those in oval cells under conditions that induce their increased abundance. For example, Gleiberman et al. (2005) showed that in normal resting or regenerating mouse livers, pre-hepatocytes express a nestin-GFP transgene that is not expressed in the more abundant oval cells induced by hepatotoxic treatments in these mice (21). Also, pre-hepatocyte cells in normal developing livers (20), as well as resident pre-hepatocyte cells in unmanipulated adult livers (19) do not express Alb. It has been suggested there may be different levels of maturation within the pre-hepatocyte cell population, with cells expressing Alb representing a more “mature” stage (19). Other approaches will be needed to measure contributions from cell sub-populations that are not Alb-naïve. However, the birthrates we report here, even if possibly underestimated for these reasons, are substantial and will necessarily modify models of hepatocyte lineage life histories. For example, we are unaware of any previous reports showing that birth of new hepatocyte lineages contributes to maintenance of normal adult liver homeostasis. The observation that new hepatocyte lineages are continuously being born under steady-state conditions (i.e., unmanipulated adult, no liver growth) implies that existing lineages must also be dying and are not, as current models suggest, indefinitely self-renewing (2). A picture is emerging of a largely overlooked hepatocyte lineage life history that involves birth from pre-hepatocyte cells, multiple rounds of replication, and eventual death of the lineage.
Supplementary Material
Figure 06.
Acknowledgements
We thank J. Prigge, M. Rollins, C. Weisend, and E. Suvorova for their contributions to this study, and M. Jutila for the Monts-4 monoclonal antibody.
Footnotes
This work was supported by grants from the US National Institutes of Health. SVI and EES were supported in part by the Montana Agricultural Experiment Station. KMC was supported by an Undergraduate Summer Research Fellowship from the National Science Foundation. Infrastructure support was provided by a National Institutes of Health COBRE grant to VMB.
In this paper, genetic loci are designated as lower-case italics and genetic quality follows as a superscript, with each allele separated by a slash. A “+” designates a wild-type allele. For arbitrarily inserted transgenes, a superscript of “2”, “1”, or “0” is used to indicate whether animals contain the transgene on two-, one-, or no-chromosomes. A semicolon separates designations for different genetic loci. For example, a ROSAmT-mG/+;albCre0 mouse is heterozygous for the mT-mG allele of the ROSA locus and does not have an albCre transgene.
The authors have no conflicts of interest.
References
- 1.Melchiorri C, Chieco P, Zedda AI, Coni P, Ledda-Columbano GM, Columbano A. Ploidy and nuclearity of rat hepatocytes after compensatory regeneration or mitogen-induced liver growth. Carcinogenesis. 1993;14:1825–1830. doi: 10.1093/carcin/14.9.1825. [DOI] [PubMed] [Google Scholar]
- 2.Oertel M, Shafritz DA. Stem cells, cell transplantation and liver repopulation. Biochim Biophys Acta. 2008;1782:61–74. doi: 10.1016/j.bbadis.2007.12.004. [DOI] [PMC free article] [PubMed] [Google Scholar]
- 3.Rollins MF, van der Heide DM, Weisend CM, Kundert JA, Comstock KM, Suvorova ES, Capecchi MR, et al. Hepatocytes lacking thioredoxin reductase 1 have normal replicative potential during development and regeneration. J Cell Sci. 2010;123:2402–2412. doi: 10.1242/jcs.068106. [DOI] [PMC free article] [PubMed] [Google Scholar]
- 4.Paul J, Conkle D, Freshney RI. Erythropooietic cell population changes in the hepatic phase of erthropoiesis in the foetal mouse. Cell Prolif. 1969;2:283–294. [Google Scholar]
- 5.Zaret KS. Liver specification and early morphogenesis. Mech Dev. 2000;92:83–88. doi: 10.1016/s0925-4773(99)00326-3. [DOI] [PubMed] [Google Scholar]
- 6.Schmidt EE, Schibler U. Cell size regulation, a mechanism that controls cellular RNA accumulation: consequences on regulation of the ubiquitous transcription factors Oct1 and NF-Y and the liver-enriched transcription factor DBP. J Cell Biol. 1995;128:467–483. doi: 10.1083/jcb.128.4.467. [DOI] [PMC free article] [PubMed] [Google Scholar]
- 7.Martins PN, Theruvath TP, Neuhaus P. Rodent models of partial hepatectomies. Liver Int. 2008;28:3–11. doi: 10.1111/j.1478-3231.2007.01628.x. [DOI] [PubMed] [Google Scholar]
- 8.Michalopoulos GK. Liver regeneration. J Cell Physiol. 2007;213:286–300. doi: 10.1002/jcp.21172. [DOI] [PMC free article] [PubMed] [Google Scholar]
- 9.Higgins GM, Anderson RM. Experimental pathology of the liver: Restoration of the liver of the white rat following partial surgical removal. Arch. Pathol. 1931;12:186–202. [Google Scholar]
- 10.Mitchell C, Willenbring H. A reproducible and well-tolerated method for 2/3 partial hepatectomy in mice. Nat Protoc. 2008;3:1167–1170. doi: 10.1038/nprot.2008.80. [DOI] [PubMed] [Google Scholar]
- 11.Wang X, Foster M, Al-Dhalimy M, Lagasse E, Finegold M, Grompe M. The origin and liver repopulating capacity of murine oval cells. Proc Natl Acad Sci U S A. 2003;100(Suppl 1):11881–11888. doi: 10.1073/pnas.1734199100. [DOI] [PMC free article] [PubMed] [Google Scholar]
- 12.Snykers S, De Kock J, Rogiers V, Vanhaecke T. In vitro differentiation of embryonic and adult stem cells into hepatocytes: state of the art. Stem Cells. 2009;27:577–605. doi: 10.1634/stemcells.2008-0963. [DOI] [PMC free article] [PubMed] [Google Scholar]
- 13.Dabeva MD, Shafritz DA. Hepatic stem cells and liver repopulation. Semin Liver Dis. 2003;23:349–362. doi: 10.1055/s-2004-815562. [DOI] [PubMed] [Google Scholar]
- 14.Shafritz DA, Oertel M, Menthena A, Nierhoff D, Dabeva MD. Liver stem cells and prospects for liver reconstitution by transplanted cells. Hepatology. 2006;43:S89–98. doi: 10.1002/hep.21047. [DOI] [PubMed] [Google Scholar]
- 15.Shafritz DA, Oertel M. Model systems and experimental conditions that lead to effective repopulation of the liver by transplanted cells. Int J Biochem Cell Biol. 2010 doi: 10.1016/j.biocel.2010.01.013. [DOI] [PMC free article] [PubMed] [Google Scholar]
- 16.Oertel M, Menthena A, Chen YQ, Teisner B, Jensen CH, Shafritz DA. Purification of fetal liver stem/progenitor cells containing all the repopulation potential for normal adult rat liver. Gastroenterology. 2008;134:823–832. doi: 10.1053/j.gastro.2008.01.007. [DOI] [PubMed] [Google Scholar]
- 17.Davies RA, Knight B, Tian YW, Yeoh GC, Olynyk JK. Hepatic oval cell response to the choline-deficient, ethionine supplemented model of murine liver injury is attenuated by the administration of a cyclo-oxygenase 2 inhibitor. Carcinogenesis. 2006;27:1607–1616. doi: 10.1093/carcin/bgi365. [DOI] [PubMed] [Google Scholar]
- 18.Shupe TD, Piscaglia AC, Seh-Hoon O, Gasbarrini A, Petersen BE. Isolation and characterization of hepatic stem cells, or “oval cells,” from rat livers. In: Audet J, Stanford WL, editors. Stem cells in regenerative medicine: Methods and protocols. Vol. 482. Humana Press; 2009. pp. 387–405. [DOI] [PMC free article] [PubMed] [Google Scholar]
- 19.Sahin MB, Schwartz RE, Buckley SM, Heremans Y, Chase L, Hu WS, Verfaillie CM. Isolation and characterization of a novel population of progenitor cells from unmanipulated rat liver. Liver Transpl. 2008;14:333–345. doi: 10.1002/lt.21380. [DOI] [PubMed] [Google Scholar]
- 20.Tian YW, Smith PG, Yeoh GC. The oval-shaped cell as a candidate for a liver stem cell in embryonic, neonatal and precancerous liver: identification based on morphology and immunohistochemical staining for albumin and pyruvate kinase isoenzyme expression. Histochem Cell Biol. 1997;107:243–250. doi: 10.1007/s004180050109. [DOI] [PubMed] [Google Scholar]
- 21.Gleiberman AS, Encinas JM, Mignone JL, Michurina T, Rosenfeld MG, Enikolopov G. Expression of nestin-green fluorescent protein transgene marks oval cells in the adult liver. Dev Dyn. 2005;234:413–421. doi: 10.1002/dvdy.20536. [DOI] [PMC free article] [PubMed] [Google Scholar]
- 22.Muzumdar MD, Tasic B, Miyamichi K, Li L, Luo L. A global double-fluorescent Cre reporter mouse. Genesis. 2007;45:593–605. doi: 10.1002/dvg.20335. [DOI] [PubMed] [Google Scholar]
- 23.Badea TC, Wang Y, Nathans J. A noninvasive genetic/pharmacologic strategy for visualizing cell morphology and clonal relationships in the mouse. J Neurosci. 2003;23:2314–2322. doi: 10.1523/JNEUROSCI.23-06-02314.2003. [DOI] [PMC free article] [PubMed] [Google Scholar]
- 24.Suvorova ES, Lucas O, Weisend CM, Rollins MF, Merrill GF, Capecchi MR, Schmidt EE. Cytoprotective Nrf2 pathway is induced in chronically txnrd 1-deficient hepatocytes. PLoS One. 2009;4:e6158. doi: 10.1371/journal.pone.0006158. [DOI] [PMC free article] [PubMed] [Google Scholar]
- 25.Akhurst B, Croager EJ, Farley-Roche CA, Ong JK, Dumble ML, Knight B, Yeoh GC. A modified choline-deficient, ethionine-supplemented diet protocol effectively induces oval cells in mouse liver. Hepatology. 2001;34:519–522. doi: 10.1053/jhep.2001.26751. [DOI] [PubMed] [Google Scholar]
- 26.Weisend CM, Kundert JA, Suvorova ES, Prigge JR, Schmidt EE. Cre activity in fetal albCre mouse hepatocytes: Utility for developmental studies. Genesis. 2009;47:789–792. doi: 10.1002/dvg.20568. [DOI] [PMC free article] [PubMed] [Google Scholar]
- 27.Parviz F, Matullo C, Garrison WD, Savatski L, Adamson JW, Ning G, Kaestner KH, et al. Hepatocyte nuclear factor 4alpha controls the development of a hepatic epithelium and liver morphogenesis. Nat Genet. 2003;34:292–296. doi: 10.1038/ng1175. [DOI] [PubMed] [Google Scholar]
- 28.Jutila MA, Berg EL, Kroese FG, Rott L, Perry V, Butcher EC. In vivo distribution and characterization of two novel mononuclear phagocyte differentiation antigens in mice. J Leukoc Biol. 1993;54:30–39. doi: 10.1002/jlb.54.1.30. [DOI] [PubMed] [Google Scholar]
- 29.Soriano P. Generalized lacZ expression with the ROSA26 Cre reporter strain. Nat Genet. 1999;21:70–71. doi: 10.1038/5007. [DOI] [PubMed] [Google Scholar]
- 30.Postic C, Shiota M, Niswender KD, Jetton TL, Chen Y, Moates JM, Shelton KD, et al. Dual roles for glucokinase in glucose homeostasis as determined by liver and pancreatic beta cell-specific gene knock-outs using Cre recombinase. J Biol Chem. 1999;274:305–315. doi: 10.1074/jbc.274.1.305. [DOI] [PubMed] [Google Scholar]
- 31.Katz NR. Metabolic heterogeneity of hepatocytes across the liver acinus. J Nutr. 1992;122:843–849. doi: 10.1093/jn/122.suppl_3.843. [DOI] [PubMed] [Google Scholar]
- 32.Braeuning A, Schwarz M. beta-Catenin as a multilayer modulator of zonal cytochrome P450 expression in mouse liver. Biol Chem. 2010;391:139–148. doi: 10.1515/bc.2010.012. [DOI] [PubMed] [Google Scholar]
- 33.Murakami T, Yasuda Y, Mita S, Maeda S, Shimada K, Fujimoto T, Araki S. Prealbumin gene expression during mouse development studied by in situ hybridization. Cell Differ. 1987;22:1–9. doi: 10.1016/0045-6039(87)90408-8. [DOI] [PubMed] [Google Scholar]
- 34.Nayak NC, Mital I. The dynamics of alpha-fetoprotein and albumin synthesis in human and rat liver during normal ontogeny. Am J Pathol. 1977;86:359–374. [PMC free article] [PubMed] [Google Scholar]
- 35.Shiojiri N, Lemire JM, Fausto N. Cell lineages and oval cell progenitors in rat liver development. Cancer Res. 1991;51:2611–2620. [PubMed] [Google Scholar]
- 36.Dabeva MD, Alpini G, Hurston E, Shafritz DA. Models for hepatic progenitor cell activation. Proc Soc Exp Biol Med. 1993;204:242–252. doi: 10.3181/00379727-204-43660. [DOI] [PubMed] [Google Scholar]
- 37.Yeoh GC, Morgan EH. Albumin and transferrin synthesis during development in the rat. Biochem J. 1974;144:215–224. doi: 10.1042/bj1440215. [DOI] [PMC free article] [PubMed] [Google Scholar]
- 38.Knight B, Akhurst B, Matthews VB, Ruddell RG, Ramm GA, Abraham LJ, Olynyk JK, et al. Attenuated liver progenitor (oval) cell and fibrogenic responses to the choline deficient, ethionine supplemented diet in the BALB/c inbred strain of mice. J Hepatol. 2007;46:134–141. doi: 10.1016/j.jhep.2006.08.015. [DOI] [PubMed] [Google Scholar]
- 39.Tirnitz-Parker JE, Tonkin JN, Knight B, Olynyk JK, Yeoh GC. Isolation, culture and immortalisation of hepatic oval cells from adult mice fed a choline-deficient, ethionine-supplemented diet. Int J Biochem Cell Biol. 2007;39:2226–2239. doi: 10.1016/j.biocel.2007.06.008. [DOI] [PubMed] [Google Scholar]
- 40.Ruck P, Xiao JC, Pietsch T, Von Schweinitz D, Kaiserling E. Hepatic stem-like cells in hepatoblastoma: expression of cytokeratin 7, albumin and oval cell associated antigens detected by OV-1 and OV-6. Histopathology. 1997;31:324–329. doi: 10.1046/j.1365-2559.1997.2750870.x. [DOI] [PubMed] [Google Scholar]
- 41.Xiao JC, Jin XL, Ruck P, Adam A, Kaiserling E. Hepatic progenitor cells in human liver cirrhosis: immunohistochemical, electron microscopic and immunofluorencence confocal microscopic findings. World J Gastroenterol. 2004;10:1208–1211. doi: 10.3748/wjg.v10.i8.1208. [DOI] [PMC free article] [PubMed] [Google Scholar]
- 42.Xiao JC, Ruck P, Adam A, Wang TX, Kaiserling E. Small epithelial cells in human liver cirrhosis exhibit features of hepatic stem-like cells: immunohistochemical, electron microscopic and immunoelectron microscopic findings. Histopathology. 2003;42:141–149. doi: 10.1046/j.1365-2559.2003.01544.x. [DOI] [PubMed] [Google Scholar]
- 43.Xiao JC, Ruck P, Kaiserling E. Small epithelial cells in extrahepatic biliary atresia: electron microscopic and immunoelectron microscopic findings suggest a close relationship to liver progenitor cells. Histopathology. 1999;35:454–460. doi: 10.1046/j.1365-2559.1999.035005454.x. [DOI] [PubMed] [Google Scholar]
Associated Data
This section collects any data citations, data availability statements, or supplementary materials included in this article.


