

Summary
Background
Guidelines differ about the value of assessment of adiposity measures for cardiovascular disease risk prediction when information is available for other risk factors. We studied the separate and combined associations of body-mass index (BMI), waist circumference, and waist-to-hip ratio with risk of first-onset cardiovascular disease.
Methods
We used individual records from 58 cohorts to calculate hazard ratios (HRs) per 1 SD higher baseline values (4·56 kg/m2 higher BMI, 12·6 cm higher waist circumference, and 0·083 higher waist-to-hip ratio) and measures of risk discrimination and reclassification. Serial adiposity assessments were used to calculate regression dilution ratios.
Results
Individual records were available for 221 934 people in 17 countries (14 297 incident cardiovascular disease outcomes; 1·87 million person-years at risk). Serial adiposity assessments were made in up to 63 821 people (mean interval 5·7 years [SD 3·9]). In people with BMI of 20 kg/m2 or higher, HRs for cardiovascular disease were 1·23 (95% CI 1·17–1·29) with BMI, 1·27 (1·20–1·33) with waist circumference, and 1·25 (1·19–1·31) with waist-to-hip ratio, after adjustment for age, sex, and smoking status. After further adjustment for baseline systolic blood pressure, history of diabetes, and total and HDL cholesterol, corresponding HRs were 1·07 (1·03–1·11) with BMI, 1·10 (1·05–1·14) with waist circumference, and 1·12 (1·08–1·15) with waist-to-hip ratio. Addition of information on BMI, waist circumference, or waist-to-hip ratio to a cardiovascular disease risk prediction model containing conventional risk factors did not importantly improve risk discrimination (C-index changes of −0·0001, −0·0001, and 0·0008, respectively), nor classification of participants to categories of predicted 10-year risk (net reclassification improvement −0·19%, −0·05%, and −0·05%, respectively). Findings were similar when adiposity measures were considered in combination. Reproducibility was greater for BMI (regression dilution ratio 0·95, 95% CI 0·93–0·97) than for waist circumference (0·86, 0·83–0·89) or waist-to-hip ratio (0·63, 0·57–0·70).
Interpretation
BMI, waist circumference, and waist-to-hip ratio, whether assessed singly or in combination, do not importantly improve cardiovascular disease risk prediction in people in developed countries when additional information is available for systolic blood pressure, history of diabetes, and lipids.
Funding
British Heart Foundation and UK Medical Research Council.
Introduction
National and international guidelines have provided differing recommendations about the value of clinical measures of adiposity for prediction of cardiovascular disease risk in primary prevention.1 Recommendations range from omission of adiposity measures, to inclusion of such measures as additional screening tests, to formal inclusion of such measures as risk factors in prediction models. For example, whereas WHO2 and the US National Heart, Lung and Blood Institute3 recommend assessment of both body-mass index (BMI) and waist circumference in people with a BMI of 25·0–34·9 kg/m2, several often used cardiovascular disease risk scores omit adiposity measures (eg, Framingham, SCORE, PROCAM, Reynolds), but others include BMI (eg, QRISK).4
This divergence in guideline recommendations might, in part, indicate uncertainties in relation to data from previous studies. For example, in a large multinational retrospective case-control study, waist-to-hip ratio was three times more strongly related to risk of acute myocardial infarction than was BMI.5 However, these suggestions have not been tested by powerful prospective studies with assessment of BMI, waist circumference, and waist-to-hip ratio in the same people.6–12 Prospective studies of adiposity have often lacked concomitant measurement of lipids and other conventional risk factors, which has impeded assessment of adiposity measures in the context of standard risk prediction scores.8,13 Furthermore, because studies have often reported on measures of association (such as relative risks) rather than on specific measures of predictive ability (eg, measures of risk discrimination and reclassification), they might not have been able to make an optimum assessment of predictive ability (as opposed to aetiological importance).14,15 Finally, reliable comparison of the long-term reproducibility of BMI, waist circumference, and waist-to-hip ratio has been lacking.
The objective of this report was to analyse individual data from 221 934 participants in 58 prospective studies to produce reliable estimates of associations of BMI, waist circumference, and waist-to-hip ratio with first-onset cardiovascular disease outcomes. We quantified the incremental gain in cardiovascular disease prediction with these adiposity measures, singly and in combination, under a wide range of circumstances. We also compared the reproducibility of adiposity measures by use of serial measurements taken over several years in up to 63 821 people.
Methods
Study design
Details of the Emerging Risk Factors Collaboration have been described previously.16–19 This analysis involved individual records from 58 prospective studies with the following four features (webappendix pp 12 and 27–30): (1) participants were not selected on the basis of having previous vascular disease; (2) concomitant information was provided at baseline for weight, height, and waist and hip circumference; (3) cause-specific mortality or vascular morbidity, or both, were recorded by use of well defined criteria; and (4) at least 1 year of follow-up had been accrued. In registration of fatal outcomes, all contributing studies used codings from the International Classification of Diseases to at least three digits (or used study-specific classification systems), and ascertainment was based on death certificates. 43 of the 58 contributing studies also used medical records, autopsy findings, and other supplementary sources to help classify deaths. 50 studies used definitions of myocardial infarction based on WHO criteria. 43 studies reported diagnosis of strokes on the basis of brain imaging, and attributed stroke subtype.
This study was approved by the Cambridgeshire ethics review committee.
Statistical analysis
We assessed BMI, waist circumference, and waist-to-hip ratio in relation to three fatal or first-ever non-fatal outcomes: coronary heart disease; ischaemic stroke; and coronary heart disease and any cerebrovascular disease (ie, cardiovascular disease). Because waist-to-height ratio was highly correlated with waist circumference (r=0·95, 95% CI 0·94–0·96), waist-to-height ratio was not reported separately. Analyses were done in two stages by use of estimates of association calculated separately within each study before pooling across studies by random-effects meta-analysis.20 Hazard ratios (HRs) were calculated with Cox proportional hazard regression models, stratified by sex, with censoring of deaths from non-cardiovascular disease causes. The proportional hazards assumptions were met. To avoid overfitting of the statistical models, studies with fewer than ten incident cases of an outcome were excluded from analysis of that particular outcome (although such studies were able to contribute full data for analyses of cross-sectional correlates of adiposity measures). Participants contributed only first non-fatal outcome or death recorded at age 40 years or older (ie, deaths preceded by non-fatal coronary heart disease or stroke were not included). For the four contributing individually matched nested case-control studies within prospective cohorts, odds ratios were calculated with conditional logistic regression models.
To characterise shapes of associations, study-specific HRs calculated within overall quantiles of baseline adiposity values were pooled on a log scale by multivariate random-effects meta-analysis and plotted against mean values of the relevant adiposity measure within each quantile. We estimated 95% CIs from the variances that correspond to the amount of information underlying each group (including the reference group).21 In the figures presented, sizes of data markers are proportional to the inverse of the variance of the log HRs. Since associations were nearly log-linear (except at low values of BMI), we calculated HRs associated with 1 SD higher baseline value: 4·56 kg/m2 higher BMI, 12·6 cm higher waist circumference, and 0·083 higher waist-to-hip ratio. We also calculated HRs with clinically defined categories of BMI and waist circumference in combination. We investigated effect-modification with formal tests of interaction, and calculated p values for interaction with continuous variables, when appropriate. Diversity between studies was investigated by grouping studies with recorded characteristics and meta-regression. HRs were initially adjusted for age, sex, and smoking status only. To explore potential biological pathways underlying associations, HRs were further adjusted for systolic blood pressure, history of diabetes, and total and HDL cholesterol. Extent of heterogeneity was indicated by the I2 statistic.22 Regression dilution ratios were obtained by regression of serial measurements of the relevant characteristic on baseline values. For cardiovascular disease risk prediction models, a single Cox model, stratified by study and sex, was derived with baseline values of risk factors. Resulting predictions were assessed by use of measures of discrimination for censored time-to-event data (Harrell's C-index),23 and net reclassification improvement and integrated discrimination improvement was calculated by use of four standard 10-year risk categories (<5%, 5% to <10%, 10% to <20%, and ≥20%).24 The C-index and its changes were calculated in two stages, first with estimation within each study and then pooled with meta-analysis techniques. Analyses were done with Stata (version 11.0), and two-sided p values and 95% CIs are presented.
Role of the funding source
The sponsor of the study did not participate in the study design, data collection, data analysis, data interpretation, or writing of the report. DW and JD had full access to all data in the study and had final responsibility to submit the report for publication.
Results
Individual records were available for 221 934 participants who had no known history of cardiovascular disease (ie, myocardial infarction, angina, or stroke, as ascertained in each study) at the baseline examination. 155 938 (70%) of these participants also had data on smoking status, systolic blood pressure, history of diabetes, and total and HDL cholesterol. Mean age of participants at baseline was 58 years (SD 9), 124 189 (56%) were women, and 129 326 (58%) were in Europe, 73 707 (33%) were in North America, 9204 (4%) were in Australia, and 9697 (4%) were in Japan (webappendix pp 3–7).
Adiposity measures had broadly similar distributions across studies and were approximately linearly associated with one another across the range of values (webappendix p 13). Correlation coefficients adjusted for age and sex were 0·85 (95% CI 0·84–0·86) between BMI and waist circumference, 0·43 (0·40–0·45) between BMI and waist-to-hip ratio, and 0·70 (0·68–0·72) between waist circumference and waist-to-hip ratio. Mean adiposity values generally increased with the age of participants until about 55–75 years, then flattened or declined in participants older than 75 years (webappendix p 13). Adiposity measures were higher in people with a history of diabetes, were positively associated with non-HDL cholesterol, apolipoprotein B, triglyceride, fibrinogen, C-reactive protein, and systolic blood pressure, and were inversely associated with HDL cholesterol and apolipoprotein AI (webappendix pp 8–9 and 14–15). Systolic blood pressure, non-HDL cholesterol, HDL cholesterol, triglyceride, and C-reactive protein had similar associations with waist circumference or waist-to-hip ratio across BMI values (webappendix p 16). People with a history of diabetes had higher mean waist circumference and waist-to-hip ratio than did people without diabetes across the range of BMI values (webappendix p 17). Serial adiposity assessments done in up to 63 821 people (mean interval 5·7 years [SD 3·9]) were used to calculate regression dilution ratios adjusted for age and sex: 0·95 (95% CI 0·93–0·97) for BMI, 0·86 (0·83–0·89) for waist circumference, 0·88 (0·85–0·91) for hip circumference, 0·63 (0·57–0·70) for waist-to-hip ratio, 0·63 (0·59–0·67) for non-HDL cholesterol, and 0·57 (0·52–0·61) for systolic blood pressure. On the basis of these regression dilution ratios, reproducibility of BMI was higher than that for waist circumference or waist-to-hip ratio. Between-study heterogeneity for the reproducibility in BMI and waist circumference was modest, whereas the corresponding heterogeneity for waist-to-hip ratio was substantial (I2=99%; webappendix p 18).
During 1·87 million person-years at risk (median 5·7 years to first outcome, IQR 3·0–9·0), we recorded 14 297 first-ever outcomes: 8290 coronary heart disease outcomes (4982 non-fatal myocardial infarctions and 3308 coronary heart disease deaths), 2906 incident ischaemic stroke outcomes (2763 non-fatal and 143 fatal outcomes), 596 haemorrhagic stroke outcomes, 2070 unclassified stroke outcomes, and 435 other cerebrovascular outcomes (webappendix pp 3–4). In analyses adjusted for age, sex, and smoking status only, we recorded nearly log-linear associations of BMI, waist circumference, and waist-to-hip ratio with risk of coronary heart disease and ischaemic stroke, except at low BMI values (figure 1). Associations with coronary heart disease risk were similar when clinically defined categories of BMI and waist circumference were combined (webappendix p 19).
Figure 1.
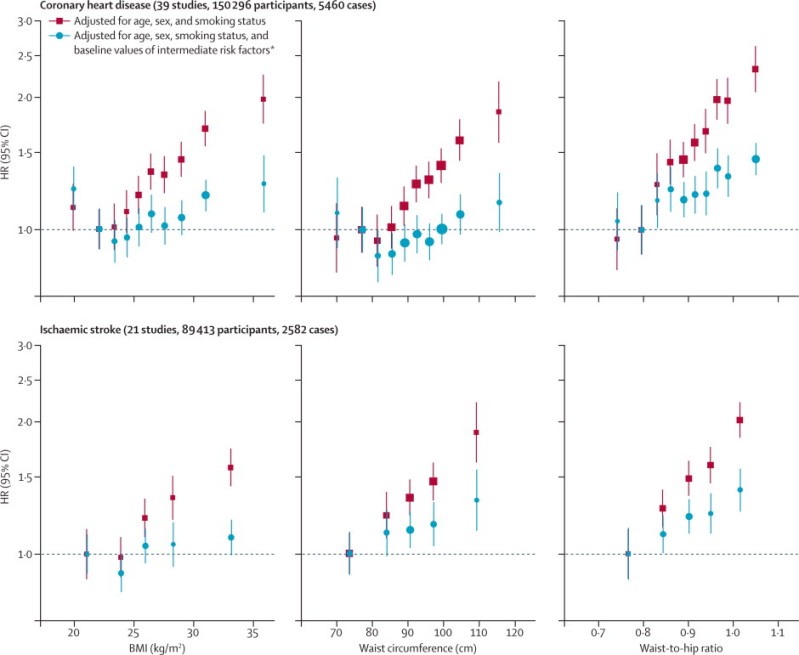
HRs for coronary heart disease and ischaemic stroke across quantiles of baseline BMI, waist circumference, and waist-to-hip ratio
Regression analyses were stratified, where appropriate, by sex. Adjusted study-specific log HRs were combined by multivariate random-effects meta-analysis. Y-axes are shown on a log scale. Reference groups are the second deciles in the plots for coronary heart disease and the first quintiles in the plots for ischaemic stroke. HR=hazard ratio. BMI=body-mass index. *Intermediate risk factors were systolic blood pressure, history of diabetes, and total and HDL cholesterol.
To account for non-linear associations at low BMI values, further analyses excluded 9355 participants (4%) with BMI of less than 20 kg/m2. After adjustment for age, sex, and smoking status, HRs for coronary heart disease and ischaemic stroke were broadly similar for BMI, waist circumference, and waist-to-hip ratio (table 1). After further adjustment for systolic blood pressure, history of diabetes, and total and HDL cholesterol, these HRs reduced substantially. HRs reduced even more after additional adjustment for C-reactive protein or fibrinogen (webappendix p 10). The excess risk of cardiovascular disease associated with BMI, waist circumference, and waist-to-hip ratio was three-to-four times stronger at age of 40–59 years than at older than 70 years, but HRs were similar in men and women (figure 2, webappendix p 20). HRs for waist circumference and waist-to-hip ratio were generally similar at different BMI values (figures 2 and 3) and triglyceride values (webappendix p 21), and HRs were slightly reduced after adjustment for BMI (figure 2). HRs were possibly higher at below-average systolic blood pressure, but otherwise did not vary substantially by clinical and demographic characteristics recorded (webappendix p 22). Heterogeneity in HRs for BMI, waist circumference, and waist-to-hip ratio (table 1) was only partly explained by the characteristics recorded (webappendix p 22). HRs did not appreciably alter after omission of the first 5 or 10 years of follow-up, but HRs decreased somewhat after correction for long-term average (usual) values of systolic blood pressure, history of diabetes, and total and HDL cholesterol (data not shown).
Table 1.
Associations of baseline values of BMI, waist circumference, and waist-to-hip ratio with risk of coronary heart disease, ischaemic stroke, and cardiovascular disease, adjusted for baseline values of confounders and intermediate risk factors
|
Adjusted for age, sex, and smoking status |
Adjusted for age, sex, smoking status, and intermediate risk factors* |
|||
|---|---|---|---|---|
| HR (95% CI) | I2 (95% CI) | HR (95% CI) | I2 (95% CI) | |
| Coronary heart disease (39 studies, 143 710 participants, 5259 cases) | ||||
| BMI | 1·29 (1·22–1·37) | 65% (52–75) | 1·11 (1·05–1·17) | 45% (20–62) |
| Waist circumference | 1·32 (1·24–1·40) | 64% (50–75) | 1·12 (1·06–1·19) | 49% (25–65) |
| Waist-to-hip ratio | 1·30 (1·22–1·38) | 65% (51–75) | 1·14 (1·09–1·18) | 14% (0–42) |
| Ischaemic stroke (21 studies, 85 169 participants, 2431 cases) | ||||
| BMI | 1·20 (1·12–1·28) | 39% (0–64) | 1·06 (0·99–1·13) | 26% (0–57) |
| Waist circumference | 1·25 (1·18–1·33) | 21% (0–54) | 1·11 (1·05–1·17) | 9% (0–43) |
| Waist-to-hip ratio | 1·25 (1·18–1·32) | 21% (0–53) | 1·14 (1·09–1·20) | 0% (0–47) |
| Cardiovascular disease (39 studies, 144 795 participants, 8347 cases) | ||||
| BMI | 1·23 (1·17–1·29) | 72% (61–79) | 1·07 (1·03–1·11) | 47% (23–64) |
| Waist circumference | 1·27 (1·20–1·33) | 69% (57–78) | 1·10 (1·05–1·14) | 49% (26–65) |
| Waist-to-hip ratio | 1·25 (1·19–1·31) | 67% (54–76) | 1·12 (1·08–1·15) | 8% (0–38) |
HRs are presented per 4·56 kg/m2 higher BMI, 12·6 cm higher waist circumference, and 0·083 higher waist-to-hip ratio (ie, 1 SD higher baseline values). HRs were adjusted as shown, and stratified, where appropriate, by sex. Analyses were restricted to participants with BMI of 20 kg/m2 or higher and complete information on age, sex, smoking status, and intermediate risk factors. HR=hazard ratio. BMI=body-mass index.
Intermediate risk factors were systolic blood pressure, history of diabetes, and total and HDL cholesterol.
Figure 2.
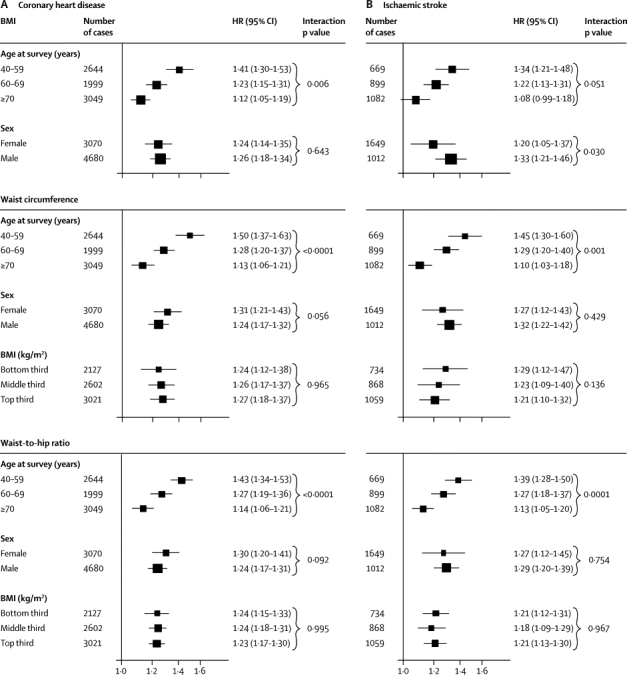
HRs for coronary heart disease (A) and ischaemic stroke (B) per 1 SD higher baseline values of BMI, waist circumference, and waist-to-hip ratio, according to age, sex, and BMI at baseline
Analyses for coronary heart disease were based on up to 203 338 participants from 51 studies, and analyses for ischaemic stroke were based on up to 122 914 participants from 25 studies. HRs are presented per 4·56 kg/m2 higher BMI, 12·6 cm higher waist circumference, and 0·083 higher waist-to-hip ratio (ie, 1 SD higher baseline values). Study-specific HRs were adjusted for age at baseline and smoking status, and stratified, where appropriate, by sex. Analyses were restricted to participants with BMI of 20 kg/m2 or higher. X-axes are shown on a log scale. p values for interaction were calculated by use of continuous values of variables, when appropriate. HRs for coronary heart disease, initially adjusted for age, sex, and smoking status, and then additionally adjusted for BMI, were 1·31 (1·24–1·37) and 1·23 (1·15–1·32), respectively, with waist circumference, and 1·29 (1·23–1·35) and 1·21 (1·16–1·26), respectively, with waist-to-hip ratio. HRs for ischaemic stroke, initially adjusted for age, sex, and smoking status, and then additionally adjusted for BMI, were 1·26 (1·19–1·33) and 1·26 (1·16–1·36), respectively, with waist circumference, and 1·25 (1·19–1·32) and 1·18 (1·13–1·24), respectively, with waist-to-hip ratio. BMI=body-mass index. HR=hazard ratio.
Figure 3.
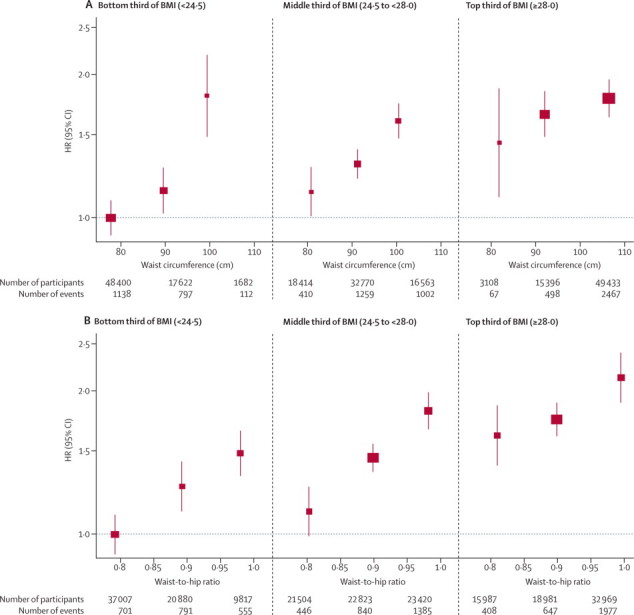
HRs for coronary heart disease across thirds of waist circumference (A) and waist-to-hip ratio (B) by baseline values of BMI
Analyses were based on 203 338 participants (7750 cases) from 51 studies. Analyses were restricted to participants with BMI of 20 kg/m2 or higher. Regression analyses were adjusted for age at baseline and smoking status, and stratified, where appropriate, by sex. Adjusted study-specific log HRs were combined by multivariate random-effects meta-analysis. Y-axes are shown on a log scale. Reference groups are the lowest third of waist circumference or waist-to-hip ratio in the bottom third of BMI. Results were similar for the full BMI range. BMI=body-mass index. HR=hazard ratio.
HRs for BMI, waist circumference, and waist-to-hip ratio recorded in the full study population were qualitatively similar to those in analyses that excluded subgroups of participants or studies: current smokers (data not shown); participants who were not of European descent (data not shown); the 29 905 participants who had only self-reported adiposity measures (data not shown); the few studies with the most discrepant findings (webappendix p 23); or the 21 139 participants known to be receiving lipid-lowering, blood-pressure-lowering, or other cardiovascular drugs at baseline (data not shown). HRs were also broadly similar in fixed-effect models to those in random-effects models (webappendix p 23), and after additional adjustment for cigarette pack-years (in addition to smoking status), alcohol consumption, or measures of socioeconomic status (data not shown). We recorded no evidence of bias due to small studies (webappendix p 24).
When information on BMI, waist circumference, or waist-to-hip ratio at baseline was added to a risk prediction model with age and sex only, the incremental gain in predictive ability was modest (figure 4). When information on adiposity measures was added to a risk prediction model without lipid information but containing information on other Framingham risk factors (age, sex, smoking status, systolic blood pressure, history of diabetes, and HDL and total cholesterol), the incremental gain in predictive value provided by a combination of BMI and waist-to-hip ratio was about a quarter of the predictive gain provided by total and HDL cholesterol (figure 5). When information on lipids and other conventional risk factors was available, additional information on BMI, waist circumference, or waist-to-hip ratio, either singly or in combination, did not appreciably change cardiovascular disease risk discrimination, according to C-index changes, nor improve reclassification of participants into predicted 10-year risk categories (table 2).
Figure 4.
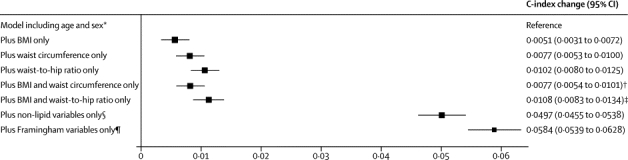
Changes in C-index for cardiovascular disease risk prediction from addition of adiposity measures or conventional risk factors to a model containing age and sex only
Analyses were based on 144 795 participants (8347 cardiovascular events) in 39 studies. Analyses were restricted to participants with BMI of 20 kg/m2 or higher. BMI=body-mass index. *Reference C-index was 0·6741 (95% CI 0·6685 to 0·6798) for the model including age and stratified by sex. †p=0·0001 for change in C-index after addition of waist circumference into the model with age, sex, and BMI. ‡p<0·0001 for change in C-index after addition of waist-to-hip ratio into the model with age, sex, and BMI. §Smoking status, systolic blood pressure, and history of diabetes. ¶Smoking status, systolic blood pressure, history of diabetes, and total and HDL cholesterol.
Figure 5.
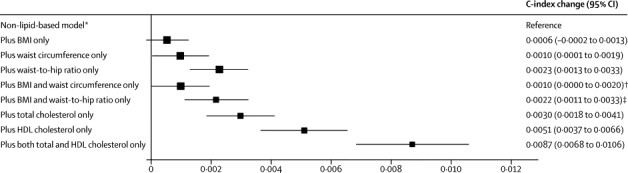
Changes in C-index for cardiovascular disease risk prediction from addition of adiposity measures or lipid markers to a non-lipid-based model
Analyses were based on 144 795 participants (8347 cardiovascular events) in 39 studies. Analyses were restricted to participants with BMI of 20 kg/m2 or higher. BMI=body-mass index. *Reference C-index was 0·7238 (95% CI 0·7186 to 0·7291) for the model including age, smoking status, systolic blood pressure, and history of diabetes, and stratified by sex. †p=0·175 for change in C-index after addition of waist circumference into the reference model plus BMI. ‡p<0·0001 for change in C-index after addition of waist-to-hip ratio into the reference model plus BMI.
Table 2.
Reclassification of 10-year predicted risk and changes in risk discrimination for cardiovascular disease after addition of adiposity measures to a model including Framingham risk score covariates
| BMI | Waist circumference | Waist-to-hip ratio | BMI and waist circumference | BMI and waist-to-hip ratio | ||
|---|---|---|---|---|---|---|
| Discrimination (39 studies, 144 795 participants, 8347 cases) | ||||||
| C-index change (95% CI)* | −0·0001 (−0·0005 to 0·0002) | −0·0001 (−0·0006 to 0·0005) | 0·0008 (0·0001 to 0·0014) | 0·0000 (−0·0005 to 0·0006) | 0·0006(0·0000 to 0·0013) | |
| p value† | 0·430 | 0·816 | 0·027 | 0·933 | 0·068 | |
| p value‡ | Reference | 0·627 | 0·006 | 0·454 | 0·009 | |
| Reclassification (20 studies, 43 944 non-cases, 4777 cases) | ||||||
| Participants who developed cardiovascular disease at 10 years | ||||||
| Appropriately reclassified | 68 (1·42%) | 111 (2·32%) | 132 (2·76%) | 106 (2·22%) | 141 (2·95%) | |
| Inappropriately reclassified | 73 (1·53%) | 110 (2·30%) | 136 (2·85%) | 116 (2·43%) | 142 (2·97%) | |
| No change | 4636 (97·05%) | 4556 (95·37%) | 4509 (94·39%) | 4555 (95·35%) | 4494 (94·08%) | |
| Participants who were event free at 10 years | ||||||
| Appropriately reclassified | 507 (1·15%) | 806 (1·83%) | 1091 (2·48%) | 856 (1·95%) | 1111 (2·53%) | |
| Inappropriately reclassified | 545 (1·24%) | 839 (1·91%) | 1078 (2·45%) | 847 (1·93%) | 1116 (2·54%) | |
| No change | 42 892 (97·61%) | 42 299 (96·26%) | 41 775 (95·06%) | 42 241 (96·12%) | 41 717 (94·93%) | |
| Net reclassification improvement (95% CI) | −0·19% (−0·70 to 0·32) | −0·05% (−0·69 to 0·58) | −0·05% (−0·76 to 0·65) | −0·19%(−0·83 to 0·45) | −0·03%(−0·75 to 0·69) | |
| p value | 0·461 | 0·867 | 0·880 | 0·562 | 0·930 | |
| Integrated discrimination improvement (95% CI) | 0·0001 (−0·0002 to 0·0003) | 0·0004 (0·0000 to 0·0007) | 0·0010 (0·0004 to 0·0015) | 0·0005 (0·0001 to 0·0008) | 0·0009 (0·0004 to 0·0015) | |
| p value | 0·654 | 0·043 | 0·0003 | 0·016 | 0·001 | |
Framingham risk score covariates include age, smoking status, systolic blood pressure, history of diabetes, and total and HDL cholesterol, and model was stratified by sex. Analyses are restricted to cohort studies and participants with BMI of 20 kg/m2 or higher. Cohort studies recording both fatal and non-fatal cardiovascular outcomes and more than 10 years of follow-up contributed to reclassification analyses. BMI=body-mass index.
Reference C-index was 0·7325 (95% CI 0·7274 to 0·7376) for the model including Framingham risk score covariates.
p value is for changes in C-index as compared with a model including Framingham risk score covariates.
p value is for changes in C-index as compared with addition of BMI alone.
To assess any incremental gain in predictive ability provided by adiposity measures, irrespective of the sequence of their addition to a risk model, we assessed the effect of omission of one risk factor at a time from a full model. Omission of BMI and waist circumference had nearly zero effect, and omission of waist-to-hip ratio had a small effect (figure 6). This result applied in analyses that either included or omitted people with history of diabetes at baseline (webappendix p 25), and for a wide range of other circumstances (webappendix p 26). Qualitatively similar results to those noted above were recorded in analyses assessing integrated discrimination improvement (table 2, webappendix p 11). We could not assess risk prediction at different ages because age distributions differed substantially between studies.
Figure 6.
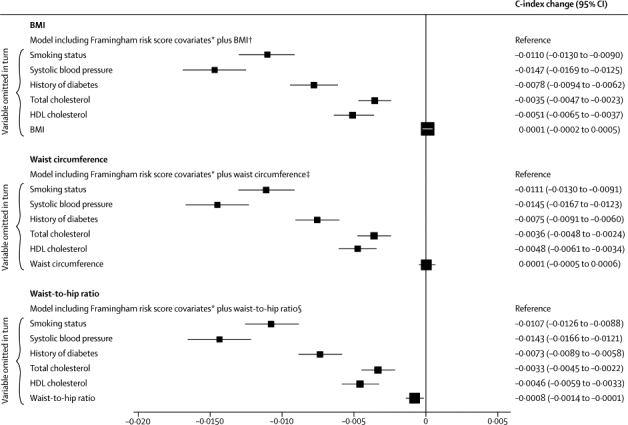
Changes in C-index for cardiovascular disease risk prediction from omission of individual risk factors from a full model containing Framingham risk score covariates plus BMI, waist circumference, or waist-to-hip ratio
Analyses were based on 144 795 participants (8347 cardiovascular events) in 39 studies. Analyses were restricted to participants with BMI of 20 kg/m2 or higher. BMI=body-mass index. *Framingham risk score covariates include age, smoking status, systolic blood pressure, history of diabetes, and total and HDL cholesterol, and model was stratified by sex. †Reference C-index of 0·7324 (95% CI 0·7272 to 0·7375). ‡Reference C-index of 0·7324 (95% CI 0·7273 to 0·7376). §Reference C-index of 0·7333 (95% CI 0·7281 to 0·7384).
Discussion
The results from our analysis of individual data from 221 934 people without initial cardiovascular disease have shown that BMI, waist circumference, or waist-to-hip ratio, assessed singly or in combination, do not importantly improve prediction of cardiovascular disease risk when additional information is available on blood pressure, history of diabetes, and cholesterol measures (panel). This finding applies to a wide range of circumstances and clinically relevant subgroups.
Panel. Research in context.
Systematic review
Findings of a previous systematic review of 27 guideline statements showed substantial variation in recommendations about the value of inclusion of clinical measures of adiposity in risk scores for the primary prevention of cardiovascular disease in developed countries.1 Recommendations range from omission of adiposity measures, to inclusion of such measures as additional screening tests, to formal inclusion of such measures as risk factors in prediction models. This lack of consensus is an indication, in part, of uncertainty in the epidemiological evidence about the predictive value of adiposity measures in the context of information on other conventional risk factors.5–12
In our investigation, individual participant data (ie, primary records) were collated and harmonised from all available relevant long-term prospective studies of cardiovascular disease, and analyses were restricted to individuals in these studies without a history of cardiovascular disease at the initial examination. These studies were identified by computerised searches of electronic databases (eg, PubMed), inspection of reference lists of relevant studies, manual searches, and discussion with investigators. The main analyses included people with concomitant information on body-mass index, waist circumference, waist-to-hip ratio, and several other conventional risk factors (ie, age, sex, blood pressure, history of diabetes, and total and HDL cholesterol).
Interpretation
The results from this study show that, whether assessed singly or in combination, body-mass index, waist circumference, and waist-to-hip ratio do not importantly improve prediction of first-onset cardiovascular disease when additional information exists on blood pressure, history of diabetes, and cholesterol measures.
The main finding of this study does not, of course, diminish the importance of adiposity as a major modifiable determinant of cardiovascular disease. Rather, because excess adiposity is a major determinant of the intermediate risk factors noted above,3 our findings underscore the importance of controlling adiposity to help prevent cardiovascular disease. These data also suggest the relevance of controlling intermediate risk factors to combat the detrimental vascular effects of overweight and obesity.25 However, the findings of our study indicate that for population-wide assessment of cardiovascular disease risk, when additional information is available on factors used in standard risk scores, simple adiposity measures provide little or no additional information on cardiovascular risk. Even so, other reasons could support inclusion of adiposity measures in risk assessment, such as promotion of behaviour change26 or improvement of risk communication. Findings of previous smaller studies (and WHO guidelines) have suggested that for situations in which no information is available on lipids for cardiovascular disease risk prediction (such as in resource-limited settings), assessment of simple adiposity measures can be used instead, with only a modest loss of predictive ability.27,28 However, data from our study indicate that a combination of BMI and waist-to-hip ratio provides only about a quarter of the extra predictive information provided by total and HDL cholesterol. The findings of our study emphasise, therefore, the desirability of supporting the development of lipid assessment in resource-poor settings.
Our findings reliably refute previous recommendations to adopt baseline waist-to-hip ratio instead of BMI as the principal clinical measure of adiposity.5 Contrary to a report from INTERHEART (a large retrospective case-control study of acute myocardial infarction) that waist-to-hip ratio is three times more strongly related to myocardial infarction than is BMI,5 we have shown that BMI, waist circumference, and waist-to-hip ratio each have a similar strength of association with cardiovascular disease risk. Indeed, the odds ratio for myocardial infarction was only 1·12 per 5 kg/m2 higher baseline BMI in INTERHEART,5 whereas the HR for coronary heart disease per 5 kg/m2 higher baseline BMI was 1·32 in our study. This discrepancy might be due to the greater susceptibility of retrospective studies of acute myocardial infarction to some biases (eg, selection biases, reverse causality) than are long-term prospective studies of people without a history of cardiovascular disease, as in our analysis. Furthermore, results from our study indicate that the long-term reproducibility of BMI is superior to that of waist-to-hip ratio (or waist circumference).
Findings from our study could provide insight into cardiovascular disease mechanisms. Measures of abdominal adiposity, such as waist circumference and waist-to-hip ratio (especially in combination with high triglyceride concentration29), might be better indicators of visceral fat accumulation and an adverse metabolic profile than is raised BMI alone, since BMI is a measure of general adiposity.30,31 Yet, our results indicate that BMI, waist circumference, and waist-to-hip ratio each have a similar strength of association with cardiovascular disease risk, including similar associations with coronary heart disease and ischaemic stroke. The similarity of effect of adiposity on coronary heart disease and ischaemic stroke contrasts with results previously reported for proatherogenic lipids (which are more strongly associated with coronary heart disease than ischaemic stroke32) and systolic blood pressure (which is more strongly related to ischaemic stroke than coronary heart disease33). Our data, therefore, underscore the potential importance of reduction of adiposity for both coronary heart disease and ischaemic stroke. We did not record any modification of the effect of abdominal adiposity on cardiovascular disease risk by BMI. By contrast, age was a strong effect-modifier, with about three-to-four times higher excess risk in early middle age than in individuals older than 70 years.34
Our study importantly extends previous analyses of prospective studies. By contrast with analyses from the Prospective Studies Collaboration (PSC)6 and the National Cancer Institute Cohort Consortium (NCICC),7 and a study of BMI in 1·1 millian Asians,35 which lacked information on waist circumference and waist-to-hip ratio, our study had concomitant data for each participant on BMI, waist circumference, and waist-to-hip ratio. By contrast with analyses from NCICC and the European Prospective Investigation into Cancer8 (EPIC), which lacked information on lipids, our study had concomitant information on lipids, blood pressure, and other conventional risk factors. The PSC, NCICC, and EPIC analyses all lacked non-fatal cardiovascular disease outcomes, whereas our study comprised 14 297 fatal or first-onset non-fatal outcomes of cardiovascular disease recorded during 1·87 million person-years at risk. Our study has twice as many cardiovascular disease outcomes than in the NCICC analysis and four times more than in the EPIC analysis, with less than 10% of data in our study overlapping with these previously published analyses. A unique feature of our study is inclusion of long-term serial assessments of BMI, waist circumference, and waist-to-hip ratio for up to 63 821 people. The generalisability of our findings, at least to populations in developed countries, is supported by broadly consistent results across 58 studies in 17 countries. Because 90% of the participants in this study were of European descent, additional studies are needed in people of non-European descent.36–38 Nevertheless, our finding that adiposity measures, whether assessed singly or in combination, do not importantly improve prediction of cardiovascular risk when additional information is available on blood pressure, history of diabetes, and lipids, should help to clarify divergent recommendations in cardiovascular disease guidelines about clinical measures of adiposity in assessment of risk.
Acknowledgments
Acknowledgments
The Emerging Risk Factors Collaboration Coordinating Centre is underpinned by a programme grant from the British Heart Foundation (RG/08/014) and grants from the UK Medical Research Council. Various sources have supported recruitment, follow-up, and laboratory measurements in the 122 cohorts contributing to the Emerging Risk Factors Collaboration. Investigators of several of these studies have contributed to a list naming some of these funding sources.
Contributors
JD and DW drafted the report. DW did the analyses, with input from SKa, EDA, and AMW. All members of the writing committee provided critical revisions. All investigators shared individual data and had opportunities to contribute to the interpretation of the results and critical revision of the report. The data management team collated and harmonised the data. All members of the coordinating centre contributed to the data collection, harmonisation, analysis, and interpretation.
The Emerging Risk Factors Collaboration
Writing Committee: David Wormser, Stephen Kaptoge*, Emanuele Di Angelantonio*, Angela M Wood*, Lisa Pennells, Alex Thompson, and Nadeem Sarwar (University of Cambridge, Cambridge, UK); Jorge R Kizer (Weill Cornell Medical College, New York, NY, USA); Debbie A Lawlor (University of Bristol, Bristol, UK); Børge G Nordestgaard (University of Copenhagen, Copenhagen, Denmark); Paul Ridker (Brigham and Women's Hospital, Boston, MA, USA); Veikko Salomaa (National Institute of Health and Welfare, Helsinki, Finland); June Stevens (University of North Carolina, Chapel Hill, NC, USA); Mark Woodward (University of Sydney, Sydney, NSW, Australia); Naveed Sattar (University of Glasgow, Glasgow, UK); Rory Collins (University of Oxford, Oxford, UK); Simon G Thompson (Medical Research Council Biostatistics Unit, Cambridge, UK); Gary Whitlock (University of Oxford, Oxford, UK); John Danesh (University of Cambridge, Cambridge, UK). *Denotes equal contribution.
Investigators: ARIC A R Folsom, L E Chambless, J Stevens; ATTICA D B Panagiotakos, C Pitsavos, C Chrysohoou, C Stefanadis; AUSDIAB R Atkins, E L M Barr, J E Shaw, P Z Zimmet; BRHS P H Whincup, S G Wannamethee, R W Morris; BRUN S Kiechl, J Willeit, F Oberhollenzer, A Mayr; BWHHS S Ebrahim, D A Lawlor; CAPS J Yarnell, J Gallacher; CHARL P J Nietert, S E Sutherland, D L Bachman, J E Keil; CHS K J Mukamal, J R Kizer, I H de Boer (see http://www.chs-nhlbi.org for acknowledgments); COPEN A Tybjærg-Hansen, B G Nordestgaard, R Frikke-Schmidt; CUORE S Giampaoli, L Palmieri, S Panico, D Vanuzzo, L Pilotto; DRECE A Gómez de la Cámara, M A Rubio; EPESENCA D G Blazer, J M Guralnik, C L Phillips; EPICNOR K-T Khaw; FINRISK-92, FINRISK-97 V Salomaa, K Harald, P Jousilahti, E Vartiainen; FRAMOFF R B D'Agostino Sr, R S Vasan, C S Fox, M J Pencina; GOH R Dankner, A Chetrit, F Lubin; GOTO13 L Wilhelmsen, H Eriksson, K Svärdsudd, L Welin; GOTO33, GOTO43 A Rosengren, L Wilhelmsen, G Lappas, H Eriksson; GOTOW C Björkelund, L Lissner, C Bengtsson; HBS T E Strandberg, V Salomaa, R S Tilvis, T A Miettinen; HISAYAMA Y Kiyohara, H Arima, Y Doi, T Ninomiya; HOORN J M Dekker, G Nijpels, C D A Stehouwer; HPFS E B Rimm, J K Pai; IKNS H Iso, A Kitamura, K Yamagishi, H Noda; LASA D Deeg, J L Poppelaars; MESA A R Folsom, B M Psaty, S Shea; MOGERAUG2, MOGERAUG3 A Döring, W Koenig, C Meisinger; MORGEN W M M Verschuren, A Blokstra, H B Bueno-de-Mesquita; MOSWEGOT L Wilhelmsen, A Rosengren, G Lappas; MRCOLD A Fletcher; NHANES III R F Gillum, M Mussolino; NHS E B Rimm, S E Hankinson, J E Manson, J K Pai; NSHS K W Davidson, S Kirkland, J A Shaffer, M R Korin; OSAKA A Kitamura, H Iso, S Sato; PREVEND S J L Bakker, R T Gansevoort, H L Hillege; PRIME P Amouyel, D Arveiler, A Evans, J Ferrières; RANCHO E Barrett-Connor, D L Wingard, R Bettencourt; ROTT J Witteman, I Kardys, H Tiemeier, A Hofman; SHHEC H Tunstall-Pedoe, R Tavendale, G D O Lowe, M Woodward; SHS B V Howard, Y Zhang, L Best, J Umans; TARFS A Onat, G Hergenç, G Can; TOYAMA H Nakagawa, M Sakurai, K Nakamura, Y Morikawa; TROMSØ I Njølstad, E B Mathiesen, M L Løchen, T Wilsgaard; ULSAM J Ärnlöv, J Sundström, U Risérus, E Ingelsson; WHI-HaBPS S Wassertheil-Smoller, J E Manson; WHITE II E Brunner, M Shipley; WHS P Ridker, J Buring.
Data Management Team: M Walker, S Watson.
Coordinating Centre: M Alexander, A S Butterworth, R Collins, E Di Angelantonio, O H Franco, P Gao, R Gobin, P Haycock, S Kaptoge, S R Kondapally Seshasai, S Lewington, L Pennells, N Sarwar, A Thompson, S G Thompson, M Walker, S Watson, I R White, A M Wood, D Wormser, J Danesh (principal investigator).
Conflicts of interest
AT has been a consultant for GlaxoSmithKline, and is now an employee of Roche. JRK and his institution have received research grants from the National Heart, Lung and Blood Institute, and diaDexus; and JRK has received payment for lectures from Merck. DAL's institution has received funding from Department of Health Policy Research Programme and the British Heart Foundation. PR's institution has received research grants from the National Institutes of Health, the National Cancer Institute, AstraZeneca, Novartis, and Merck. PR is listed as a co-inventor on patents relating to the use of inflammatory biomarkers in cardiovascular disease that are held by the Brigham and Women's Hospital and have been licensed to Siemens and AstraZeneca; and has served as a consultant to Genzyme, Vascular Biogenics, Boerringher Ingelheim, and Amylin. NSat's institution has received research grants from Allergan. RC and GW's institution has received research funding from Merck, AstraZeneca, Bristol-Myers Squibb, Schering-Plough, Novartis, Bayer, and Solvay. RC's institution has also received travel and accommodation expenses from Merck. JD has been a board member for Merck and Novartis; and has been a consultant for Novartis, Merck, GlaxoSmithKline, and Pfizer. JD's institution has received research grants from the British Heart Foundation, BUPA Foundation, Denka, diaDexus, European Union, Evelyn Trust, Fogarty International Centre, GlaxoSmithKline, Merck, National Heart, Lung and Blood Institute, National Institute of Neurological Disorders and Stroke, Novartis, Pfizer, Roche, UK Biobank, UK Medical Research Council, and Wellcome Trust. All other members of the writing committee declare that they have no conflicts of interest.
Web Extra Material
References
- 1.Ferket BS, Colkesen EB, Visser JJ. Systematic review of guidelines on cardiovascular risk assessment: which recommendations should clinicians follow for a cardiovascular health check? Arch Intern Med. 2010;170:27–40. doi: 10.1001/archinternmed.2009.434. [DOI] [PubMed] [Google Scholar]
- 2.WHO Consultation of Obesity . Obesity: preventing and managing the global epidemic. World Health Organization; Geneva, Switzerland: 2000. [PubMed] [Google Scholar]
- 3.National Institutes of Health Clinical guidelines on the identification, evaluation, and treatment of overweight and obesity in adults—the evidence report. Obes Res. 1998;6(suppl 2):51S–209S. [PubMed] [Google Scholar]
- 4.Cooney MT, Dudina AL, Graham IM. Value and limitations of existing scores for the assessment of cardiovascular risk: a review for clinicians. J Am Coll Cardiol. 2009;54:1209–1227. doi: 10.1016/j.jacc.2009.07.020. [DOI] [PubMed] [Google Scholar]
- 5.Yusuf S, Hawken S, Ôunpuu S, on behalf of the INTERHEART Study Investigators Obesity and the risk of myocardial infarction in 27 000 participants from 52 countries: a case-control study. Lancet. 2005;366:1640–1649. doi: 10.1016/S0140-6736(05)67663-5. [DOI] [PubMed] [Google Scholar]
- 6.Prospective Studies Collaboration Body-mass index and cause-specific mortality in 900 000 adults: collaborative analyses of 57 prospective studies. Lancet. 2009;373:1083–1096. doi: 10.1016/S0140-6736(09)60318-4. [DOI] [PMC free article] [PubMed] [Google Scholar]
- 7.de Gonzalez A Berrington, Hartge P, Cerhan JR. Body-mass index and mortality among 1·46 million white adults. N Engl J Med. 2010;363:2211–2219. doi: 10.1056/NEJMoa1000367. [DOI] [PMC free article] [PubMed] [Google Scholar]
- 8.Pischon T, Boeing H, Hoffmann K. General and abdominal adiposity and risk of death in Europe. N Engl J Med. 2008;359:2105–2120. doi: 10.1056/NEJMoa0801891. [DOI] [PubMed] [Google Scholar]
- 9.Canoy D, Boekholdt SM, Wareham N. Body fat distribution and risk of coronary heart disease in men and women in the European Prospective Investigation into Cancer and Nutrition in Norfolk cohort: a population-based prospective study. Circulation. 2007;116:2933–2943. doi: 10.1161/CIRCULATIONAHA.106.673756. [DOI] [PubMed] [Google Scholar]
- 10.Taylor AE, Ebrahim S, Ben-Shlomo Y. Comparison of the associations of body mass index and measures of central adiposity and fat mass with coronary heart disease, diabetes, and all-cause mortality: a study using data from 4 UK cohorts. Am J Clin Nutr. 2010;91:547–556. doi: 10.3945/ajcn.2009.28757. [DOI] [PubMed] [Google Scholar]
- 11.Kizer JR, Biggs ML, Ix JH. Measures of adiposity and future risk of ischemic stroke and coronary heart disease in older men and women. Am J Epidemiol. 2011;173:10–25. doi: 10.1093/aje/kwq311. [DOI] [PMC free article] [PubMed] [Google Scholar]
- 12.Huxley R, Mendis S, Zheleznyakov E, Reddy S, Chan J. Body mass index, waist circumference and waist:hip ratio as predictors of cardiovascular risk—a review of the literature. Eur J Clin Nutr. 2010;64:16–22. doi: 10.1038/ejcn.2009.68. [DOI] [PubMed] [Google Scholar]
- 13.Jacobs EJ, Newton CC, Wang Y. Waist circumference and all-cause mortality in a large US cohort. Arch Intern Med. 2010;170:1293–1301. doi: 10.1001/archinternmed.2010.201. [DOI] [PubMed] [Google Scholar]
- 14.Cook NR. Use and misuse of the receiver operating characteristic curve in risk prediction. Circulation. 2007;115:928–935. doi: 10.1161/CIRCULATIONAHA.106.672402. [DOI] [PubMed] [Google Scholar]
- 15.Lloyd-Jones DM. Cardiovascular risk prediction: basic concepts, current status, and future directions. Circulation. 2010;121:1768–1777. doi: 10.1161/CIRCULATIONAHA.109.849166. [DOI] [PubMed] [Google Scholar]
- 16.The Emerging Risk Factors Collaboration The Emerging Risk Factors Collaboration: analysis of individual data on lipid, inflammatory and other markers in over 1·1 million participants in 104 prospective studies of cardiovascular diseases. Eur J Epidemiol. 2007;22:839–869. doi: 10.1007/s10654-007-9165-7. [DOI] [PubMed] [Google Scholar]
- 17.The Emerging Risk Factors Collaboration C-reactive protein concentration and risk of coronary heart disease, stroke, and mortality: an individual participant meta-analysis. Lancet. 2010;375:132–140. doi: 10.1016/S0140-6736(09)61717-7. [DOI] [PMC free article] [PubMed] [Google Scholar]
- 18.The Emerging Risk Factors Collaboration Diabetes mellitus, fasting blood glucose concentration, and risk of vascular disease: a collaborative meta-analysis of 102 prospective studies. Lancet. 2010;375:2215–2222. doi: 10.1016/S0140-6736(10)60484-9. [DOI] [PMC free article] [PubMed] [Google Scholar]
- 19.Emerging Risk Factors Collaboration Diabetes mellitus, fasting glucose, and risk of cause-specific death. N Engl J Med. 2011;364:829–841. doi: 10.1056/NEJMoa1008862. [DOI] [PMC free article] [PubMed] [Google Scholar]
- 20.Thompson S, Kaptoge S, White I, Wood A, Perry P, Danesh J, and the Emerging Risk Factors Collaboration Statistical methods for the time-to-event analysis of individual participant data from multiple epidemiological studies. Int J Epidemiol. 2010;39:1345–1359. doi: 10.1093/ije/dyq063. [DOI] [PMC free article] [PubMed] [Google Scholar]
- 21.Easton D, Peto J, Babiker A. Floating absolute risk: an alternative to relative risk in survival and case-control analysis avoiding an arbitrary reference group. Stat Med. 1991;10:1025–1035. doi: 10.1002/sim.4780100703. [DOI] [PubMed] [Google Scholar]
- 22.Higgins JP, Thompson SG, Deeks JJ, Altman DG. Measuring inconsistency in meta-analyses. BMJ. 2003;327:557–560. doi: 10.1136/bmj.327.7414.557. [DOI] [PMC free article] [PubMed] [Google Scholar]
- 23.Fibrinogen Studies Collaboration Measures to assess the prognostic ability of the stratified Cox proportional hazards model. Stat Med. 2009;28:389–411. doi: 10.1002/sim.3378. [DOI] [PubMed] [Google Scholar]
- 24.Pencina MJ, D'Agostino RB, Sr, D'Agostino RB, Jr, Vasan RS. Evaluating the added predictive ability of a new marker: from area under the ROC curve to reclassification and beyond. Stat Med. 2008;27:157–172. doi: 10.1002/sim.2929. [DOI] [PubMed] [Google Scholar]
- 25.Logue J, Thompson L, Romanes F, Wilson DC, Thompson J, Sattar N. Management of obesity: summary of SIGN guideline. BMJ. 2010;340:c154. doi: 10.1136/bmj.c154. [DOI] [PubMed] [Google Scholar]
- 26.Steptoe A, Doherty S, Rink E, Kerry S, Kendrick T, Hilton S. Behavioural counselling in general practice for the promotion of healthy behaviour among adults at increased risk of coronary heart disease: randomised trial. BMJ. 1999;319:943–947. doi: 10.1136/bmj.319.7215.943. [DOI] [PMC free article] [PubMed] [Google Scholar]
- 27.Lim SS, Gaziano TA, Gakidou E. Prevention of cardiovascular disease in high-risk individuals in low-income and middle-income countries: health effects and costs. Lancet. 2007;370:2054–2062. doi: 10.1016/S0140-6736(07)61699-7. [DOI] [PubMed] [Google Scholar]
- 28.WHO . Prevention of cardiovascular disease. Guidelines for the assessment and management of total cardiovascular risk. World Health Organization; Geneva, Switzerland: 2007. [Google Scholar]
- 29.Lemieux I, Poirier P, Bergeron J. Hypertriglyceridemic waist: a useful screening phenotype in preventive cardiology? Can J Cardiol. 2007;23(suppl B):23B–31B. doi: 10.1016/s0828-282x(07)71007-3. [DOI] [PMC free article] [PubMed] [Google Scholar]
- 30.Van Gaal LF, Mertens IL, De Block CE. Mechanisms linking obesity with cardiovascular disease. Nature. 2006;444:875–880. doi: 10.1038/nature05487. [DOI] [PubMed] [Google Scholar]
- 31.Grundy SM. Obesity, metabolic syndrome, and cardiovascular disease. J Clin Endocrinol Metab. 2004;89:2595–2600. doi: 10.1210/jc.2004-0372. [DOI] [PubMed] [Google Scholar]
- 32.The Emerging Risk Factors Collaboration Major lipids, apolipoproteins, and risk of vascular disease. JAMA. 2009;302:1993–2000. doi: 10.1001/jama.2009.1619. [DOI] [PMC free article] [PubMed] [Google Scholar]
- 33.Prospective Studies Collaboration Age-specific relevance of usual blood pressure to vascular mortality: a meta-analysis of individual data for one million adults in 61 prospective studies. Lancet. 2002;360:1903–1913. doi: 10.1016/s0140-6736(02)11911-8. [DOI] [PubMed] [Google Scholar]
- 34.Stevens J, Cai J, Pamuk ER, Williamson DF, Thun MJ, Wood JL. The effect of age on the association between body-mass index and mortality. N Engl J Med. 1998;338:1–7. doi: 10.1056/NEJM199801013380101. [DOI] [PubMed] [Google Scholar]
- 35.Zheng W, McLerran DF, Rolland B. Association between body-mass index and risk of death in more than 1 million Asians. N Engl J Med. 2011;364:719–729. doi: 10.1056/NEJMoa1010679. [DOI] [PMC free article] [PubMed] [Google Scholar]
- 36.Asia Pacific Cohort Studies Collaboration Central obesity and risk of cardiovascular disease in the Asia Pacific Region. Asia Pac J Clin Nutr. 2006;15:287–292. [PubMed] [Google Scholar]
- 37.Whincup PH, Gilg JA, Papacosta O. Early evidence of ethnic differences in cardiovascular risk: cross sectional comparison of British South Asian and white children. BMJ. 2002;324:635. doi: 10.1136/bmj.324.7338.635. [DOI] [PMC free article] [PubMed] [Google Scholar]
- 38.Colin A, Adair LS, Popkin BM. Ethnic differences in the association between body mass index and hypertension. Am J Epidemiol. 2002;155:346–353. doi: 10.1093/aje/155.4.346. [DOI] [PubMed] [Google Scholar]
Associated Data
This section collects any data citations, data availability statements, or supplementary materials included in this article.