
Figure 1.
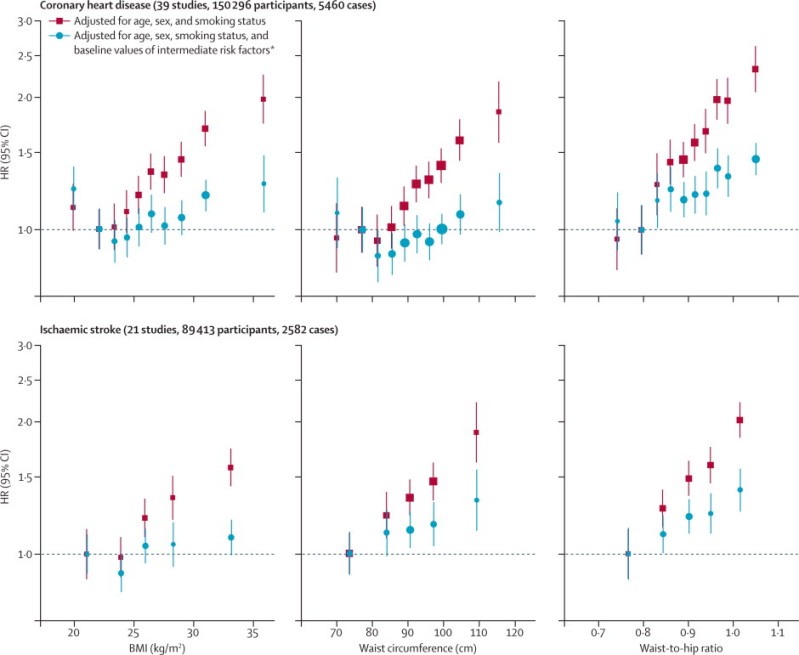
HRs for coronary heart disease and ischaemic stroke across quantiles of baseline BMI, waist circumference, and waist-to-hip ratio
Regression analyses were stratified, where appropriate, by sex. Adjusted study-specific log HRs were combined by multivariate random-effects meta-analysis. Y-axes are shown on a log scale. Reference groups are the second deciles in the plots for coronary heart disease and the first quintiles in the plots for ischaemic stroke. HR=hazard ratio. BMI=body-mass index. *Intermediate risk factors were systolic blood pressure, history of diabetes, and total and HDL cholesterol.