

Abstract
“Social value orientation” characterizes individual differences in anchoring attitudes towards the division of resources. Here, by contrasting people with prosocial and individualistic orientations using functional magnetic resonance imaging, we demonstrate that degree of inequity aversion in prosocials is predictable from amygdala activity and unaffected by cognitive load. This result suggests that automatic emotional processing in the amygdala lies at the core of prosocial value orientation.
Individual social value orientation1 determines behavior in economic games and many real-life situations2. Prosocials are defined as those who like to maximize the sum of resources for the self and the other, while simultaneously minimizing the difference between the two. By contrast, individualists like to maximize resources for the self, while competitors like to maximize the difference between the two. The question we address here is whether prosocial attitudes depend upon deliberate top-down control of selfish impulses3 or automatic inequity aversion4, and what their neural substrates are. In the former case, we would expect prosocial attitudes to be associated with greater prefrontal activity3, while the insula5,6 or amygdala7,8 would be involved in the latter case.
A behavioral task was used to identify people with different social value orientations. Subjects were paired and had to choose for themselves and their partner an option among three different patterns of money distribution (Fig. 1a), each designated as prosocial, individualistic or competitive1. (see Appendix 1 in Supplementary Information). Subjects were assigned to a category if they made at least six consistent decisions out of eight. Informed consent was obtained from all the subjects, and the protocol was approved by our institution’s ethics committee.
Figure 1.
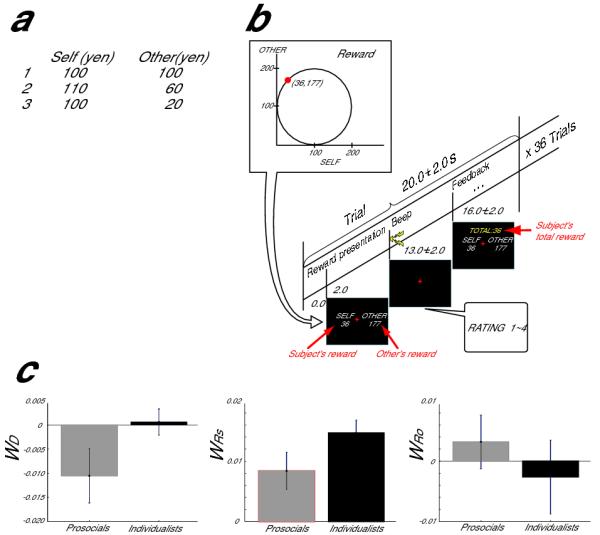
Task design and behavior. (a) Triple-Dominance measure task. Subjects chose one of three alternatives: prosocial (1), individualistic (2) and competitive (3) distributions of money between the self and the unknown other. (b) Reward pair evaluation task. (c) Comparison of model’s three regression coefficients (WD , WRs, and WRo for the absolute value or difference, the self reward and the other reward, respectively) between prosocials and individualists. For behavioral data, error bar means standard deviation over subjects.
Twenty-five prosocials and fourteen individualists proceeded to the imaging experiment (Fig. 1b, Supplementary Method). In the MRI scanner, the subjects were presented with a pair of rewards for the self and the other. They were asked to evaluate the desirability of the reward pair on four different levels (least preferable (1) to most preferable (4)) by a button press.
Each subject’s evaluation was linearly regressed with the reward for the subject (Rs), the reward for the other (Ro), and the absolute value of their difference (Da) as implicated in the theory of social value orientation1, yielding coefficients WRs, WRo, and WD, respectively (Supplementary Fig. 1). The two groups differed markedly in their response to the absolute reward difference, WD (t(34)=6.68, P<0.00001, Fig. 1c left). The prosocials disliked large absolute differences in distributions (inequity aversion), while the individualists were unaffected by such differences. In contrast individualists preferred higher self rewards ( WRS; t(34)=6.54, P<0.00001, Fig. 1c middle), but were indifferent to other rewards (WRO; Fig. 1c right).
To identify the neural substrates corresponding to these behavioral differences, we conducted a regression analysis of fMRI data at the time of reward pair presentation with three explanatory variables: the reward for the subject (Rs), the reward for the other (Ro), and the absolute value of their difference (Da) using SPM9 (Supplementary Methods) and looked for brain structures whose activity distinguished between prosocials and individualists (see Supplementary Tables 1 (Da) and 2 (Rs and Ro)).
The dorsal amygdala10 was the only area where the groups differed in the correlation of activity with the absolute value of reward difference Da (Fig. 2a, P<0.001; uncorrected). This activity was positively correlated with Da in prosocials, but slightly negatively correlated in individualists. The amygdala activity increased only in prosocials when the absolute value of reward difference Da was large (Fig. 2b, significantly positive 5 s after the reward pair onset (P<0.01) and Fig. 2c, right). The same effect was seen in the left amygdala at a lower level of significance (P<0.005; uncorrected, Supplementary Fig. 2). In addition, the activity in the amygdala predicted individual differences in how each person disliked the imbalance of reward (Da). We found a negative correlation in prosocials (P = 0.029), but not in individualists (P=0.69; Fig 2c, right).
Figure 2.

Difference between prosocials and individualists in the correlation of brain activity with the absolute value of reward difference Da. (a) coronal section of the right amygdala where the two groups showed a significant difference in correlation with the absolute value of reward difference Da. (MNI coordinates 20, −2, −12). (b) BOLD signal increase at the amygdala peak during 12 trials with the largest Das (solid line) and 12 trials with the smallest Das (dotted line) for prosocials and individualists. Time 0 specifies the presentation of reward pair. Error bar means standard deviation over subjects. (c) Left: Beta values of each prosocial (grey) and individualist (black) in correlation with Da. Right: correlation of each subject’s beta value and WD (the subject’s dislike of Da) (grey: prosocials, black: individualists). A t-test was conducted to determine whether the regression coefficient was significantly different from 0.
Several other brain structures including the insula, anterior cingulate cortex striatum and dorsolateral prefrontal cortex also showed activity correlated with the absolute value of reward difference Da, but this effect was largely driven by trials on which the reward for the other Ro was larger than the reward for the subject Rs and did not distinguish between prosocials and individualists (Supplementary Table 1, Fig. 3-7). Previous studies have implicated these regions in various aspects of decision-making11,12,13 and, more particularly, as responsive to offers that are considered to be unfair5,6. It is possible that the lack of impact of social value orientation on activity in these regions arises because they are involved with more deliberate, top-down, appraisals of outcomes that are unfair to the self3.
Since inequity aversion in the prosocials was associated with activity in amygdala and not prefrontal cortex we hypothesized that this reflected a rapid intuitive response rather than deliberation. To test this hypothesis we conducted a further behavioral experiment of the reward pair evaluation task in which we measured speed of response and applied a cognitive load to prevent the use of deliberative processes14 (Supplementary Fig. 8, Supplementary Method).
Twenty-four prosocials and eight individualists were instructed to evaluate the reward pair and press a corresponding button as soon as possible. They were also required to memorize a five-digit number sequence prior to the presentation of each reward pair and their memory was probed after each evaluation. A high load random number sequence was contrasted with a low load fixed number sequence (01234). There were no differences between the groups in their performance of the memory tasks (Supplementary Fig. 9). As in the imaging study, the prosocials displayed inequity aversion while the individualists did not (F(1,30)=12.98; P=0.0006, Fig. 3a). However, there was no effect of cognitive load on inequity aversion for the prosocials (t(23)=0.08; P=0.94, Fig. 3a). In contrast the individualists became slightly more competitive under cognitive load, showing greater dislike of higher reward to the other (paired t-test; t(7)=1.94, P<0.05, Supplementary Fig. 10b). Evaluation times were also unaffected by cognitive load (Supplementary Fig. 10c).
Figure 3.

Results of reward pair evaluation task with cognitive load. (a) Comparison of WD (the subject’s dislike of the absolute value of reward difference Da) between prosocials and individualists in unloaded (left) and loaded (right) conditions.
These results suggest that prosocial value orientation is driven by an intuitive aversion for the iniquitous division of resources. Our findings highlight an important role for automatic intuitive processing in social interaction, in addition to the slow strategic processes focused on in previous studies5-7,15 using interactive games.
Supplementary Material
ACKNOWLEDGEMENTS
We thank S. Tada and Y. Furukawa for technical assistance. This research was supported in part by the National Institute of Information and Communications Technology, and Global Center of Excellence grant from the Japanese government. MH was supported by the Royal Society and CDF is supported by the Danish National Research Foundation and the AHRC CNCC scheme AH/E511112/1.
References
- 1.Van Lange PAM. J personality and social psychology. 1999;77:337–349. [Google Scholar]
- 2.Bogaert S, Boone C, Declerck C. Br. J. Soc. Psychol. 2008;43:457–480. doi: 10.1348/014466607X244970. [DOI] [PubMed] [Google Scholar]
- 3.Knoch D, Fehr E. Ann. NY. Acad. Sci. 2007;1104:123–134. doi: 10.1196/annals.1390.004. [DOI] [PubMed] [Google Scholar]
- 4.Haidt J. Psychological Review. 2001;108:814–834. doi: 10.1037/0033-295x.108.4.814. [DOI] [PubMed] [Google Scholar]
- 5.Sanfey AG, Rilling JK, Aronson JA, Nystrom LE, Cohen JD. Science. 2003;300:1755–8. doi: 10.1126/science.1082976. [DOI] [PubMed] [Google Scholar]
- 6.Hsu M, Anen C, Quartz SR. Science. 2008;320:1092–1095. doi: 10.1126/science.1153651. [DOI] [PubMed] [Google Scholar]
- 7.Tabbnia G, Satpute AB, Lieberman MD. Pshychol Sci. 2008;19:339–347. doi: 10.1111/j.1467-9280.2008.02091.x. [DOI] [PubMed] [Google Scholar]
- 8.Adolphs R, Baron-Cohen S, Tranel D. J. Cog. Neurosci. 2002;14:1264–1274. doi: 10.1162/089892902760807258. [DOI] [PubMed] [Google Scholar]
- 9.Friston KJ, Holmes AP, Worsley K, Poline JB, Frith C, Frackowiak RSJ. Hum. Brain. Mapp. 1995;2:189–210. doi: 10.1002/(SICI)1097-0193(1996)4:2<140::AID-HBM5>3.0.CO;2-3. [DOI] [PubMed] [Google Scholar]
- 10.Whalen PJ, Davis FC, Oler JA, Kim H, Kim MJ, Neta M. In: The human amygdala. Phelps EA, Whalen PJ, editors. The Guilford Press; 2009. [Google Scholar]
- 11.Rushworth MF, Behrens TE. Nat. Neurosci. 2008;11:389–397. doi: 10.1038/nn2066. [DOI] [PubMed] [Google Scholar]
- 12.O’Doherty J, Dayan P, Schultz J, Deichmann R, Friston K, Dolan RJ. Science. 2004;304:452–454. doi: 10.1126/science.1094285. [DOI] [PubMed] [Google Scholar]
- 13.Haruno M, Kawato M. J. Neurophysiol. 2006;95:948–959. doi: 10.1152/jn.00382.2005. [DOI] [PubMed] [Google Scholar]
- 14.Valdesolo P, Desteno D. J. Exp. Soc. Psycholo. 2008;44:1224–1338. [Google Scholar]
- 15.de Quervain DJF, Fischbacher U, Treyer V, Schellhammer M, Schnyder U, Buck A, Fehr E. Science. 2004;305:1254–1258. doi: 10.1126/science.1100735. [DOI] [PubMed] [Google Scholar]
Associated Data
This section collects any data citations, data availability statements, or supplementary materials included in this article.