

Abstract
Genome sequencing of Mycobacterium tuberculosis complex members has accelerated the search for new disease-control tools. Antigen mining is one area that has benefited enormously from access to genome data. As part of an ongoing antigen mining programme, we screened genes that were previously identified by transcriptome analysis as upregulated in response to an in vitro acid shock for their in vivo expression profile and antigenicity. We show that the genes encoding two methyltransferases, Mb1438c/Rv1403c and Mb1440c/Rv1404c, were highly upregulated in a mouse model of infection, and were antigenic in M. bovis-infected cattle. As the genes encoding these antigens were highly upregulated in vivo, we sought to define their genetic regulation. A mutant was constructed that was deleted for their putative regulator, Mb1439/Rv1404; loss of the regulator led to increased expression of the flanking methyltransferases and a defined set of distal genes. This work has therefore generated both applied and fundamental outputs, with the description of novel mycobacterial antigens that can now be moved into field trials, but also with the description of a regulatory network that is responsive to both in vivo and in vitro stimuli.
INTRODUCTION
Mycobacterium bovis is the causative agent of bovine tuberculosis, a disease responsible for annual losses to global agriculture of $3 billion and with serious repercussions for public health and animal welfare. Control of bovine tuberculosis in many countries involves regular testing of cattle (skin test) with a crude preparation of mycobacterial antigens termed PPD (purified protein derivative, also known as tuberculin), followed by compulsory slaughter of positive reactors. Vaccination is not used as part of the control strategy since the only available vaccine, the human tuberculosis vaccine bacille Calmette–Guérin (BCG), imparts only limited protection in cattle and compromises the use of the skin test. In order to control bovine tuberculosis there is therefore an acute need to develop both improved vaccines and diagnostic tests.
Antigens have already been identified that are feeding into the design of new control strategies. The potent T-cell antigens ESAT-6 and CFP-10 were originally identified from Mycobacterium tuberculosis culture filtrates (Sørensen et al., 1995; Skjøt et al., 2000), with the genes encoding these antigens deleted from the genome of the BCG vaccine strain (Mahairas et al., 1996). They therefore have obvious application to the differential diagnosis of vaccination versus infection. Similarly, antigens have been described that impart significant levels of protection against challenge when used as subunit vaccines (Ibanga et al., 2006; Orme, 2006; Vordermeier et al., 2006). However, we need to expand our repertoire of known antigens to ensure that the best candidates, or cocktails, are optimized and applied.
One approach to the discovery of new antigens is to exploit the information contained in the M. bovis genome. Sequencing the M. bovis genome revealed ~4000 protein-encoding genes (Garnier et al., 2003); however, it is not feasible to screen all of these proteins for diagnostic or vaccine potential. Instead a biologically relevant filter must be used to sift the genome information to a manageable subset. One subset of obvious interest would be genes that are upregulated in vivo, but there are difficulties in identifying global expression changes of M. bovis in cattle. A parallel approach would be to identify genes that respond in vitro to a surrogate of the in vivo milieu, such as nutrient starvation, hypoxia or acid shock, and then to screen the identified genes for their expression profile responses in vivo using targeted methods. Following this approach we chose acid as our in vitro surrogate and in doing so found 60 M. bovis genes that were upregulated when the bacteria were exposed to acid shock (Golby et al., 2007).
In this study, we have determined whether in vitro acid-induced genes are also upregulated in vivo, and then screened the resulting candidates for their immunogenicity in M. bovis-infected cattle. Using this approach, we have identified two putative methyltransferase-encoding genes which are highly upregulated in vivo and whose products are immunogenic in cattle. We furthermore identified the regulator of these methyltransferase genes as a route to understanding their upregulation in vivo.
METHODS
Bacterial strains and growth conditions; gene designations
M. bovis 2122/97 (Garnier et al., 2003) was routinely grown in Middlebrook 7H9 broth supplemented with 10 % albumin-dextrose-catalase (ADC, Difco), 0.05 % Tween and 10 mM pyruvate, or on 7H11 agar supplemented with 10 % oleic acid-albumin-dextrose-catalase (OADC, Difco), and 10 mM pyruvate. Similar media were used for the growth of M. tuberculosis H37Rv, except the pyruvate was replaced with 0.2 % or 0.5 % glycerol for growth in liquid or on solid media, respectively. Liquid cultures were grown at 37 °C in 2 l bottles rotated at 2–3 r.p.m. Where used, hygromycin and kanamycin were present at 150 μg ml−1 and 50 μg ml−1, respectively. For gene designations, ‘Mb’ denotes a gene from M. bovis 2122, while ‘Rv’ is a gene from M. tuberculosis H37Rv (Cole et al., 1998; Garnier et al., 2003).
Extraction of RNA from mouse tissues and broth cultures
Female BALB/c mice were intranasally infected with 200-300 c.f.u. of M. bovis and euthanized when clinical signs of tuberculosis disease became apparent. Lungs were removed from the mice, and for each lung one half was placed in a vial containing 10 ml Trizol and the other half in 10 ml phosphate-buffered saline solution (PBS) plus 0.05 % Triton X-100; then both vials were stored at −80 °C. When required, the vials were thawed and the contents homogenized. The Trizol-lung homogenate was transferred to Ribolyser tubes and RNA extracted according to the protocol outlined by Bacon et al. (2004). The PBS-lung homogenate was serially diluted and plated onto solid growth medium. The plates were incubated at 37 °C for 3–4 weeks before the numbers of M. bovis colonies were counted. Viable counts were approximately 108–109 c.f.u. per lung.
RNA was prepared from broth cultures of M. tuberculosis and M. bovis using the guanidinium thiocyanate procedure (Bacon et al., 2004). Quantitative real-time PCR (qRT-PCR) experiments were performed as described by Golby et al. (2007); the sequences of the primer pairs are given in Supplementary Table S1, available with the online version of this paper.
Antigen discovery
A set of 469 peptides spanning the lengths of 11 open reading frames were purchased from Mimitopes. The peptides were 20 residues in length, each with a 12 residue overlap with its neighbouring peptide. Peptides were formulated into pools of approximately 8–12 peptides. The gamma-interferon (IFN-γ) immunoassay methodology was as described previously (Cockle et al., 2002). For screening purposes, bloods were taken from 21 reactor cattle naturally infected with M. bovis. The IFN-γ concentration was determined using the BOVIGAM ELISA kit (Prionics). An antigen was defined as giving a positive response when the A450 with antigen minus A450 without antigens was ≥0.1. Absorbance readings were converted to concentration of IFN-γ (pg ml−1) using the following equation: (A450×30.9)+0.5658.
Construction of M. tuberculosis H37Rv Rv1403c–Rv1405c deletion strain PG100
A 0.9 kb fragment containing the 5′ ends of the Mb1440c and fmt genes was PCR amplified using M. bovis 2122 chromosomal DNA and primers Mb1440c5′F1 and Mb1440c5′R. (Sequences of primers used in the construction of plasmids and the verification of the mutant are given in Supplementary Table S2.) The PCR product was digested with BamHI and cloned into the ColE1 plasmid pSMT100, which contains a hygR cassette and the sacB gene, to give the construct pPG28. A 0.9 kb fragment containing the 3′ ends of Rv1403c and priA was PCR amplified using primers Mb1438c3′F and Mb1438c3′R1, digested with XbaI and PstI and cloned into pPG28 to give pPG34 (Fig. 1). The plasmid was used to transform M. tuberculosis H37Rv and transformants were plated onto 7H11 medium containing 0.5 % glycerol, OADC, 2 % sucrose and hygromycin. Hygromycin- and sucrose-resistant colonies were screened for loss of the Rv1403c–Rv1405c genes by PCR using primers that anneal to the 5′ end of Rv1405c and the 3′ end of Rv1403c. Putative ΔRv1403c–Rv1405c mutants were verified by PCR using primers that anneal to internal sequences of the hygromycin-resistance cassette and the fmt gene, hygF and fmtR1 respectively.
Fig. 1.

Schematic representation of the Rv1405c–Rv1403c genomic region. The direction of the arrows indicates the relative direction of transcription for each gene. Restriction enzyme sites incorporated into the sequences of the PCR primers/products are: H, HindIII; B, BamHI; X, XbaI; A, AfeI.
Construction of Rv1405c-, Rv1404- and Rv1403c-overexpressing plasmids
The Rv1405c-overexpressing plasmid was prepared by PCR amplification of a 1.4 kb fragment encompassing Rv1405c and 525 bp upstream of the initiation codon (fragment A, Fig. 1) using M. tuberculosis H37Rv genomic DNA as a template and primers Rv1405cF1 and Rv1405cR1. The PCR product was digested with BamHI and cloned into BamHI-cut pMD31 (Donnelly-Wu et al., 1993) to give plasmid pPG53 (Fig. 1). The Rv1403c-overexpresssing plasmid was constructed by amplifying a 1.5 kb fragment encompassing Rv1403c and 515 bp upstream of its start codon (fragment B, Fig. 1) using primers Rv1403cF1 and Rv1403cR1. The product was digested with BamHI and cloned into BamHI-cut pMD31 to give plasmid pPG54. The construct overexpressing both Rv1405c and Rv1404 was prepared by amplification of a 1 kb fragment containing Rv1404 and 456 bp upstream of the start codon (fragment C, Fig. 1) using primers Rv1404F1 and Rv1404R1. The PCR product was digested with XbaI and HindIII and cloned into the corresponding sites of plasmid pPG53 to give construct pPG55. Similarly, the Rv1403c- and Rv1404-containing plasmid was created by cloning the 1 kb Rv1404-containing PCR fragment previously described into plasmid pPG54 to create the construct pPG56. To construct the Rv1404-overexpressing plasmid used in the microarray experiments the 1 kb XbaI-HindIII Rv1404-containing fragment of pPG55 was cloned into the corresponding sites of pMD31 to generate the construct pPG57. Plasmid pPG72, which contains a 3 kb ’priA-Rv1403c-Rv1404-Rv1405c-fmt’ fragment, was constructed in several steps. Firstly, a 1.6 kb ’priA-Rv1403c-Rv1404-Rv1405c’-containing fragment (fragment D, Fig. 1) was PCR amplified using primers priAF and Rv1405cR3, and then a 1.4 kb ’Rv1405c-fmt’-containing fragment (fragment E, Fig. 1) was amplified using primers Rv1405cF2 and fmtR2. The two PCR fragments were digested with HindIII and AfeI, and cloned into HindIII-cut pMD31 to yield pPG72. Sequences of primers used in plasmid construction are given in Supplementary Table S2.
Microarray analysis
Three independent experiments (biological replicates) were carried out. For each strain in each experiment, two microarrays (technical replicates) were performed, with each microarray having two measurements of every gene. Two colour hybridizations were performed using whole-genome M. bovis/M. tuberculosis microarrays; the array design is available in BmG@Sbase, accession no. A-BUGS-31 (http://bugs.sgul.ac.uk/A-BUGS-31) and also ArrayExpress, accession no. A-BUGS-31. Cy5 and Cy3 fluorescently labelled probes synthesized from RNA and genomic DNA, respectively, were hybridized to microarrays. Further details concerning the design of the microarrays and procedures used for probe manufacture and hybridization can be found in Golby et al. (2007).
Scanning and image analysis
Microarrays were scanned using a GenePix 4000A microarray scanner (Axon Instruments) with the photomultiplier tube set in the range 550–750 V, so that spots with the highest signal intensities were just below the level of saturation. Fluorescent spots on each image were quantified using BlueFuse for Microarrays software (BlueGnome).
Microarray data analysis
Data from every microarray were normalized by calculating the log ratio of the Cy5 to Cy3 signal for every spot, and then dividing each log ratio by the median of the log ratios of all spots (excluding control spots) on the array. As an additional normalization step, a median absolute deviation (MAD) scale transformation was applied to the normalized data from the previous step. For each microarray, duplicate spots were averaged, and then the average expression of every gene across all technical replicate microarrays was calculated. Averages of the three biological replicates were used to compare gene expression between strains. For each gene, a moderate t-test was applied and those genes with a P-value less than 0.05 were selected. From this gene list, those genes whose average expression differed by more than 3-fold between strains were selected. Fully annotated microarray data have been deposited in BmG@Sbase (accession number: E-BUGS-59; http://bugs.sgul.ac.uk/E-BUGS-59) and also ArrayExpress (accession number: E-BUGS-59).
RESULTS
Analysis of in vivo gene expression by qRT-PCR
We previously described the effect of acid shock on the transcriptome of M. bovis and M. tuberculosis grown in a chemostat (Golby et al., 2007), and identified Mb1438c and Mb1440c (and the M. tuberculosis orthologues Rv1403c and Rv1405c, respectively) as two of the genes most highly induced in response to acid shock. Both genes were induced within 5 min of acid shock, and maintained high expression over 24 h (Golby et al., 2007). However, the question was whether this in vitro stress truly paralleled stresses experienced by M. bovis and M. tuberculosis in vivo. To determine whether in vitro acid-induced genes were also upregulated in vivo we screened 26 acid-shock-induced genes, selected on the basis of putative function and fold change, by qRT-PCR to determine their gene expression in vivo relative to an in vitro control (Table 1). The genes Rv1403c/Mb1438c, Rv1404/Mb1439, Rv1405/Mb1440c and 11 of the other 26 genes were upregulated in vivo, with Rv1405c/Mb1440c and Rv1403c/Mb1438c showing changes in expression of 326- and 37-fold, respectively, in vivo compared to in vitro (Table 1). The standard deviations for each gene were high, reflecting the variability in gene expression observed across different mice, but generally the fold increases in expression were in agreement with previous data on upregulation after acid shock (Golby et al., 2007).
Table 1.
In vivo expression of acid-shock-induced genes
| M. bovis CDS | M. tuberculosis CDS | Gene | Fold change* |
|---|---|---|---|
| Mb0217 | Rv0211 | pckA | 25.5±10 |
| Mb0476 | Rv0467 | icl | 18±19.2 |
| Mb0529c | Rv0516c | nc | |
| Mb1058 | Rv1029 | kdpA | nc |
| Mb1086 | Rv1057 | 8.4±4.7 | |
| Mb1162 | Rv1131 | gltA1 | nc |
| Mb1214 | Rv1182 | papA3 | nc |
| Mb1216c | Rv1184c | 7.3±2.8 | |
| Mb1217c | Rv1185c | fadD21 | 4.8±2.4 |
| Mb1438c | Rv1403c | 36.5±16 | |
| Mb1439 | Rv1404 | 3.9±1.9 | |
| Mb1440c | Rv1405c | 325.9±138.7 | |
| Mb1495 | Rv1460 | 3.3±1.5 | |
| Mb1618c | Rv1592c | 1.6±0.8 | |
| Mb1709 | Rv1682 | nc | |
| Mb1788 | Rv1758 | cut1 | 2.7±1.1 |
| Mb1803 | Rv1774 | nc | |
| Mb2057c | Rv2031c | hspX | 38.7±19.7 |
| Mb2194c | Rv2172c | nc | |
| Mb2364 | Rv2336 | nc | |
| Mb2454 | Rv2428 | ahpC | 4.1±1.9 |
| Mb2587 | Rv2557 | nc | |
| Mb2955 | Rv2930 | fadD26 | nc |
| Mb3028c | Rv3003c | ilvB1 | nc |
| Mb3116 | Rv3089 | fadD13 | nc |
| Mb3163 | Rv3139 | fadE24 | 4.7±2.0 |
Fold changes are the mean ratios±sd of expression measured in mouse lung tissues compared with expression measured of in vitro-grown M. bovis. nc, No change.
Antigen screening
We next determined whether in vivo-induced genes were antigenic in the bovine host. We selected 11 of the in vivo-upregulated genes, including the highly upregulated Rv1403c/Mb1438c and Rv1405c/Mb1440c as well as their putative regulator, Rv1404/Mb1439. Immunogenicity was assessed using an IFN-γ immunoassay using blood obtained from cattle naturally infected with M. bovis. Peptides derived from the sequences of the 11 CDS were synthesized and pooled into 46 groups, with each group consisting of 8–12 overlapping peptides (Table 2). Whole-blood cultures in the presence of the peptide pools were established and IFN-γ production measured after 48 h of culture. Fig. 2 shows the percentage of cattle tested that gave a positive response for each of the peptide pools tested. All cattle showed a positive response to PPD from M. avium (PPDA) and M. bovis (PPDB), as well as a staphylococccal enterotoxin B control. Five of the peptide pools tested showed a positive response in at least 40 % of cattle tested, namely pools 1 (containing peptides from Mb1438c), 6 and 8 (Mb1440c), 25 (FadD21) and 32 (FadE24), with Mb1438c being the strongest inducer of IFN-γ (Fig. 3). For diagnostic use, secreted antigens are of particular interest as host responsiveness is indicative of ongoing infection with viable bacilli. Furthermore, early and sustained upregulation of genes Mb1440c and Mb1438c in vivo points to their potential as subunit vaccines, as responses seen early in infection may be associated with protection.
Table 2.
Gene products screened for antigenicity
|
M. bovis CDS |
M. tuberculosis CDS |
Gene name |
Product size (aa) |
Peptide pools |
|---|---|---|---|---|
| Mb1438c | Rv1403c | 274 | 1–3 | |
| Mb1439 | Rv1404 | 160 | 4–5 | |
| Mb1440c | Rv1405c | 274 | 6–8 | |
| Mb0217 | Rv0211 | pckA | 606 | 9–15 |
| Mb0476 | Rv0467 | icl | 428 | 16–20 |
| Mb1788 | Rv1758 | cut1 | 218 | 21–23 |
| Mb1217c | Rv1185c | fadD21 | 578 | 24–30 |
| Mb3163 | Rv3139 | fadE24 | 468 | 31–36 |
| Mb2454 | Rv2428 | ahpC | 195 | 37–38 |
| Mb1086 | Rv1057 | 393 | 39–43 | |
| Mb1495 | Rv1460 | 268 | 44–46 |
Fig. 2.
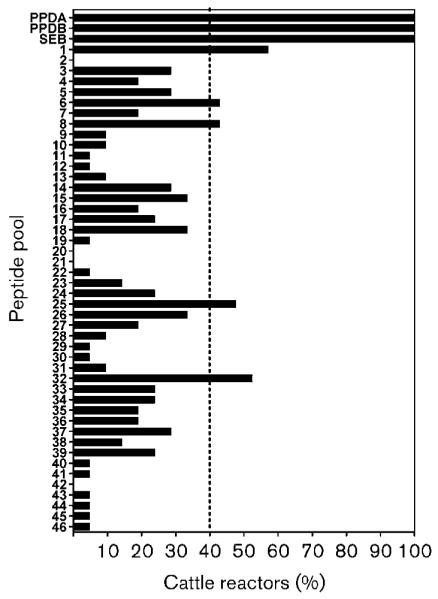
Percentage of cattle that responded positively to antigens tested. The dashed vertical line indicates the positive cutoff value of 40 %. PPDA is purified protein derivative from M. avium, PPDB is purified protein derivative from M. tuberculosis, and SEB is staphylococcal enterotoxin B. Peptide pools giving positive responses are pool 1 (Mb1438c/Rv1403c), pools 6 and 8 (Mb1440c/Rv1405c), pool 25 (FadD21) and pool 32 (FadE24).
Fig. 3.
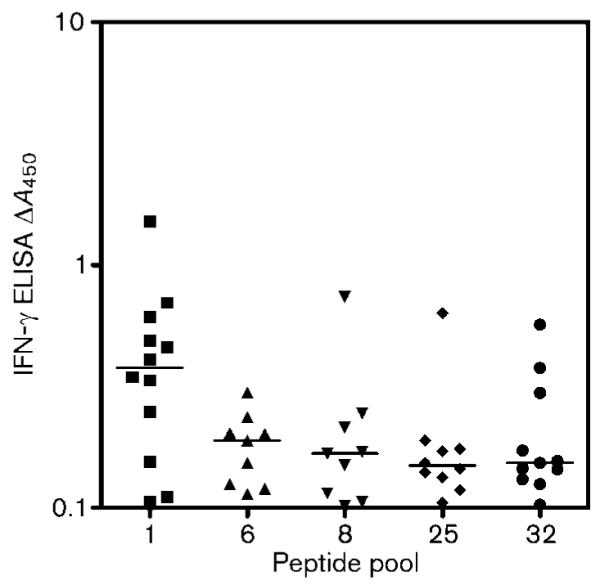
IFN-γ responses induced to antigens in M. bovis-infected cattle. The results of those cattle that gave only a positive response are shown. Horizontal lines indicate the mean IFN-γ response for a particular antigen pool. An antigen is defined as giving a positive response when the A450 with antigen minus A450 without antigen was ≥0.1. The peptides are contained within Mb1438c/Rv1403c (pool 1), Mb1440c/Rv1405c (pools 6 and 8), FadD21 (pool 25) and FadE24 (pool 32).
Isolation of a ΔRv1403c–Rv1405c:: hyg mutant
The high degree of upregulation of the two putative methyltransferase-encoding genes Mb1440c and Mb1438c and the immunogenic properties of the corresponding proteins prompted us to examine their regulation. Rv1404/Mb1439 encodes a protein that has some homology to the MarR family of transcriptional regulators, and we have previously speculated that it could function to regulate the expression of Rv1403c/Mb1438c and Rv1405c/Mb1440c (Golby et al., 2007). In order to test this, we sought to construct an Rv1404/Mb1439 deletion mutant. Attempts to isolate a targeted deletion of Rv1404 using plasmid- or bacteriophage-based mutagenesis systems proved unsuccessful in M. bovis. We were, however, successful in isolating a triple mutant of M. tuberculosis H37Rv in which the genes Rv1403c, Rv1404 and Rv1405c were deleted and replaced with a hygromycin-resistance cassette. The resulting strain was designated PG100. Allelic exchange of Rv1403c-Rv1405c with the hygR resistance cassette in PG100 was confirmed by PCR using primers that anneal to the hygromycin-resistance cassette and the adjacent fmt gene (Fig. 1).
Liquid culture growth experiments using PG100 showed that it grew more slowly, and had a much greater tendency to aggregate, than the wild-type (Fig. 4). The defective growth phenotype of the mutant could only be partially corrected by transformation with a plasmid (pPG72) that contained the genes Rv1405c, Rv1404 and Rv1403c. Transformation of the mutant with a plasmid overexpressing Rv1404 alone (pPG57) conferred a similar level of complementation to that seen with pPG72 (Fig. 4). Complementation with Rv1404 had a similar effect to addition of all three deleted genes, suggesting that the PG100 growth defect was due to the loss of Rv1404 and not Rv1405c or Rv1403c. However, failure to achieve full trans complementation using the Rv1404 overexpression construct suggests a complex regulatory circuit that may require cis complementation.
Fig. 4.

Growth phenotype of the M. tuberculosis PG100 triple mutant. The growth of the M. tuberculosis H37Rv wild-type plus pMD31 empty vector (■), PG100 mutant with pMD31 vector (▲), and complemented mutants (▼, ●) is shown. Complementation of PG100 with plasmid pPG72 (▼), which contained the Rv1403c-Rv1404-Rv1405c genes deleted from PG100, or with pPG57 (●), containing just the Rv1404 regulator, failed to restore the growth of the mutant to wild-type levels. Data shown are from one experiment, representative of three.
Rv1404 is a transcriptional repressor of Rv1405c and Rv1403c
qRT-PCR was used to study the effect of Rv1404 on the expression of Rv1405c and Rv1403c in M. tuberculosis. Several plasmid constructs consisting of DNA fragments containing native operator-promoter and coding sequences of Rv1405c, Rv1404 and Rv1403c cloned into the multicopy plasmid pMD31 were constructed (see Methods and Fig. 1) and introduced into PG100. The level of expression of Rv1405c was found to be over 700-fold higher in PG100 carrying the Rv1405c construct pPG53 than the wild-type strain (Table 3), suggesting that the product of Rv1404, absent in the mutant, represses the transcription of Rv1405c. Based on the assumption that there are 5–10 copies of pMD31 per cell in mycobacteria (Donnelly-Wu et al., 1993), one can estimate that the expression of Rv1405c in a ΔRv1404 background is approximately 70–150-fold higher than in the wild-type. Evidence to support the proposed repressor role of Rv1404 on the expression of Rv1405c was provided by the finding that the expression of Rv1405c in PG100 carrying the plasmid pPG55, which contains both Rv1405c and Rv1404, is 45-fold less than the mutant carrying pPG53. Expression of Rv1403c was also found to be 37.7-fold higher in PG100 carrying the Rv1403c-containing pPG54 compared to the wild-type, but only 3.4-fold higher in PG100 carrying both Rv1403c and Rv1404 (pPG56). This suggests that Rv1404 represses the transcription of both Rv1405c and Rv1403c, but the lower fold induction levels of Rv1403c in the mutant would suggest that the promoter of Rv1403c is weaker than that of Rv1405c.
Table 3.
Effect of Rv1404 on the expression of Rv1405c and Rv1403c measured by real-time qRT-PCR
Gene expression values are relative to those in the wild-type.
| Plasmid in PG100 | Rv1405c | Rv1404 | Rv1403c |
|---|---|---|---|
| pPG53 | 739.0 | nd | nd |
| pPG54 | nd | 9.0 | 37.7 |
| pPG55 | 16.4 | 7.8 | nd |
| pPG56 | nd | 10.0 | 3.4 |
nd, Not detected.
Transcriptome analysis of PG100
The growth defect of the PG100 ΔRv1405c–Rv1403c triple mutant could be partially reversed by complementing with the Rv1404 regulator, suggesting that Rv1404 regulated genes in addition to Rv1405c and Rv1403c, genes that may include the methylation target of Rv1403c and Rv1405c. In order to identify these genes, DNA microarrays were used to compare the transcriptional profiles of the wild-type H37Rv and PG100. Table 4 shows the fold changes in expression for 28 genes that showed a minimum 3-fold differential expression in PG100 compared with H37Rv. Introduction of a plasmid overexpressing Rv1404, pPG57, into the mutant strain reduced the expression of 25 of the 28 differentially expressed genes to levels that were similar (<2-fold difference) to those seen in the wild-type. Twenty-two of the 25 Rv1404-regulated genes were upregulated in PG100, suggesting that Rv1404 is predominantly a transcriptional repressor.
Table 4.
Gene expression control by Rv1404
| Rv no. | Gene | Product | Fold change* |
|
|---|---|---|---|---|
| Wild-type vs PG100 | Wild-type vs PG100(pPG57) | |||
| Rv0193c | Hypothetical protein | 30.1 | nc | |
| Rv0194 | ABC transporter | 13.1 | nc | |
| Rv0195 | Transcriptional regulator | 52.7 | nc | |
| Rv0341 | iniB | Isoniazid-inducible gene | 4.0 | 4.0 |
| Rv0575c † | Possible oxidoreductase | 6.0 | nc | |
| Rv1376 | Conserved hypothetical protein | 7.7 | nc | |
| Rv1392 † | metK | AdoMet synthase | 4.1 | nc |
| Rv1402 | priA | Putative primosomal protein | 6.3 | nc |
| Rv1592c | Conserved hypothetical protein | 4.0 | 4.4 | |
| Rv1620c | cydC | Cytochrome transporter assembly protein | 0.31 | nc |
| Rv1623c | cydA | Cytochrome transporter assembly protein | 0.30 | nc |
| Rv1682 † | Coiled-coil protein | 10.9 | nc | |
| Rv1809 † | PPE33 | PPE family protein | 3.0 | nc |
| Rv2281 | pitB1 | Phosphate transporter | 3.5 | nc |
| Rv2322c † | rocD1 | Ornithine aminotransferase | 3.6 | nc |
| Rv2389c † | rpfD | Resuscitation factor | 5.8 | nc |
| Rv2390c † | Conserved hypothetical protein | 8.6 | nc | |
| Rv2700 | Possible secreted protein | 4.4 | nc | |
| Rv2817c | Conserved hypothetical protein | 0.32 | nc | |
| Rv2930 | fadD26 | Fatty acid synthase | 3.7 | nc |
| Rv2934 | ppsD | Polyketide synthase | 3.9 | 4.7 |
| Rv3137 | Probable monophosphatase | 3.1 | nc | |
| Rv3289c | Possible transmembrane protein | 3.1 | nc | |
| Rv3371 † | Conserved hypothetical protein | 4.1 | nc | |
| Rv3531c | Hypothetical protein | 3.2 | nc | |
| Rv3532 † | PPE61 | PPE family protein | 10.2 | nc |
| Rv3533c | PPE62 | PPE family protein | 3.3 | nc |
| Rv3746c † | PE34 | PE family protein | 3.9 | nc |
nc, No change.
Genes shown previously to be 3-fold or more upregulated in M. tuberculosis H37Rv in response to acid.
Six of the twenty-seven genes identified as showing a 3-fold or greater difference in expression between the wild-type and the mutant were selected, based on putative function and fold change, for analysis by qRT-PCR. Fig. 5 shows that the fold changes in expression measured by microarray and qRT-PCR for these six genes are comparable, validating the results of the microarray analysis.
Fig. 5.
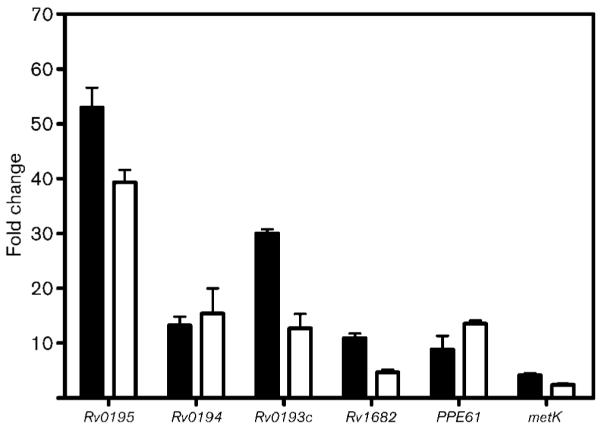
Confirmation of microarray analysis by real-time qRT-PCR. Fold changes are the mean ratios±sem of gene expression measured in the mutant PG100 compared with the wild-type H37Rv. Black bars represent the microarray data and white bars the qRT-PCR data
DISCUSSION
There is a critical need for new tools for the control of both M. bovis and M. tuberculosis infection and disease. We have used a combination of global gene expression studies and antigen mining to identify novel antigens of M. bovis.We have also moved this applied research back to a more fundamental setting, identifying the regulatory network that controls the expression of the two most promising antigens we identified. We believe that this combination of applied and fundamental research offers the best chance to accelerate the generation of new control tools.
Two of the most highly upregulated genes in response to in vitro acid shock, the methyltransferase-encoding genes Rv1403c/Mb1438c and Rv1405c/Mb1440c, were also found to be highly upregulated in vivo. The expression of Mb1440c in vivo was particularly high, showing an approximately 350-fold higher level of expression compared to an in vitro control. This level of induction is comparable to the 70–150-fold induction of Rv1405c seen in an ΔRv1404 mutant background compared to the wild-type, suggesting that Rv1405c/Mb1440c expression was completely derepressed in infected mouse lung tissues.
Expression of Mb1440c/Rv1405c and Mb1438c/Rv1403c was shown to be tightly regulated by the product of the Mb1439/Rv1404 gene, encoding a member of the MarR family of transcriptional regulators (Ellison & Miller, 2006; Grkovic et al., 2002). Mb1440c/Rv1405c and Mb1438c/Rv1403c showed very low expression under in vitro non-stressed and ex vivo conditions, but high expression under in vivo and stressed in vitro conditions. It is noteworthy that in Mycobacterium ulcerans a transposon is inserted in the promoter/operator region of the Mb1439/Rv1404 orthologue (Stinear et al., 2007), presumably resulting in constitutive expression of the Rv1405c orthologue since its protein product was detected in the cytoplasmic fraction of M. ulcerans by LC-MS (annotated at http://genolist.pasteur.fr/BuruList/).
The majority of MarR regulators act as repressors, and their activity can be modulated through binding of an inducer molecule to the MarR regulator (Ellison & Miller, 2006; Grkovic et al., 2002). Genes regulated by MarR family members are repressed in the absence of the inducer and derepressed in the presence of inducer. Many MarR repressors are also autoregulatory, repressing their own expression in the absence of inducer. This would explain the observed moderate increase (3–4-fold) in expression of Mb1439/Rv1404 observed under acidic and in vivo conditions, as the regulator would be unable to bind to its operator and repress its own expression. In addition to Rv1405c and Rv1403c, deletion of Rv1404 was also shown to affect the expression of another 25 genes, 10 of which were previously shown to be upregulated in response to acid shock in M. tuberculosis H37Rv. This suggests that Rv1404/Mb1439 is an important regulator in the response of M. tuberculosis and M. bovis to acid shock. Curiously, the three genes that show the highest induction in the Rv1404 mutant (Rv0193c–Rv0195) show no upregulation in response to acid (Golby et al., 2007), suggesting that the expression of these genes could be regulated by other factors in addition to Rv1404.
In a seminal study, Sassetti and Rubin used a combination of saturation mutagenesis with in vivo selection to identify M. tuberculosis genes that were required for survival in a mouse infection model; Rv1405c was among the 197 genes identified as important for virulence (Sassetti & Rubin, 2003). Hence, methylation of Rv1405c’s target is involved in virulence. There are a number of examples where methylation of mycobacterial cellular components has been implicated in the virulence of M. tuberculosis. Methylation of the mycobacterial heparin-binding haemagglutinin adhesin (HBHA), an extrapulmonary dissemination factor (Pethe et al., 2001), is required for T-cell immunity and protects the molecule against proteolysis (Pethe et al., 2002; Temmerman et al., 2004). Similarly, cyclopropanation of mycolic acids by pcaA and cmaA2 has been shown to be involved in virulence of M. tuberculosis (Glickman et al., 2000; Rao et al., 2006). Overexpression of Rv1405c in M. smegmatis mc2155 caused no significant changes in mycolic acid profile (data not shown), suggesting that Rv1405c is not involved in cyclopropanation of mycolic acids. Analysis of the Rv1405c locus reveals genes encoding formyl methionine transferase (fmt) and a putative rRNA methyltransferase (fmu), suggesting that Rv1405c/Rv1403c could be involved in methylating a component of the protein translational machinery; however, how this would play a role in virulence is unknown.
The ΔRv1403-Rv1404-Rv1405c mutant also showed upregulation of distal genes. Rv0193c–Rv0195 showed the highest degree of upregulation (13–52-fold), and their contiguity suggests that their products could be functionally related. Rv0195 encodes a response regulator of the two-component family and, like Rv1403c and Rv1405c, has been shown to be upregulated in response to low oxygen conditions (Muttucumaru et al., 2004; Voskuil et al., 2004). The gene Rv0194 encodes a putative ABC-type transporter, but its function and substrate are unknown. The gene is unique amongst other ABC-type transporters of M. tuberculosis in having two membrane-spanning domains and two nucleotide-binding domains in a single polypeptide.
In summary, on an applied level we have defined novel M. bovis antigens that are now being moved forward to larger field trials. On a fundamental level, we have described the regulation of genes encoding two methyltransferases in M. tuberculosis, one of which, Rv1405c, has been implicated as a virulence factor. The next step will be to identify the target(s) of these methyltransferases to elucidate their role in virulence.
Supplementary Material
ACKNOWLEDGEMENTS
This work was supported by the Department for Environment, Food and Rural Affairs (Defra, UK). We thank Lucy Brooks and Adam Whitney (Bacterial Microarray Group, St George’s) for help with depositing data in BmG@Sbase and ArrayExpress. We wish to acknowledge Colorado State University for the provision of M. tuberculosis H37Rv genomic DNA produced under NIH contract HHSN266200400091C/ADB NO1-A1-40091 ‘Tuberculosis Vaccine Testing and Research Materials Contract’.
Abbreviations
- IFN-γ
gamma-interferon
- PPD
purified protein derivative (tuberculin)
- qRT-PCR
quantitative real-time polymerase chain reaction
Footnotes
The ArrayExpress (and BmG@Sbase) accession number for the microarray data in this paper is A-BUGS-59.
Two supplementary tables of primers are available with the online version of this paper.
REFERENCES
- Bacon J, James BW, Wernisch L, Williams A, Morley KA, Hatch GJ, Mangan JA, Hinds J, Stoker NG, et al. The influence of reduced oxygen availability on pathogenicity and gene expression in Mycobacterium tuberculosis. Tuberculosis (Edinb) 2004;84:205–217. doi: 10.1016/j.tube.2003.12.011. [DOI] [PubMed] [Google Scholar]
- Cockle PJ, Gordon SV, Lalvani A, Buddle BM, Hewinson RG, Vordermeier HM. Identification of novel Mycobacterium tuberculosis antigens with potential as diagnostic reagents or subunit vaccine candidates by comparative genomics. Infect Immun. 2002;70:6996–7003. doi: 10.1128/IAI.70.12.6996-7003.2002. [DOI] [PMC free article] [PubMed] [Google Scholar]
- Cole ST, Brosch R, Parkhill J, Garnier T, Churcher C, Harris D, Gordon SV, Eiglmeier K, Gas S, et al. Deciphering the biology of Mycobacterium tuberculosis from the complete genome sequence. Nature. 1998;393:537–544. doi: 10.1038/31159. [DOI] [PubMed] [Google Scholar]
- Donnelly-Wu MK, Jacobs WR, Jr, Hatfull GF. Superinfection immunity of mycobacteriophage L5: applications for genetic transformation of mycobacteria. Mol Microbiol. 1993;7:407–417. doi: 10.1111/j.1365-2958.1993.tb01132.x. [DOI] [PubMed] [Google Scholar]
- Ellison DW, Miller VL. Regulation of virulence by members of the MarR/SlyA family. Curr Opin Microbiol. 2006;9:153–159. doi: 10.1016/j.mib.2006.02.003. [DOI] [PubMed] [Google Scholar]
- Garnier T, Eiglmeier K, Camus JC, Medina N, Mansoor H, Pryor M, Duthoy S, Grondin S, Lacroix C, et al. The complete genome sequence of Mycobacterium bovis. Proc Natl Acad Sci U S A. 2003;100:7877–7882. doi: 10.1073/pnas.1130426100. [DOI] [PMC free article] [PubMed] [Google Scholar]
- Glickman MS, Cox JS, Jacobs WR., Jr A novel mycolic acid cyclopropane synthetase is required for cording, persistence, and virulence of Mycobacterium tuberculosis. Mol Cell. 2000;5:717–727. doi: 10.1016/s1097-2765(00)80250-6. [DOI] [PubMed] [Google Scholar]
- Golby P, Hatch KA, Bacon J, Cooney R, Riley P, Allnutt J, Hinds J, Nunez J, Marsh PD, et al. Comparative transcriptomics reveals key gene expression differences between the human and bovine pathogens of the Mycobacterium tuberculosis complex. Microbiology. 2007;153:3323–3336. doi: 10.1099/mic.0.2007/009894-0. [DOI] [PubMed] [Google Scholar]
- Grkovic S, Brown MH, Skurray RA. Regulation of bacterial drug export systems. Microbiol Mol Biol Rev. 2002;66:671–701. doi: 10.1128/MMBR.66.4.671-701.2002. [DOI] [PMC free article] [PubMed] [Google Scholar]
- Ibanga HB, Brookes RH, Hill PC, Owiafe PK, Fletcher HA, Lienhardt C, Hill AV, Adegbola RA, McShane H. Early clinical trials with a new tuberculosis vaccine, MVA85A, in tuberculosis-endemic countries: issues in study design. Lancet Infect Dis. 2006;6:522–528. doi: 10.1016/S1473-3099(06)70552-7. [DOI] [PubMed] [Google Scholar]
- Mahairas GG, Sabo PJ, Hickey MJ, Singh DC, Stover CK. Molecular analysis of genetic differences between Mycobacterium bovis BCG and virulent M. bovis. J Bacteriol. 1996;178:1274–1282. doi: 10.1128/jb.178.5.1274-1282.1996. [DOI] [PMC free article] [PubMed] [Google Scholar]
- Muttucumaru DG, Roberts G, Hinds J, Stabler RA, Parish T. Gene expression profile of Mycobacterium tuberculosis in a non-replicating state. Tuberculosis (Edinb) 2004;84:239–246. doi: 10.1016/j.tube.2003.12.006. [DOI] [PubMed] [Google Scholar]
- Orme IM. Preclinical testing of new vaccines for tuberculosis: a comprehensive review. Vaccine. 2006;24:2–19. doi: 10.1016/j.vaccine.2005.07.078. [DOI] [PubMed] [Google Scholar]
- Pethe K, Alonso S, Biet F, Delogu G, Brennan MJ, Locht C, Menozzi FD. The heparin-binding haemagglutinin of M. tuberculosis is required for extrapulmonary dissemination. Nature. 2001;412:190–194. doi: 10.1038/35084083. [DOI] [PubMed] [Google Scholar]
- Pethe K, Bifani P, Drobecq H, Sergheraert C, Debrie AS, Locht C, Menozzi FD. Mycobacterial heparin-binding hemagglutinin and laminin-binding protein share antigenic methyllysines that confer resistance to proteolysis. Proc Natl Acad Sci U S A. 2002;99:10759–10764. doi: 10.1073/pnas.162246899. [DOI] [PMC free article] [PubMed] [Google Scholar]
- Rao V, Gao F, Chen B, Jacobs WR, Jr, Glickman MS. Trans-cyclopropanation of mycolic acids on trehalose dimycolate suppresses Mycobacterium tuberculosis-induced inflammation and virulence. J Clin Invest. 2006;116:1660–1667. doi: 10.1172/JCI27335. [DOI] [PMC free article] [PubMed] [Google Scholar]
- Sassetti CM, Rubin EJ. Genetic requirements for mycobacterial survival during infection. Proc Natl Acad Sci U S A. 2003;100:12989–12994. doi: 10.1073/pnas.2134250100. [DOI] [PMC free article] [PubMed] [Google Scholar]
- Skjøt RL, Oettinger T, Rosenkrands I, Ravn P, Brock I, Jacobsen S, Andersen P. Comparative evaluation of low-molecular-mass proteins from Mycobacterium tuberculosis identifies members of the ESAT-6 family as immunodominant T-cell antigens. Infect Immun. 2000;68:214–220. doi: 10.1128/iai.68.1.214-220.2000. [DOI] [PMC free article] [PubMed] [Google Scholar]
- Sørensen AL, Nagai S, Houen G, Andersen P, Andersen AB. Purification and characterization of a low-molecular-mass T-cell antigen secreted by Mycobacterium tuberculosis. Infect Immun. 1995;63:1710–1717. doi: 10.1128/iai.63.5.1710-1717.1995. [DOI] [PMC free article] [PubMed] [Google Scholar]
- Stinear TP, Seemann T, Pidot S, Frigui W, Reysset G, Garnier T, Meurice G, Simon D, Bouchier C, et al. Reductive evolution and niche adaptation inferred from the genome of Mycobacterium ulcerans, the causative agent of Buruli ulcer. Genome Res. 2007;17:192–200. doi: 10.1101/gr.5942807. [DOI] [PMC free article] [PubMed] [Google Scholar]
- Temmerman S, Pethe K, Parra M, Alonso S, Rouanet C, Pickett T, Drowart A, Debrie AS, Delogu G, et al. Methylation-dependent T cell immunity to Mycobacterium tuberculosis heparin-binding hemagglutinin. Nat Med. 2004;10:935–941. doi: 10.1038/nm1090. [DOI] [PubMed] [Google Scholar]
- Vordermeier HM, Chambers MA, Buddle BM, Pollock JM, Hewinson RG. Progress in the development of vaccines and diagnostic reagents to control. tuberculosis in cattle. Vet J. 2006;171:229–244. doi: 10.1016/j.tvjl.2004.11.001. [DOI] [PubMed] [Google Scholar]
- Voskuil MI, Visconti KC, Schoolnik GK. Mycobacterium tuberculosis gene expression during adaptation to stationary phase and low-oxygen dormancy. Tuberculosis (Edinb) 2004;84:218–227. doi: 10.1016/j.tube.2004.02.003. [DOI] [PubMed] [Google Scholar]
Associated Data
This section collects any data citations, data availability statements, or supplementary materials included in this article.