Costs of plasticity are generally measured by the absolute difference between trait values in two or more environments, and both trait value and plasticity costs are correlated with fitness using multiple regression [1]. A recent paper [2] discussed the consequences of a correlation between trait values and this measure of plasticity and presented some empirical examples of such correlations. High correlations between explanatory variables can cause problems of interpretation and from their survey Auld et al. [2] noted that ‘we suspect that highly correlated trait values and trait plasticities are common across many different taxa and inducing environments and, as a result, many of our current estimates of the costs of plasticity may possess unappreciated imprecision and bias’ ([2], p. 507). In this comment, I wish to point out that a correlation between trait values and plasticity is built-in by the definition of plasticity. Let X and Y be the means of the same trait measured in two different environments and without the loss of generality assuming that X > Y: the definition of plasticity given by Auld et al. [2] is X − Y and they are concerned with the correlation between X and plasticity, which is then the correlation between X and X − Y. This is simply a problem of part-whole correlation.
The correlation between X and plasticity is thus
| 1.1 |
where σX,X−Y is the covariance between X and X − Y,  ,
,  are the respective variances. First, suppose that X and Y are uncorrelated: in this case, equation (1.1) reduces to
| 1.2 |
If, as might be likely the variance in X equals the variance Y then r = 1/√2 = 0.71. With unequal variances the correlation can be even higher. Now, suppose that Y is a linear function of X with correlation, rXY. For convenience and without the loss of generality, let the intercept be zero giving the relationship
| 1.3 |
where b = rXY σY/σX and ɛ is an error term with mean zero and variance  . The variance of Y is
| 1.4 |
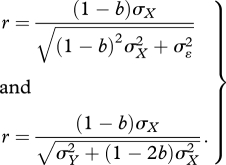
In this case, the correlation between X and plasticity is
 |
1.5 |
Again if the variance in X equals the variance in Y, equation (1.5) reduces to
| 1.6 |
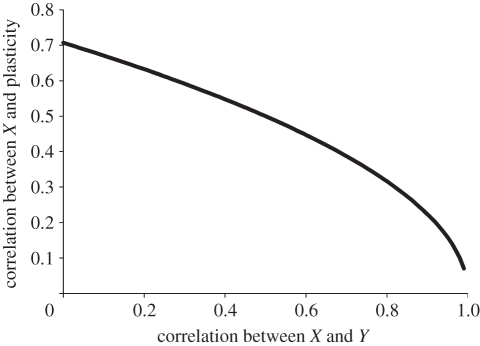
which varies from 0.71 to zero but only drops below 0.5 when the correlation between X and Y exceeds 0.5 (figure 1). When the reaction norms are all parallel, the individual plasticities are all equal and thus there is a correlation of zero between family mean values and plasticities.
Figure 1.
Plot of the correlation between trait X and plasticity versus the correlation between the two traits X and Y.
Auld et al. ([2], p. 506) suggest that ‘In general, the costs of plasticity can only be accurately estimated when trait values and plasticity are not highly correlated’. Given the close statistical association implicit in the definition of plasticity it would seem that alternate approaches to measuring plasticity are warranted. If this definition is to be employed, the statistical significance of the relationship can be correctly gauged using randomization and cross-validation approaches [3].
Footnotes
The accompanying reply can be viewed at http://dx.doi.org/10.1098/rspb.2011.1150.
References
- 1.Van Buskirk J., Steiner U. K. 2009. The fitness costs of developmental canalization and plasticity. J. Evol. Biol. 22, 852–860 10.1111/j.1420-9101.2009.01685.x (doi:10.1111/j.1420-9101.2009.01685.x) [DOI] [PubMed] [Google Scholar]
- 2.Auld J. R., Agrawal A. A., Relyea R. A. 2010. Re-evaluating the costs and limits of adaptive phenotypic plasticity. Proc. R. Soc. B 277, 503–511 10.1098/rspb.2009.1355 (doi:10.1098/rspb.2009.1355) [DOI] [PMC free article] [PubMed] [Google Scholar]
- 3.Roff D. A. 2006. Introduction to computer-intensive methods of data analysis in biology. Cambridge, UK: Cambridge University Press [Google Scholar]


