

Abstract
Magnetic resonance imaging (MRI) on patients with implanted deep brain stimulators (DBSs) can be hazardous because of the antenna-effect of leads exposed to the incident radio-frequency field. This study evaluated electromagnetic field and specific absorption rate (SAR) changes as a function of lead resistivity on an anatomically precise head model in a 3T system. The anatomical accuracy of our head model allowed for detailed modeling of the path of DBS leads between epidermis and the outer table. Our electromagnetic finite difference time domain (FDTD) analysis showed significant changes of 1 g and 10 g averaged SAR for the range of lead resistivity modeled, including highly conductive leads up to highly resistive leads. Antenna performance and whole-head SAR were sensitive to the presence of the DBS leads only within 10%, while changes of over one order of magnitude were observed for the peak 10 g averaged SAR, suggesting that local SAR values should be considered in DBS guidelines. With ρlead = ρcopper, and the MRI coil driven to produce a whole-head SAR without leads of 3.2 W/kg, the 1 g averaged SAR was 1080 W/kg and the 10 g averaged SAR 120 W/kg at the tip of the DBS lead. Conversely, in the control case without leads, the 1 g and 10 g averaged SAR were 0.5 W/kg and 0.6 W/kg, respectively, in the same location. The SAR at the tip of lead was similar with electrically homogeneous and electrically heterogeneous models. Our results show that computational models can support the development of novel lead technology, properly balancing the requirements of SAR deposition at the tip of the lead and power dissipation of the system battery.
Index Terms: Head model, intracranial electrodes, safety, simulations
I. Introduction
Deep brain stimulation (DBS) is a surgical procedure used to treat symptoms of rigidity, slowed movement, tremor, and walking difficulties associated with Parkinson's disease1. The implant or microelectrode set is typically placed in the thalamic area using stereotactic MRI or X-ray guidance [1]. The electrodes are then moved through the thalamus with micromanipulation and electrical stimulation is performed until tremor can be effectively stopped. The properly placed electrode is then anchored to the skull to prevent movement. Finally, the DBS leads are connected to the DBS unit implanted in the chest area through an extension cable. To date over 35 000 patients have undergone DBS treatment worldwide [2]. Many Parkinson's patients will require magnetic resonance imaging (MRI) examinations during the course of their lives. Parkinson's patients with a DBS implant may also undergo investigational functional MRI (fMRI) [3], [4]. However, the radio-frequency (RF) field used to elicit the MRI signal from tissue may produce excessive heating. In vitro studies have been conducted to study RF heating for DBS systems during MRI [5], [6]. Unfortunately, a permanent brain injury from RF heating during a clinical MRI on a patient with a DBS implant has been reported [7].
IEC guidelines limit RF-heating during MRI by suggesting maximum levels of specific absorption rate (SAR) [8]. While the relationship between local SAR to temperature changes has been studied extensively [9]–[11], whole-head SAR (i.e., SAR averaged over the entire head) is currently used in most MRI-systems to limit the RF power in the coil [12]. Whole-head SAR is also used by the DBS manufacturers to assess the “MRI-conditionality” of their products [7]. In this paper, we will show that whole-head SAR may be an excessively coarse parameter to be used for RF-dosimetric evaluation.
The interactions between DBS leads and the RF-field are expected to produce local peaks of electric field, hence SAR, near the lead [13], [14]. Such local peaks depend on different variables, including the dimensions, orientation, shape, and composition of the implant, the RF coil configuration, as well as the heterogeneous electrical properties of the human head [15]–[18]. To improve the precision of the anatomical modeling of the human head with implanted leads and the computation and visualization of local SAR, the present study was conducted by means of finite difference time domain (FDTD) simulations with a multistructure 1 × 1 × 1 mm3 head model, segmented from MRI data of an adult healthy human subject [19].
The goal of this study was to use computational models to explore the effect of lead resistivity on SAR and to provide indications supporting novel lead design based on distributed resistive leads [20].
II. Material and Methods
A. Numerical Head Model
A 1 × 1 × 1 mm3 MRI-based adult head model was used. Details of the MRI data acquisition, processing and anatomical seg-mentation have been described in [19]. The overall head dimensions were 170 mm in width, 217 mm in depth, and 238 mm in height. Each anatomical structure was assigned biophysical properties (Table I and Fig. 1) at the frequency of 128 MHz. The electrical parameters were considered: 1) linear with electric field, 2) isotropic, and 3) heterogeneous in space [21].
Table I. Anatomical Structures Segmented for the Head Model with Related Biophysical Properties Assigned for this Study.
| SE | Density (kg/m3) | 128MHz(e) | ||
|---|---|---|---|---|
|
| ||||
| σ (S/m) | εr | |||
| Grey matter | 1030(a) | 0.58 | 73.51 | |
| White matter | 1030(a) | 0.34 | 52.53 | |
| Cerebellum | 1030(a) | 0.83 | 79.73 | |
| Brain Stem | 1030(a) | 0.58 | 73.51 | |
| Cerebro spinal fluid | 1010(a) | 2.14 | 84.04 | |
| Adipose | 920(a) | 0.07 | 12.37 | |
| Air (resp./diges./sinus) | 1.3(b) | 0.00 | 1.00 | |
| Aqueous humor | 1010(a,c) | 1.51 | 69.01 | |
| Blood vessels | 1057(a) | 1.25 | 73.16 | |
| Bone (facial) | 1850(b) | 0.12 | 20.50 | |
| Connective tissue | 1020(d) | 0.43 | 43.06 | |
| Cornea | 1076(c) | 1.06 | 71.45 | |
| CSF_Subarachnoid | 1010(a) | 2.22 | 72.73 | |
| Diploe | 1080(b) | 0.18 | 26.28 | |
| Dura | 1030(a) | 0.75 | 55.97 | |
| Epidermis/Dermis | 1100(a) | 0.52 | 65.44 | |
| Ear / pinna | 1100(a) | 0.49 | 52.92 | |
| Inner Table | 1850(b) | 0.07 | 14.72 | |
| Lens | 1100(c) | 0.61 | 53.06 | |
| Mastoid / air cells | 1.3(b) | 0.00 | 1.00 | |
| Muscle | 1040(d) | 0.74 | 63.90 | |
| Nasal-Structures | 1100(a) | 0.49 | 52.92 | |
| Nerve | 1040(a) | 0.35 | 44.06 | |
| Orbital Fat | 920(a) | 0.07 | 12.37 | |
| Outer Table | 1850(b) | 0.07 | 14.72 | |
| Retina/choroid/sclera | 1120(a) | 0.92 | 65.00 | |
| Soft Tissue | 1020(d) | 0.43 | 43.06 | |
| Spinal cord | 1040(a) | 0.35 | 44.06 | |
| Subcutaneous tissue | 1020(d) | 0.43 | 43.06 | |
| Subcutaneous fat/muscle | 980(d) | 0.41 | 38.14 | |
| Tongue | 1040(d) | 0.74 | 63.90 | |
| Teeth | 1850(b) | 0.12 | 20.50 | |
| Vitreous humor | 1010(a,c) | 1.51 | 69.01 | |
Fig. 1.

Anatomically fine-grained head model used for this study. From left to right column: map of anatomical structures, mass density, electrical conductivity, and permittivity at 128 MHz. Axial (z = 215), coronal (y = 161), and sagittal (x = 162) planes are shown. The corresponding color code for each modeled structure is to the right of the image. Max scale values of σ and εr set to 1 and 75, respectively, for illustrative purposes (see Table I for full set of values).
Homogeneous Model
The distribution of induced currents in an electrically homogeneous model (σ = 0.74 Sm−1, εr = 64, ρ = 1040 kg/m3, equivalent to the average electrical properties of muscle at 128 MHz [15], [22], were also calculated for comparison.
B. Numerical Model of RF Coil
Simulations were conducted using a birdcage-type RF coil, modeled with 16 perfect electrically conductive rods of 300 mm in length and disposed with circular symmetry (diameter 260 mm) around the head (Fig. 2). The wires were connected at each extremity by two PEC end-rings (diameter 260 mm, thickness 1 mm) [20], [23]. A circular excitation was simulated by means of sinusoidal current generators, placed on the centers of each rod, with 1 A peak-to-peak amplitude, 128 MHz frequency, and a 22.5° phase-shift between any two adjacent generators. Each port was loaded with a 50-Ω resistor in parallel to the generator.
Fig. 2.
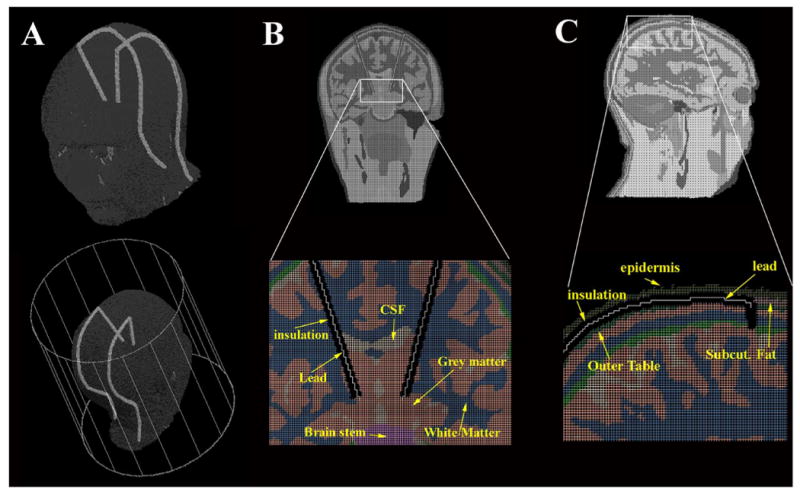
Geometrical model of the DBS implants. (A) 3D views of the head with the DBS implants placed in the RF coil modeled for the 3T study. (B) Coronal view of the head model with zoom of the implant inside the brain. The insulation was removed for illustrative purposes. (C) Sagittal view of head and zoom near one of the implants. Twenty-nine segments were used to model the leads and the insulation.
C. Numerical Model of Deep Brain Stimulation Implant
Two bilateral implants were modeled as insulated leads connected to the left and right subthalamic nucleus of the head (Fig. 6) [7]. Each of the two implants was composed of 19 wires, modeling the conductive DBS lead, each surrounded by a cylinder modeling the insulation (4 mm diameter, conductivity σd = 0 Sm−1, and permittivity εr_d = 3 [24]). The first segment started from the grey matter and was oriented diagonally on a coronal plane (z = 160) along the brain up to the outer table [Fig. 6(b)]; the cylindrical insulation for this segment was 2 mm shorter than the wire, to model the electrical contact (i.e., single electrode) of the DBS implant. The remaining segments of the implants were placed in the head model along the subcutaneous structure, between the epidermis and the outer table of the head model, along a different sagittal plane for the two implants (x = 128 and x = 193) [Fig. 6(c)]. Each wire was connected to the previous one. The last segment was terminated at the last axial slice of the head model, by the neck. Apart for the segment connected to the grey matter, the length of each cylinder and wire was the same for all other 18 segments. The total length of the left lead was 373 mm, with the maximum segment length equal to 80 mm (first segment) and the minimum segment length equal to 5 mm (second segment); the total length of the right lead was 380 mm, with the maximum segment length equal to 81 mm (first segment) and the minimum segment length equal to 5 mm. Eight different lead resistivities were modeled: a perfect electrical conductor (PEC) lead [24] and seven materials with variable resistivity (ρlead = 10−4, 10−3, 0.002, 0.01, 0.02, 0.1, and 1 Ωm; electrical permittivity εr_l = 15).
Fig. 6.

SAR values at the tip of the right and left lead, corresponding to (x, y, z) = (153,160,167) and (x, y, z) = (173,160,167), respectively. The computational model allowed estimating the asymmetric SAR changes between the two leads. The increasing lead resistivity allowed for a reduction of SAR1 g and SAR10 g below IEC guidelines for ρ > 0.002 Ωm.
D. Finite-Difference-Time-Domain Simulations
FDTD simulations were performed using commercially available software (XFDTD, Remcom Inc., State College, PA). Numerical simulations were performed on the head model with and without DBS leads with isotropic Yee Cells [27]. The total number of Yee cells for the head model was 4 642 730; the total volume, including the free space around the model, was 323 × 373 × 323 mm3. Since the cell size was 1 mm3 the timestep used to ensure FDTD stability from the Courant condition was 1.92 ps [28], with a total of 50 000 timesteps corresponding to over 12 cycles covered and a steady-state reached after approximately 0.1 μs. Seven perfectly matching layers were used for boundary conditions [29]. The simulation run time was approximately two days on a DualCore 1.6 GHz with 4 GB of RAM.
SAR Evaluation
1 mm3 SAR (SAR1 mm-iso), 1 g averaged (SAR1 g), 10 g averaged (SAR10 g), and whole-head SAR (SARw) were computed with the XFDTD software, based on the Caputa algorithm [30]. SAR was not computed along the wire and the insulation (Fig. 5). The overall mass used in the calculation was 4.895 kg for the no-lead case and 4.868 kg for the lead case. The simulations results were normalized to obtain an SARw for the no-lead case equal to 3.2 W/kg (i.e., maximum whole-head SAR allowed by the EC [8]).
Fig. 5.
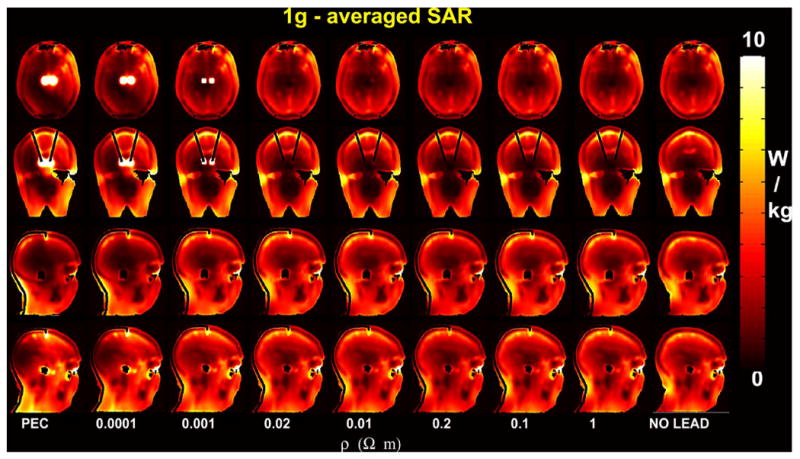
(Top) SAR1 g with variable lead resistivity and without DBS leads along an axial slice (z = 167) immediately below the tip of the leads, a coronal slice (y = 160) and two sagittal slices (x = 129 and x = 193) containing the DBS leads (see also Fig. 2). The input power was normalized to obtain a SARw = 3.2 W/kg for the no-lead case.
III. Results
As shown in Table II, the input power was approximately equal across the models (mean = 23.9 W; stdev = 1.5 W). The load of the head on the RF coil, namely the power dissipated in the head, was also approximately constant with lead resistivity (mean = 18.6 W, stdev = 1.66 W). The SARw was also similar across the models considered (mean = 3.1 W/kg, stdev = 0.16 W/kg).
Table II.
Power with Variable DBS Lead Resistivity: Input, i.e., Sum of the Power in Each of the 16 Current Generators; Dissipated, i.e. Total Power Dissipated Inside the Head; Radiated, i.e., Power Absorbed by the Boundaries.
| PEC | Resistivity ρ [Ω m] | no_lead | |||||||
|---|---|---|---|---|---|---|---|---|---|
|
| |||||||||
| ρ = 0.0001 | ρ = 0.001 | ρ = 0.002 | ρ = 0.01 | ρ = 0.02 | ρ = 0.1 | ρ = l | |||
| Input [W] | 26.6 | 26.4 | 24.5 | 23.0 | 23.3 | 23.0 | 22.9 | 22.9 | 22.8 |
| Power dissipated in head [W] | 21.7 | 21.1 | 19.1 | 17.6 | 17.9 | 17.6 | 17.5 | 17.5 | 17.8 |
| Power radiated [W] | 4.9 | 5.3 | 5.4 | 5.4 | 5.4 | 5.4 | 5.4 | 5.4 | 5.0 |
| Radiation Efficiency (%) | 18.3% | 19.9% | 21.7% | 23.4% | 23.2% | 23.4% | 23.4% | 23.4% | 22.2% |
The average value of B1 field in the no-lead case was in the order of few μT (e.g., mean = 5.26 μT and stdev = 0.8 μT along the x- direction, with y = 160 and z = 167) (Fig. 3). The B1 field was increasing from the boundaries toward the center of the head (see Figs. 3 and 4). Conversely, the electric field decreased from the boundaries toward the center of the head (Fig. 4) (e.g., mean = 93.6 V/m and stdev = 60.3 V/m along the x-direction, with y = 160 and z = 167).
Fig. 3.

(Top). Amplitude of magnetic field, electric field and induced currents without and with PEC DBS leads. The fields are shown for an axial slice (z = 167) immediately below the tip of the lead, where the maximum electric field was observed; a coronal slice (y = 160) and two sagittal slices (x = 129 and x = 193) containing the DBS leads.
Fig. 4.
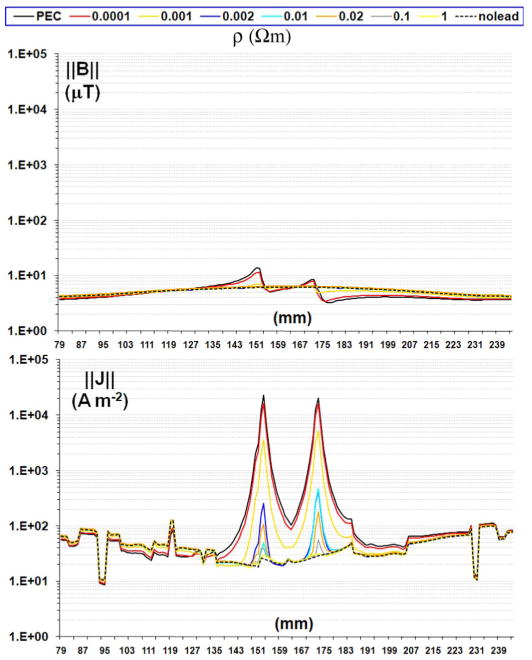
Profile of magnetic field (top) and induced currents with different lead resistivity on the axial slice adjacent and below the tip of the lead (i.e., y = 160 and z = 167).
For the model with DBS leads, electric field, induced currents and SAR were highest inside the grey matter, in the voxels adjacent to the tip of the DBS leads, namely (x, y, z) = (153 , 156 , 160) and (x, y, z) = (173, 156, 160). Specifically, for PEC lead
and no-lead case, peak values of electric field were
and
The computed values of induced currents were
and
Finally, SAR values in the same voxels were Peak SAR1 mm-iso
and
SAR1 g:
and
SAR10 g:
and
IV. Discussion
A. Computational Models and Implants
Although computational models have been frequently used to estimate SAR deposition during MRI, only a few previous studies based on numerical models for implants have been published [16], [31]. For the implant case, the resolution plays a major role to minimize errors related to staircasing of small structures. This study was conducted with a 1 mm3 resolution, compared to 5 mm3 used in [16] and 2 mm3 of [31]. This resolution allowed modeling anatomical interfaces with significant changes in electrical properties (e.g., outer table/diploe/inner table, dura/CSF/grey matter) (Fig. 1 and Table I) [19]. The curvature of the lead was modeled using 19 pieces and avoiding unrealistic sharp angles and allowing to model the inclination of the implant through the brain into the STN; finally, the cylindrical insulation was modeled using two Yee cells around the wire/lead, ensuring no direct contact in any point of the grid between the conductive wire and the surrounding structures of the human head model (Fig. 2).
B. Conductive and Resistive Leads
1) Conductive Leads
The presence of conductive leads in the RF field generated by the RF coil determines significant electromagnetic changes in terms of induced currents along the wire at the excitation Larmor frequency ω [32] as well as changes of EM field around the leads, visible along the brain section and the subcutaneous structures containing the leads (Fig. 3). Such effects can induce enhancements of orders of magnitude both in electric field and RF power deposition at the tip of conductive leads exposed to the incident RF field, as described by theoretical [13], [14], computational [16], [20], [31], and experimental [3], [5], [33] studies evaluating conductive leads exposed to RF field. In line with the antenna effect described in literature, this study showed a 840-fold maximum increase for induced currents—inside the grey matter adjacent to the tip of the lead—when comparing the cases with versus without PEC leads [16], [20] (Fig. 4). There was a five order of magnitude increase with versus without leads for one-voxel (1 mm3) SAR, 2000-fold for SAR1 g, and 100-fold for SAR10 g.
2) Variable Resistivity
Simulations showed that SAR at the tip of the DBS leads was reduced for resistivity values in the range of 0.001 Ωm < ρlead < 1 Ωm) (Figs. 5 and 6). Fig. 6 can be interpreted as a risk/cost function: the optimal value of resistivity will minimize both SAR dissipation at RF and power dissipation for the DBS system. New and potentially safer leads with higher resistivity can be built by employing conductive ink technology [34]. A new type of lead, the resistive tapered stripline (RTS), with low resistivity at low frequency and high resistivity at the RF frequencies has also been investigated [35]. Furthermore, nonmetallic textile structures, such as knitted, woven, or bare fibers, can be made electrically conductive with the desired resistivity [36].
3) Very High-Resistivity (ρlead ≥ 0.1 Ωm)
High resistivity cables are used in electric field measurements [37], given their properties of RF-transparency [38]. Similarly, high resistive DBS leads could be considered RF-transparent for this study, as did not interfere with the RF field and local EM and SAR values were similar to the no-lead case. The main issue with highly resistive leads is the power deposition during normal operation. The currents used in DBS range from hundreds of microamperes to a few milliampere peak-to-peak. Considering that DBS systems are designed to include light and portable batteries, the power dissipated by the stimulating current must be minimized to extend battery life. Moreover, high resistivity requires a higher voltage to generate the same level of stimulating current, which is a potential safety issue [39], [40]. For example, a resistivity value of ρ = 0.1 Ωm, found with commercially available nylon-based fibers with copper coating (e.g., F0102T3P1, Marktek Inc, Chesterfield, MO, resistance = 135 kΩ for 1 m length and cross-sectional area of approximately 0.8, 10−6 m2), would provide a strong protection against risk but power dissipation in the wire of several milliwatts.
C. Coil Coupling
A recent experimental study found no significant changes in RF power scanner calibration at 1.5 T measured with patients before and after the DBS implant surgery [41]. Similarly, our study showed a modest influence of the leads with respect to overall coupling between coil and load (i.e., 13% of change for dissipated power with and without the DBS PEC leads, Table II). Higher conductivity leads (PEC, ρlead = 0.0001 Om, and ρlead = 0.001 Ωm) generated changes up to 40% in source impedance. Source impedances with high values of resistivities were instead similar to the control case without leads (ρlead ≥ 0.002 Ωm).
D. Coil Modeling and B1 Field
The RF coil was modeled as a birdcage with ideal voltage sources, a simplification of the coils used at 3T, which typically include high-pass or band-pass birdcage coils [23]; nevertheless, the simulations results were in line with previous work that showed good agreement between simulations and experiments for a head-sized birdcage coil at 3T [42] or between simulations for a body-sized birdcage coil at 3T [43]. The simulated B field for the reference case of no-leads was homogeneous (Figs. 3 and 4), with an average value of 5 μT in the central slice of the head when power was normalized to obtain a whole-head SAR of 3.2 W/kg (maximum whole-head averaged SAR allowed by the IEC guidelines [8]). The numerical model used in this study would thus predict power levels for standard imaging within guidelines (e.g., 2 μT necessary to excite a 90° flip-angle at 3T [23] obtained with a whole-head SAR of 1.3 W/kg). In Fig. 3 are also clearly visible the distortions to the magnetic field due to the antenna effect of the conductive leads, which were reduced with increased lead resistivity. Recent experimental studies have in fact proposed the use of B1 distortions as a tool to quantify induced currents in conductive leads at 3T MRI [44].
E. Left-Right Asymmetry of EM Field and SAR
There was lack of left–right symmetry of SAR with respect to the central sagittal plane, with related differences up to one order of magnitude for local SAR between left and right tip of the leads (Figs. 5 and 6). Such results are likely related to the geometrical configuration of the head with respect of the circularly-polarized coil, as suggested by a previous analytical study [45]. Simulations showed that normalizing input power with respect to a whole-head SAR of 3.2 W/kg would generate peak of 10 g averaged SAR beyond 10 W/kg, value currently accepted by IEC guidelines. These results suggest that whole-head SAR used in current guidelines [7] may be an excessively coarse pa- rameter for RF-dosimetric evaluation with implants. Apart for the SAR peaks at the tip of the leads, there were SAR peaks in the eye region and in the front of the head, likely due to the position of the head with respect to the coil. Further investigation including a detailed thermal modeling is suggested [3], [12], [33].
F. Limitations
Variable geometries and loops are often used in implanted DBS leads as a potential solution for tissue heating [46]. Since the variable of interest for this study was the lead resistivity, in our simulations each implant was modeled using a constant geometry (i.e., no loops or variable length) along the parenchyma and the subcutaneous structures. Also, a single contact (i.e., electrode) to the gray matter, near the subthalamic area was modeled [7] compared to the multiple contacts of DBS implants.
This study was conducted with a 1-mm3 resolution head model truncated at the neck. Although such resolution is one of the highest for anatomically-precise numerical models used for RF-dosimetry [47], numerical errors related to staircasing of small structures may be present [48], [49]. Furthermore, the truncation of the head model at the neck did not allow to realistically model the full length for the implants, usually connected to a stimulator placed on the chest [6] and lead to artificial peaks of SAR at the neck [50], [51], which were not taken into consideration in evaluating the effect of lead resistivity. Higher numerical resolution models including the shoulders would allow represent with further increased precision discontinuities in electrical properties (e.g., inter-vertebral discs and vertebrae) and improving the overall model of the coil load.
Due to the potential numerical errors, experimental measurements may be required for proper validation of the results. Numerical simulations performed with the electrically homogeneous and heterogeneous models (Fig. 7), provided similar estimations, suggesting the possibility of experimental validations with a geometrically matching homogeneous phantom, current gold-standard for safety evaluation with MRI-compatible neurostimulators [3], [10], [52]–[54].
Fig. 7.

(Top) Amplitude of magnetic field, electric field and induced currents with PEC leads estimated with an electrically heterogeneous and homogeneous head model with PEC DBS leads along an axial slice (z = 170) containing the lead tip (see Fig. 2). (Bottom) Profile of induced currents with heterogeneous and homogeneous model on the axial slice adjacent and below the tip of the lead (i.e., y = 160 and z = 167).
V. Conclusion
The present FDTD simulations with a multistructure 1-mm3 spatial-resolution head model allowed for detailed modeling of the path of the DBS leads between epidermis and the outer table, as for surgery procedure. The results confirmed the presence of local EM field and SAR enhancement at the tip of the DBS leads, in line with the antenna effect described for metallic implants. For PEC leads simulations with a homogeneous model provided similar estimation of SAR at the tip of the DBS implant compared to an electrically heterogeneous head model. Simulations showed that antenna performance and whole-head SAR were sensitive to the presence of the DBS leads only within 10%, compared to changes of over one order of magnitude for peak 10 g averaged SAR, suggesting the need of using local SAR values for guidelines purposes with DBS. Computational models such the one proposed can support the development of novel lead technology, properly balancing the requirements of SAR deposition at the tip of the lead and power dissipation of the system battery.
Acknowledgments
The authors would like to thank all their colleagues for their help and insightful discussions: S. Fantini, M. Cronin-Golomb, P. Wong, D. Kaplan, P. Hammer with the Department of Biomedical Engineering, Tufts University; N. Makris, D. Kennedy, J. Kaiser, and the Center for Morphometric Analysis with the MGH Department of Neurology; E. Eskandar with the MGH Department of Neurosurgery; B. Rosen, L. Wald, W. Vanduffel, S. Mehl, N. Eusemann, G. Boas, and H. Millan with the MGH Department of Radiology; P. Purdon and R. Barbieri with the MGH Department of Anesthesia; C. Alt is with the MGH Wellman Center for Photomedicine; M. Liberti is with the Department of Electrical Engineering, University of Rome “La Sapienza, ” CK Chou and G. Bit-Babik with Motorola, and T. Grzegorczyk with the Massachusetts Institute of Technology.
This work was supported in part by the National Institute of Neurological Disorders And Stroke (R01 NS037462), in part by the National Institute of Biomedical Imaging and Bioengineering (R01EB006385), in part by the National Center for Research Resources (NCRR) (P41-RR14075), and in part by the MIND institute.
Footnotes
The mention of commercial products, their sources, or their use in connection with material reported herein is not to be construed as either an actual or implied endorsement of such products by the U.S. Food and Drug Administration.
Contributor Information
Jyrki Ahveninen, Athinoula A. Martinos Center for Biomedical Imaging, Department of Radiology, Massachusetts General Hospital, Harvard Medical School, Charlestown, MA 02129 USA.
John W. Belliveau, Athinoula A. Martinos Center for Biomedical Imaging, Department of Radiology, Massachusetts General Hospital, Harvard Medical School, Charlestown, MA 02129 USA
Giorgio Bonmassar, Athinoula A. Martinos Center for Biomedical Imaging, Department of Radiology, Massachusetts General Hospital, Harvard Medical School, Charlestown, MA 02129 USA.
References
- 1.Machado A, Rezai AR, Kopell BH, Gross RE, Sharan AD, Benabid AL. Deep brain stimulation for Parkinson's disease: Surgical technique and perioperative management. Movement Disorders. 2006 Jun;21:S247–258. doi: 10.1002/mds.20959. [DOI] [PubMed] [Google Scholar]
- 2.Benabid AL, Deuschl G, Lang AE, Lyons KE, Rezai AR. Deep brain stimulation for Parkinson's disease. Movement Disorders. 2006 Jun;21(no. Suppl 14):S168–170. doi: 10.1002/mds.20954. [DOI] [PubMed] [Google Scholar]
- 3.Baker KB, Tkach LA, Phillips MD, Rezai AR. Variability in RF-induced heating of a deep brain stimulation implant across MR systems. J Magn Reson Imag. 2006 Dec;24:1236–1242. doi: 10.1002/jmri.20769. [DOI] [PubMed] [Google Scholar]
- 4.Arantes PR, Cardoso EF, Barreiros MA, Teixeira MJ, Goncalves MR, Barbosa ER, Sukwinder SS, Leite CC, Amaro E., Jr Performing functional magnetic resonance imaging in patients with Parkinson's disease treated with deep brain stimulation. Movement Disorders. 2006 Aug;21:1154–1162. doi: 10.1002/mds.20912. [DOI] [PubMed] [Google Scholar]
- 5.Rezai AR, Baker KB, Tkach JA, Phillips M, Hrdlicka G, Sharan AD, Nyenhuis J, Ruggieri P, Shellock FG, Henderson J. Is magnetic resonance imaging safe for patients with neurostimulation systems used for deep brain stimulation? Neurosurgery. 2005 Nov;57:1056–1062. doi: 10.1227/01.neu.0000186935.87971.2a. [DOI] [PubMed] [Google Scholar]
- 6.Rezai AR, Phillips M, Baker KB, Sharan AD, Nyenhuis J, Tkach J, Henderson J, Shellock FG. Neurostimulation system used for deep brain stimulation (DBS): MR safety issues and implications of failing to follow safety recommendations. Invest Radiol. 2004 May;39:300–303. doi: 10.1097/01.rli.0000124940.02340.ab. [DOI] [PubMed] [Google Scholar]
- 7.Henderson JM, Tkach J, Phillips M, Baker K, Shellock FG, Rezai AR. Permanent neurological deficit related to magnetic resonance imaging in a patient with implanted deep brain stimulation electrodes for Parkinson's disease: Case report. Neurosurgery. 2005 Nov;57:E1063. doi: 10.1227/01.neu.0000180810.16964.3e. [DOI] [PubMed] [Google Scholar]
- 8.International Standard, Medical Equipment–Part 2–33: Particular Requirements for the Safety of the Magnetic Resonance Equipment for Medical Diagnosis, 60601-2-33. International Electrotechnical Commission; Geneva, Switzerland: 2002. [Google Scholar]
- 9.Bernardi P, Cavagnaro M, Pisa S, Piuzzi E. Specific absorption rate and temperature elevation in a subject exposed in the far-field of radio-frequency sources operating in the 10–900 MHz range. IEEE Trans Biomed Eng. 2003 Mar;50(no. 3):295–304. doi: 10.1109/TBME.2003.808809. [DOI] [PubMed] [Google Scholar]
- 10.Nguyen UD, Brown JS, Chang IA, Krycia J, Mirotznik MS. Numerical evaluation of heating of the human head due to magnetic resonance imaging. IEEE Trans Biomed Eng. 2004 Aug;51(no. 8):1301–1309. doi: 10.1109/TBME.2004.827559. [DOI] [PubMed] [Google Scholar]
- 11.Collins CM, Liu W, Wang J, Gruetter R, Vaughan JT, Ugurbil K, Smith MB. Temperature and SAR calculations for a human head within volume and surface coils at 64 and 300 MHz. J Magn Reson Imag. 2004 May;19:650–656. doi: 10.1002/jmri.20041. [DOI] [PubMed] [Google Scholar]
- 12.Nitz WR, Brinker G, Diehl D, Frese G. Specific absorption rate as a poor indicator of magnetic resonance-related implant heating. Invest Radiol. 2005 Dec;40:773–776. doi: 10.1097/01.rli.0000185898.59140.91. [DOI] [PubMed] [Google Scholar]
- 13.Guy AW. Biophysics–energy absorption and distribution. AGARD. 1974 [Google Scholar]
- 14.Radiofrequency electromagnetic fields: Properties, quantities and units, biophysical interaction, and measurement National Council Radiation Protection and Measurements. Vol. 67. Bethesda, MD: 1981. [Google Scholar]
- 15.Gabriel C, Gabriel S, Corthout E. The dielectric properties of biological tissues: I. Literature survey. Phys Med Biol. 1996;41:2231–2249. doi: 10.1088/0031-9155/41/11/001. [DOI] [PubMed] [Google Scholar]
- 16.Ho HS. Safety of metallic implants in magnetic resonance imaging. J Magn Reson Imag. 2001 Oct;14:472–477. doi: 10.1002/jmri.1209. [DOI] [PubMed] [Google Scholar]
- 17.Chou CK, McDougall JA, Chan KW. RF heating of implanted spinal fusion stimulator during magnetic resonance imaging. IEEE Trans Biomed Eng. 1997 May;44:367–373. doi: 10.1109/10.568912. [DOI] [PubMed] [Google Scholar]
- 18.Armenean C, Perrin E, Armenean M, Beuf O, Pilleul F, Saint-Jalmes H. RF-induced temperature elevation along metallic wires in clinical magnetic resonance imaging: Influence of diameter and length. Magn Reson Med. 2004 Nov;52:1200–1206. doi: 10.1002/mrm.20246. [DOI] [PubMed] [Google Scholar]
- 19.Makris N, Angelone L, Tulloch S, Sorg S, Kaiser J, Kennedy D, Bonmassar G. MRI-based anatomical model of the human head for specific absorption rate mapping. Med Biol Eng Comput. 2008 Dec;46:1239–1251. doi: 10.1007/s11517-008-0414-z. [DOI] [PMC free article] [PubMed] [Google Scholar]
- 20.Angelone LM, Potthast A, Segonne F, Iwaki S, Belliveau JW, Bonmassar G. Metallic electrodes and leads in simultaneous EEG-MRI: Specific absorption rate (SAR) simulation studies. Bioelectro-magnetics. 2004 May;25:285–295. doi: 10.1002/bem.10198. [DOI] [PubMed] [Google Scholar]
- 21.Vorst Av, Rosen A, Kotsuka Y. RF/Microwave Interaction With Biological Tissues. Hoboken, NJ: Wiley: 2006. p. 73. [Google Scholar]
- 22.Body tissue dielectric parameters tool Federal Communications Commission (FCC) [Online] Available: http://www.fcc.gov/fcc-bin/dielec.sh.
- 23.Collins CM, Smith MB. Signal-to-noise ratio and absorbed power as functions of main magnetic field strength, and definition of “90 degrees” RF pulse for the head in the birdcage coil. Magn Reson Med. 2001 Apr;45:684–691. doi: 10.1002/mrm.1091. [DOI] [PubMed] [Google Scholar]
- 24.Mohsin SA, Sheikh NM, Saeed U. MRI-induced heating of deep brain stimulation leads. Phys Med Biol. 2008;53:5745–5756. doi: 10.1088/0031-9155/53/20/012. [DOI] [PubMed] [Google Scholar]
- 25.Li QX, Gandhi OP. Thermal implications of the new relaxed IEEE RF safety standard for head exposures to cellular telephones at 835 and 1900 MHz. IEEE Trans Microw Theory Tech. 2006 Jan;54(no. 1):3146–3154. [Google Scholar]
- 26.DeMarco SC, Lazzi G, Liu W, Weiland JD, Humayun MS. Computed SAR and thermal elevation in a 0.25-mm 2-D model of the human eye and head in response to an implanted retinal stimulator—Part I: Models and methods. IEEE Trans Antennas Propag. 2003 Sep;51(no. 9):2274–2285. [Google Scholar]
- 27.Yee KS. Numerical solution of initial boundary value problems involving Maxwell's equations in isotropic media. IEEE Trans Antennas Propag. 14 1966 Mar;(no. 3):302–307. [Google Scholar]
- 28.Kunz KS, Luebbers RJ. The Finite Difference Time Domain Method for Electromagnetics. Boca Raton, FL: CRC Press; 1993. [Google Scholar]
- 29.Berenger JP. A perfectly macthed layer for the absorption of electromagnetic waves. J Comp Phys. 1994 Oct;114:185–200. [Google Scholar]
- 30.Caputa K, Okoniewski M, Stuchly MA. An algorithm for computations of the power deposition in human tissue. IEEE Antennas Propagat Mag. 1999 Aug;41:102–107. [Google Scholar]
- 31.Ibrahim TS, Tang L, Kangarlu A, Abraham R. Electromagnetic and modeling analyses of an implanted device at 3 and 7 Tesla. J Magn Reson Imag. 2007 Nov;26:1362–1367. doi: 10.1002/jmri.21148. [DOI] [PubMed] [Google Scholar]
- 32.Balanis CA. Antenna Theory: Analysis and Design. 3rd. Hoboken, NJ: Wiley; 2005. p. 443. [Google Scholar]
- 33.Bassen H, Kainz W, Mendoza G, Kellom T. MRI-induced heating of selected thin wire metallic implants– Laboratory and computational studies– Findings and new questions raised. Minimally Invasive Therory Allied Technol. 2006;15:76–84. doi: 10.1080/13645700600640931. [DOI] [PubMed] [Google Scholar]
- 34.Vasios CE, Angelone LM, Purdon PL, Ahveninen J, Belliveau JW, Bonmassar G. EEG/(f)MRI measurements at 7 Tesla using a new EEG cap (“InkCap”) Neuroimage. 2006 Dec;33:1082–1092. doi: 10.1016/j.neuroimage.2006.07.038. [DOI] [PubMed] [Google Scholar]
- 35.Bonmassar G. Resistive tapered stripline (RTS) in electroencephalogram recordings during MRI. IEEE Trans Microw Theory Tech. 2004 Aug;52:1992–1998. [Google Scholar]
- 36.Shaw RK, Long B, Werner D, Gavrin A. The characterization of conductive textile materials intended for radio frequency applications. IEEE Antennas Propag Mag. 2007 Jun;49:28–40. [Google Scholar]
- 37.Larsen E, Ries F. Design and calibration of the NBS isotropic electric field monitor (EFM-5), 0.2to 1000 MHz. Nat Bureau Std Tech Note Rep. 1981;1033 [Google Scholar]
- 38.Smith G. Analysis of miniature electric field probes with resistive transmission lines. IEEE Trans Microw Theory Tech. 1981 Nov;29(no. 11):1213–1224. [Google Scholar]
- 39.Reilly JP. Applied Bioelectricity: From Electrical Stimulation to Electropathology. New York: Springer Verlag; 1998. p. 412. [Google Scholar]
- 40.Grill W. Safety considerations for deep brain stimulation: Review and analysis. Expert Rev Med Devices. 2005;2:409–420. doi: 10.1586/17434440.2.4.409. [DOI] [PubMed] [Google Scholar]
- 41.Bernstein M, Ward H, McGee K, Felmlee J, Knudsen1 V, Gorny K, Huston J, III, Lee K. Changes in RF transmit gain before and after DBS lead placement in 36 consecutive patients. Proc Int Soc Mag Reson Med. 2009;17:3105. [Google Scholar]
- 42.Alecci M, Collins CM, Smith MB, Jezzard P. Radio frequency magneticfield mapping of a 3 Tesla birdcage coil: Experimental and theoretical dependence on sample properties. Magn Reson Med. 2001 Aug;46:379–385. doi: 10.1002/mrm.1201. [DOI] [PubMed] [Google Scholar]
- 43.Liu W, Collins CM, Smith MB. Calculations of B1 distribution, specific energy absorption rate, and intrinsic signal-to-Noise ratio for a body-size birdcage coil loaded with different human subjects at 64 and 128 MHz. Appl Magn Reson. 2005;29:5–18. doi: 10.1007/BF03166953. [DOI] [PMC free article] [PubMed] [Google Scholar]
- 44.van den Bosch MR, Moerland MA, van Lier AL, Bartels LW, Lagendijk JJ, van den Berg CA. New method to quantify RF induced currents inside conductive wires. Proc Int Soc Mag Reson Med. 2009;17:4792. [Google Scholar]
- 45.Sled JG, Pike GB. Standing-wave and RF penetration artifacts caused by elliptic geometry: An electrodynamic analysis of MRI. IEEE Trans Med Imag. 1998 Aug;17:653–662. doi: 10.1109/42.730409. [DOI] [PubMed] [Google Scholar]
- 46.Baker KB, Tkach J, Hall JD, Nyenhuis JA, Shellock FG, Rezai AR. Reduction of magnetic resonance imaging-related heating in deep brain stimulation leads using a lead management device. Neurosurgery. 2005;57:392–397. doi: 10.1227/01.neu.0000176877.26994.0c. [DOI] [PubMed] [Google Scholar]
- 47.Kainz W, Christ A, Kellom T, Seidman S, Nikoloski N, Beard B, Kuster N. Dosimetric comparison of the specific anthropomorphic mannequin (SAM) to 14 anatomical head models using a novel definition for the mobile phone positioning. Phys Med Biol. 2005 Jul;50:3423–3445. doi: 10.1088/0031-9155/50/14/016. [DOI] [PMC free article] [PubMed] [Google Scholar]
- 48.Railton CJ, Schneider JB. An analytical and numerical analysis of several locally conformal FDTD schemes. IEEE Trans Microw Theory Tech. 1999 Jan;47(1):56–66. [Google Scholar]
- 49.Gajsek P, Walters TJ, Hurt WD, Ziriax JM, Nelson DA, Mason PA. Empirical validation of SAR values predicted by FDTD modeling. Bioelectromagnetics. 2002 Jan;23:37–48. doi: 10.1002/bem.96. [DOI] [PubMed] [Google Scholar]
- 50.Jin JM, Chen J, Chew WC, Gan H, Magin RL, Dimbylow PJ. Computation of electromagnetic fields for high-frequency magnetic resonance imaging applications. Phys Med Biol. 1996 Dec;41:2719–2738. doi: 10.1088/0031-9155/41/12/011. [DOI] [PubMed] [Google Scholar]
- 51.Gandhi OP, Chen XB. Specific absorption rates and induced current densities for an anatomy-based model of the human for exposure to time-varying magnetic fields of MRI. Magn Reson Med. 1999 Apr;41:816–823. doi: 10.1002/(sici)1522-2594(199904)41:4<816::aid-mrm22>3.0.co;2-5. [DOI] [PubMed] [Google Scholar]
- 52.Rezai AR, Finelli D, Nyenhuis JA, Hrdlicka G, Tkach J, Sharan A, Rugieri P, Stypulkowski PH, Shellock FG. Neurostimulation systems for deep brain stimulation: In vitro evaluation of magnetic resonance imaging-related heating at 1.5 Tesla. J Magn Reson Imag. 2002 Nov;15:241–250. doi: 10.1002/jmri.10069. [DOI] [PubMed] [Google Scholar]
- 53.Angelone LM, Vasios CE, Wiggins G, Purdon PL, Bonmassar G. On the effect of resistive EEG electrodes and leads during 7 T MRI: Simulation and temperature measurement studies. Magn Reson Imag. 2006 Jul;24:801–812. doi: 10.1016/j.mri.2006.01.006. [DOI] [PubMed] [Google Scholar]
- 54.Ibrahim TS, Lee R, Abduljalil AM, Baertlein BA, Robitaille PM. Dielectric resonances and B(1) field inhomogeneity in UHFMRI: Computational analysis and experimental findings. Magn Reson Imag. 2001 Oct;19:219–226. doi: 10.1016/s0730-725x(01)00300-9. [DOI] [PubMed] [Google Scholar]